

Andrew Sorkin et al. mention “mixed signals” regarding the prospects of recession. I thought it useful to plot some indicators. First, standard term spreads and one credit spread.
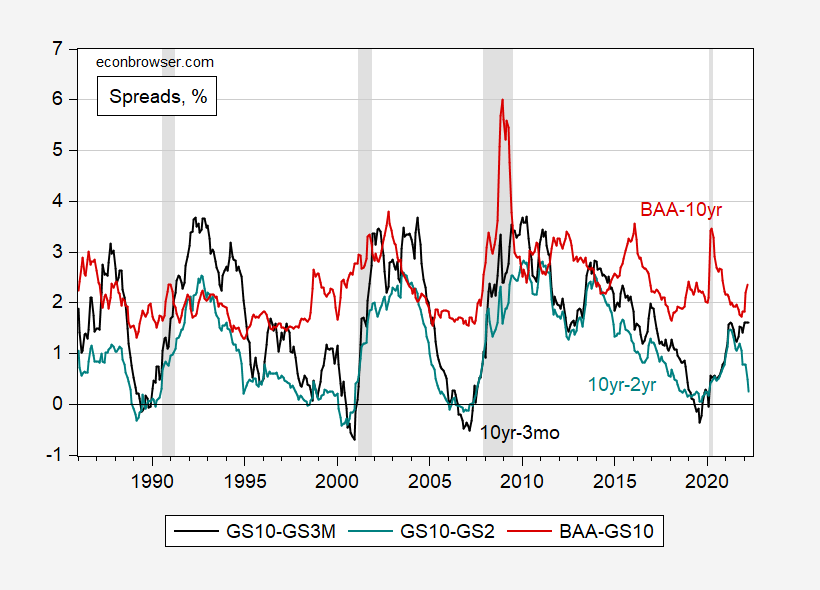
Figure 1: 10 year – 3 month Treasury spread (black), 10 year – 2 year spread (teal), and BAA-10 year Treasury spread (red), all in %. Data for March through 3/23. NBER defined recession dates peak-to-trough shaded gray. Source: FRED, NBER, and author’s calculations.
The 10 year – 2-year spread has shrunk considerably, but the 10 year – 3-month has not – and indeed has widened. The 18-month 3-month forward minus 3-month spread (not shown above; see figure from Deutsche Bank at bottom of post) favored by Chair Powell has widened as well, so the case is not strong for an incipient recession
As noted before, older conventional wisdom suggested term spreads as leading indicators, and credit spreads (as in the BAA-Treasury spread shown in Figure 1) as contemporaneous indicators, of recession. Here is an additional credit spread, and the VIX depicted:
(Click on image to enlarge)
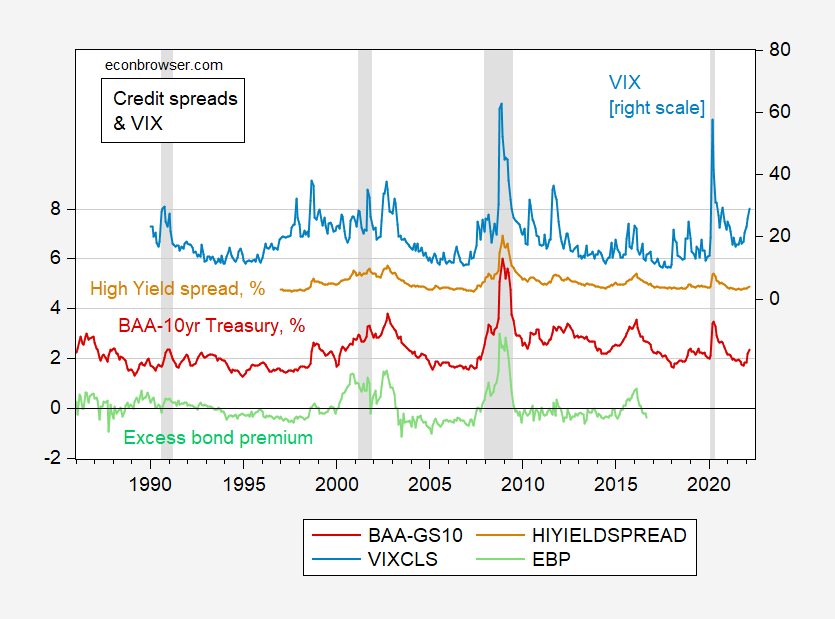
Figure 2:BAA-10 year Treasury spread (red, left scale), ICE BofA US High Yield Index Option-Adjusted Spread (brown, left scale), Excess Bond Premium (light green, left scale), all in %; VIX (light blue, right scale). Data for March through 3/23. NBER defined recession dates peak-to-trough shaded gray. Source: FRED, Favara et al. (2016), NBER, and author’s calculations.
The BAA-10 year Treasury spread is not an ideal credit spread since it doesn’t account for differing maturities for the corporate bonds. The high yield spread does. However, neither adjusts for risk aversion, which the Giovanni Favara, Simon Gilchrist, Kurt F. Lewis, and Egon Zakrajšek Excess Bond Premium (EBP) does (see discussion in this post; see [1], [2]). Unfortunately, the latter ends in 2016, so we don’t have insights from this measure for the current situation. Still, the fact that the two credit spreads covary with the EBP is suggestive that both credit spreads and term spreads are signaling heightened probability of recession. However, even the 10yr-2yr is indicating only about a 19% probability of a recession in the next year, using a plain vanilla probit over the 1986-2021 sample (for the sake of comparison, in 2006M11, the implied probability of recession in the next year was 29%, in 2000M04, 38%).
For nostalgia’s sake, here’s my September 2019 prediction of recession for August 2020, using a plain-vanilla probit.
Addendum: 18-month forward 3-month minus spot 3-month spread (dark blue, left scale), 10yr-2yr Treasury spread (light blue, right scale).

Source: Luzzetti, et al. “Which curve signal to trust: The party in the front or business in the back?” Deutsche Bank, 25 March 2022.



Comments
Log in or sign up to join the conversation.