


The stock market is in freefall and tech stocks are collapsing as the 10-year Treasury yield breaks back below 5 percent, a move Gareth Soloway says is signaling recession. In this video, Gareth explains why oil is the real culprit and lays out the key levels for the S&P 500, the Nasdaq, gold, silver and Bitcoin (BTC.X).
Gareth starts on the oil chart. Oil has averaged about $95 a barrel since the war with Iran broke out in February. He explains why eight months of high gas, diesel and heating oil prices could be the straw that breaks the camel’s back for the consumer. He also shows why a falling 10-year yield on a day oil is rising means the bond market is pricing in a recession.
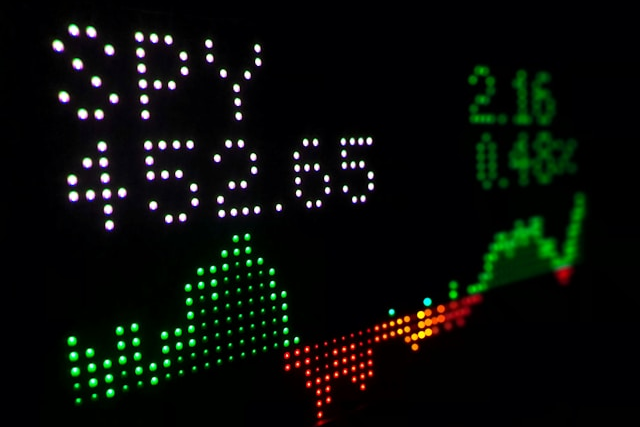
On the S&P 500, Gareth marks the short-term trend line that decides the next few days. The touch point is 7,655. A close below opens 7,550 and then 7,465, and a hold keeps a path back above 7,800 alive. The Nasdaq Composite is down 2.5 percent and heading into key support near 25,920, with 24,600 to 24,400 below. Gareth explains why he has been a net buyer into the fear and walks through ANET, VRT and the $210 trend line on NVIDIA (NVDA).
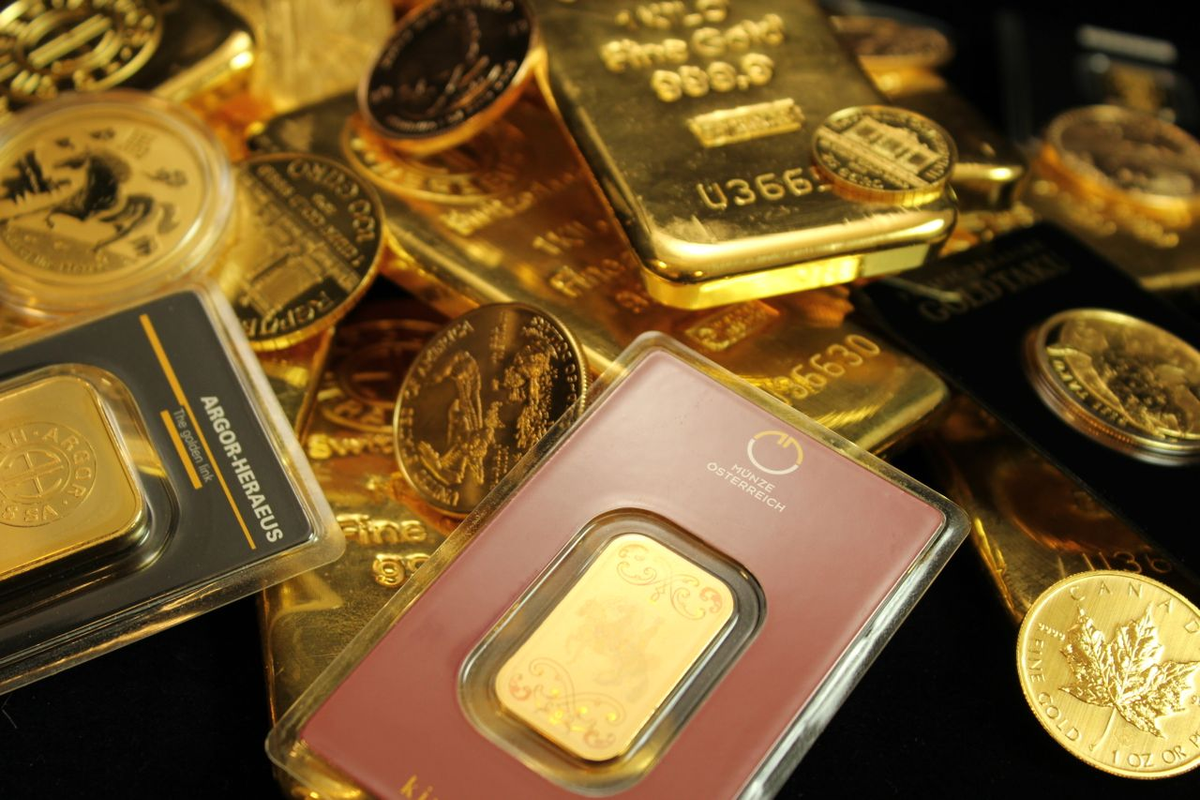
Gold has confirmed its breakdown, with $3,950 the next major support and $3,500 below it. Silver’s bear flag breakdown puts $54 and then $50 in play. Bitcoin is hanging on to $81,000.

Comments
Log in or sign up to join the conversation.