

Industrial production is down relative to the previous month, and relative to the recent peak. GDP, sales, and personal income are all below the recent peak as well. Nonfarm payroll employment continues to plug along — although at a decelerating pace (1.53% y/y).
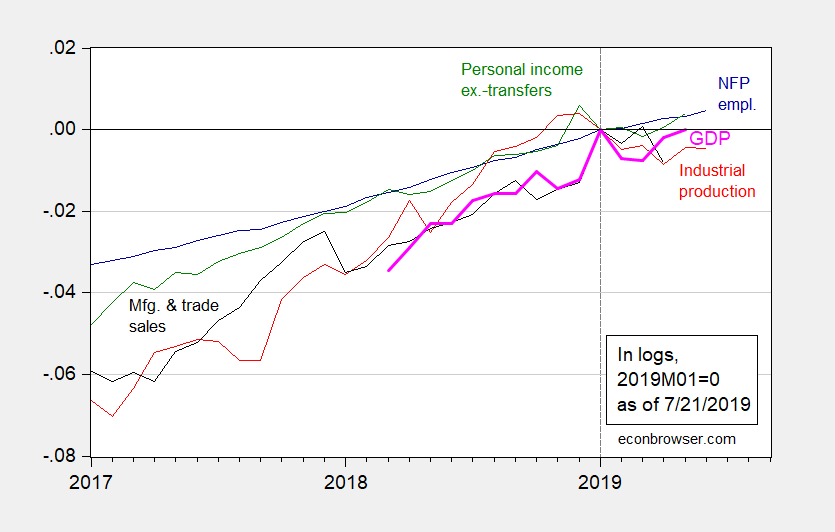
Figure 1: Nonfarm payroll employment (blue), industrial production (red), personal income excluding transfers in Ch.2012$ (green), manufacturing and trade sales in Ch.2012$ (black), and monthly GDP in Ch.2012$ (pink bold), all log normalized to 2019M01=0.Source: BLS, Federal Reserve, BEA, via FRED, Macroeconomic Advisers (6/26 release), and author’s calculations.
Note that manufacturing has recovered somewhat since last posting.
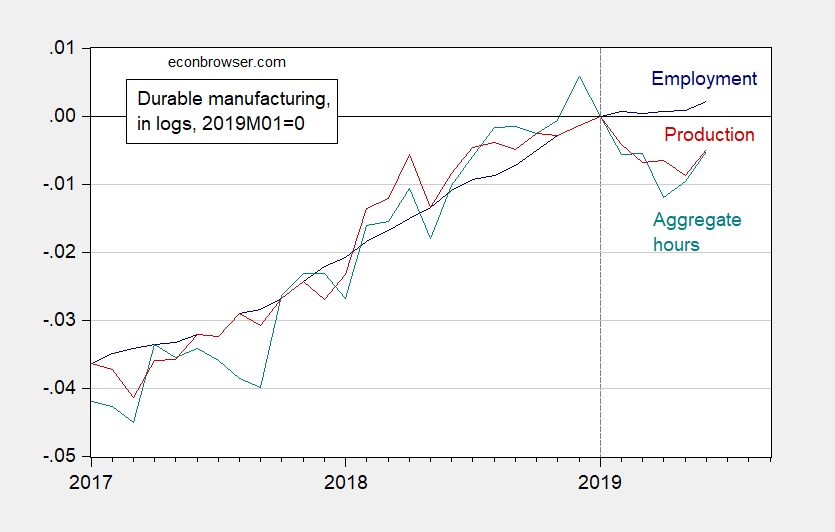
Figure 2: Manufacturing employment (blue), aggregate hours of production and nonsupervisory workers (red) and production (teal), in logs 2019M01=0. Source: BLS, Federal Reserve via FRED, and author’s calculations.


Comments
Log in or sign up to join the conversation.