


As per usual, real retail sales is one of my favorite forecasting tools, since it tells us a lot about the consumer on a timely basis, and since consumer spending leads employment, and real retail sales per capita are a good non-financial long leading indicator.
On a nominal basis, retail sales have tended to be very positive most of this year, in part due to depressed comparisons post-“Liberation Day” last year. Although I won’t show the graph this week, they have tended to track the weekly data published by Redbook, which has shown YoY sales up in the 8%-9% range nominally.
To cut to the chase, October was weakly positive nominally but negative on an inflation-adjusted basis. Sales were higher nominally by 0.2% m/m and 6.8% YoY. But consumer inflation was up 0.4% m/m, so after rounding real retail sales declined -0.1%. Here’s what real sales (red), and real sales per capita (blue) look like for the past several years (courtesy of Steven Miller and the T—-p Administration, US population growth has slowed to only 0.2% YoY, one of the lowest such rates in decades, so this year the lines are virtually identical) :
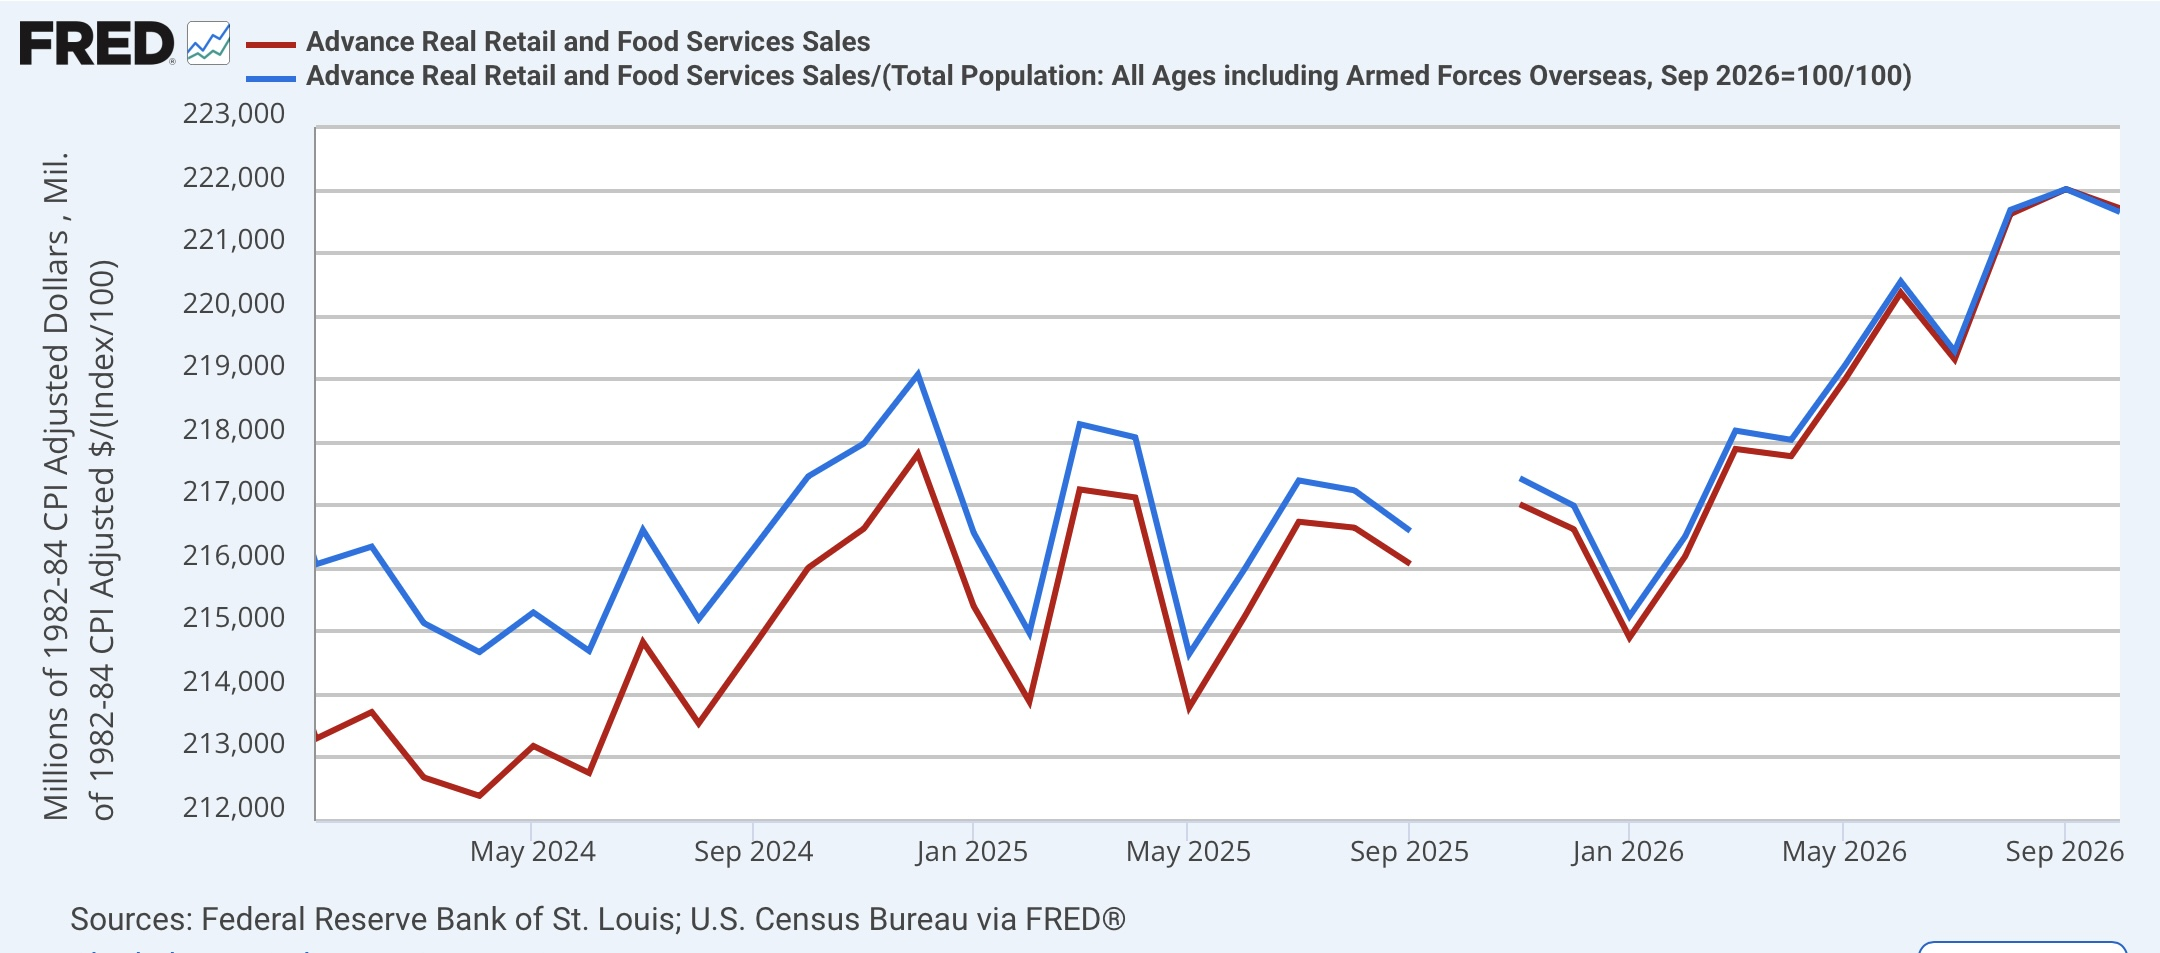
Note that one month ago, September, was also their peak, so neither one is even close to forecasting a recession at this time.
With inflation estimated (due to the government shutdown one year ago) at 3.9% YoY, real retail sales YoY increased an estimated 3.0%, and on a per capita basis increased 2.8%. Note that the above graph, for the same reason, cannot show this month:
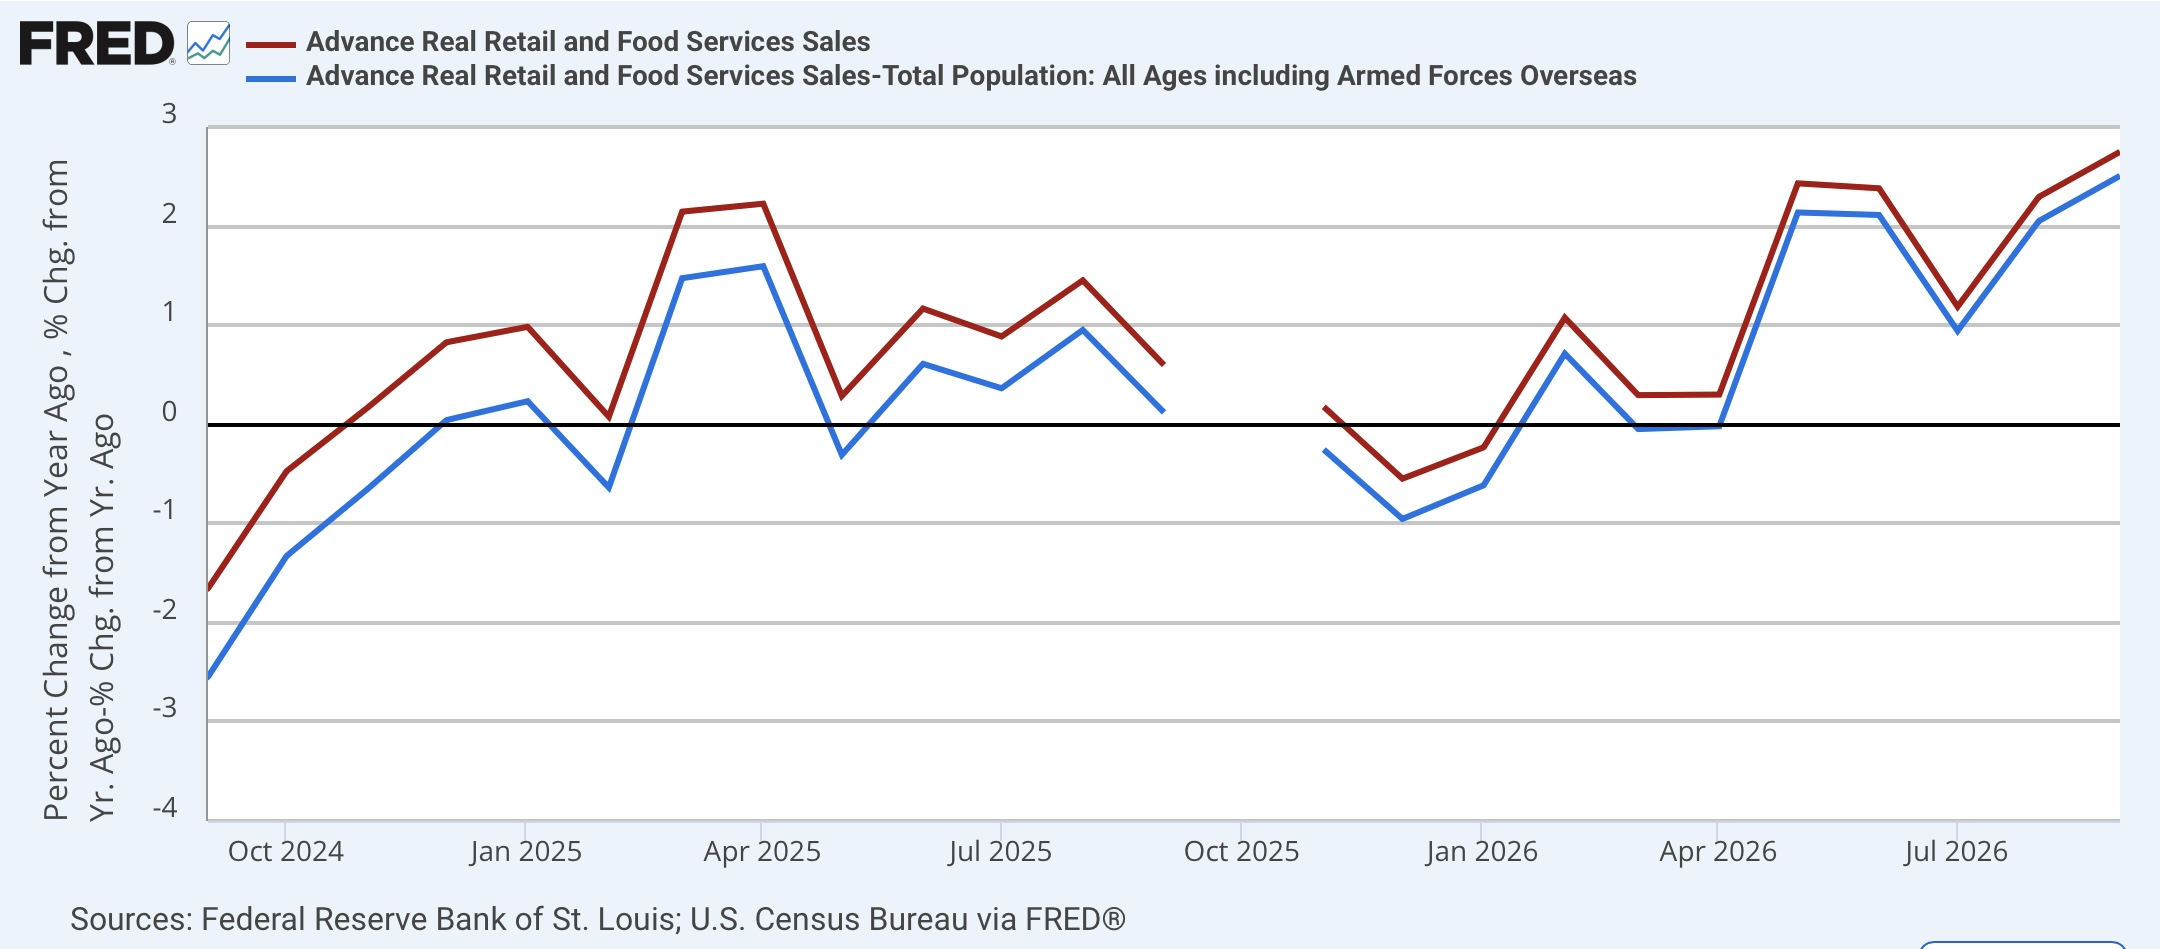
This remains very positive.
Since real retail sales tend to lead employment, here is the update on that relationship:
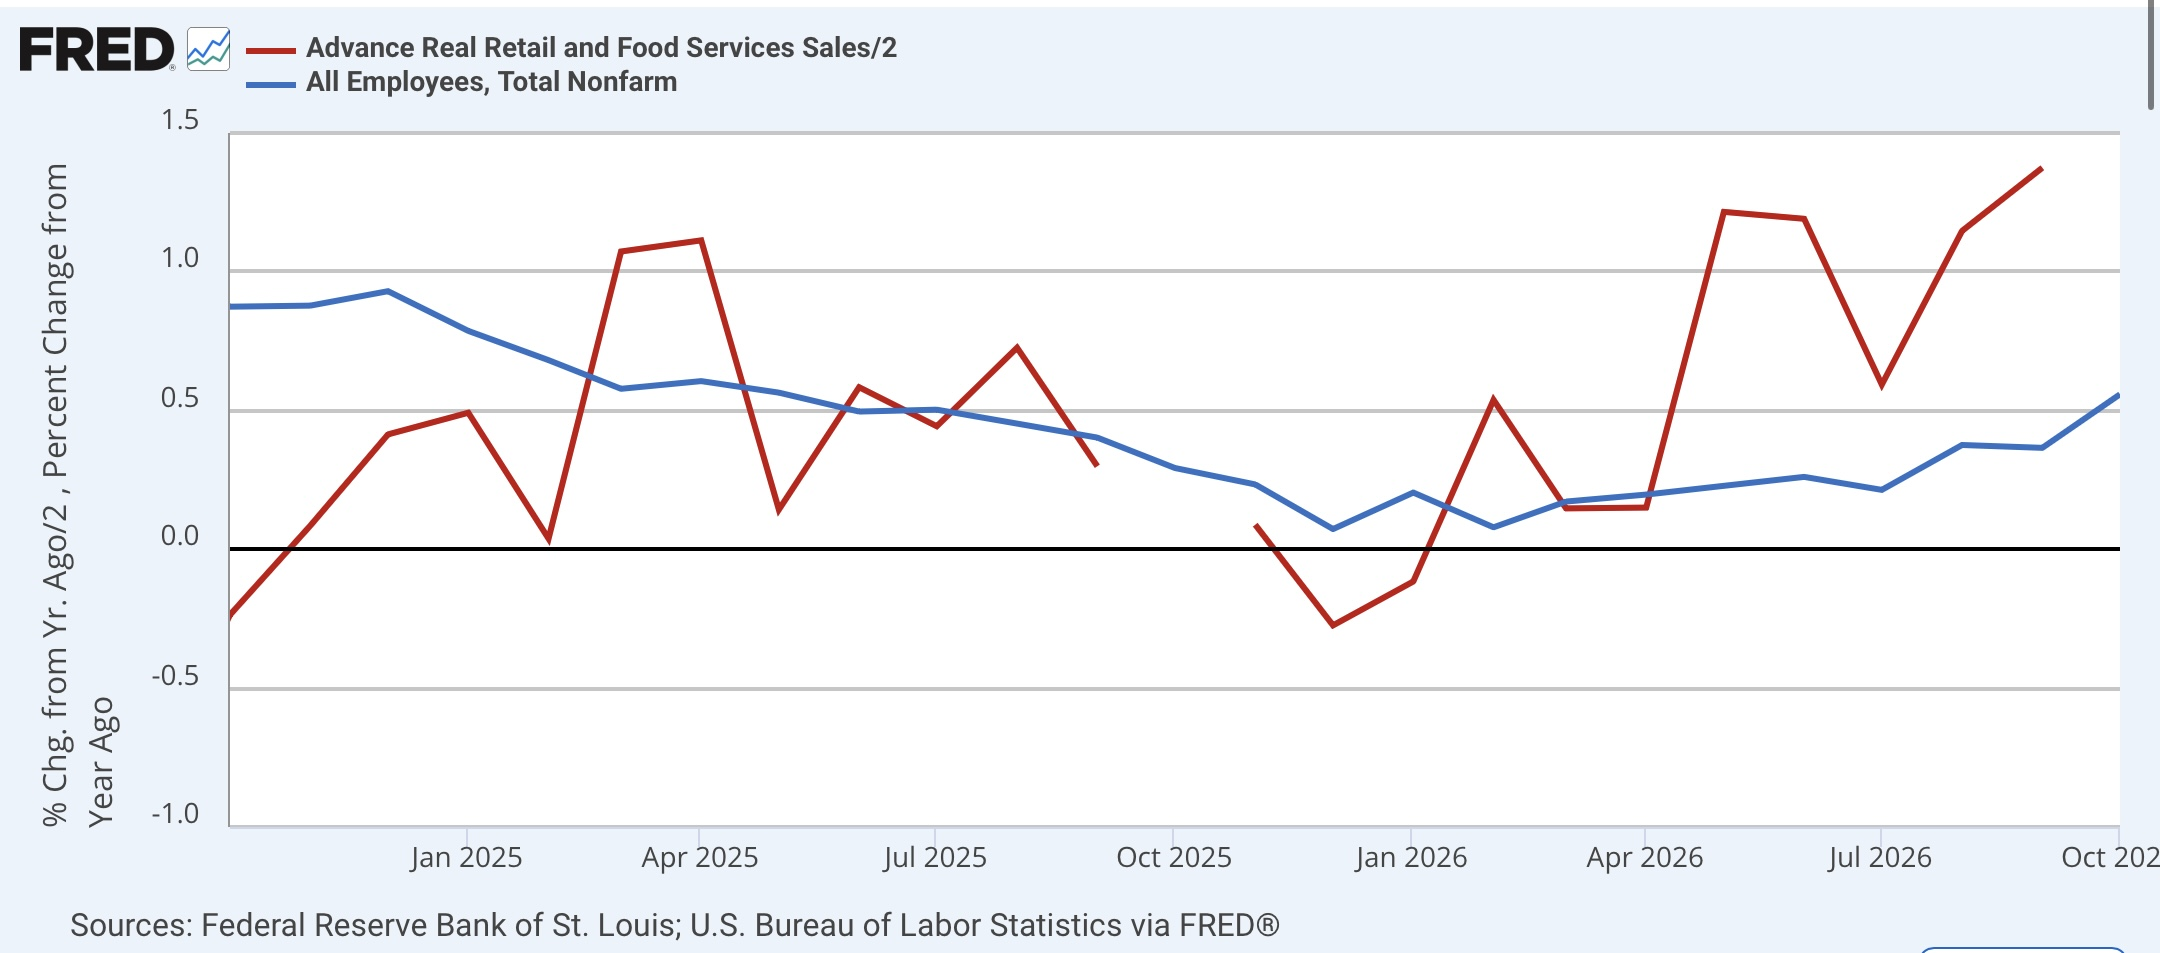
Again, this forecasts continued employment gains over the next few months. And again, almost all of this traces back to the AI data center Boom - or bubble.



Comments
Log in or sign up to join the conversation.