
Econintersect: Week 35 of 2014 shows same week total rail traffic (from same week one year ago) grew according to the Association of American Railroads (AAR) traffic data. Rail growth this week was continues to demonstrate an improving economy - even though the rate of growth is slowing.

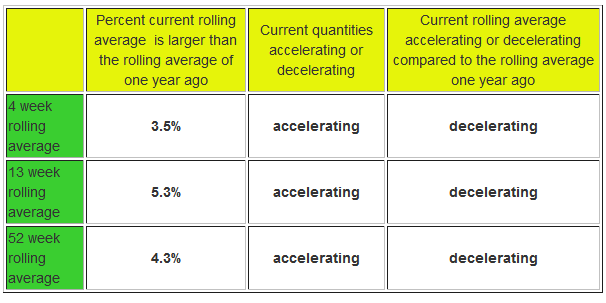
This analysis is looking for clues in the rail data to show the direction of economic activity - and is not necessarily looking for clues of profitability of the railroads. The weekly data is fairly noisy, and the best way to view it is to look at the rolling averages which are continuing to show a strong growth cycle albeit the rate of growth is slowing:
A summary of the data from the AAR:
The Association of American Railroads (AAR) today reported increased U.S. rail traffic for August 2014, with both carload and intermodal volume increasing compared with August 2013. U.S. railroads originated 1,212,287 carloads in August 2014, up 2.9 percent or 33,838 carloads compared with August 2013. Total carloads averaged 303,072 per week in August 2014, which is the highest weekly average for any month since October 2011 and the highest for August since 2008.
U.S. railroads also originated 1,075,688 containers and trailers in August 2014, up 4.3 percent or 44,520 carloads, compared with August 2013.The weekly average of 268,922 intermodal units in August 2014 was the second-highest weekly average ever, slightly behind June 2014. In August 2014, combined U.S. carload and intermodal volume was 2,287,975 units, up 3.5 percent or 78,358 units compared with August 2013. Average weekly volume was 571,994 carloads, containers, and trailers.
“The rail industry has played and is continuing to play a critical role in the U.S. economy’s resurgence. In fact, average weekly U.S. rail volume, in terms of carloads plus intermodal containers and trailers, was higher in August 2014 than in any month since October 2007,” said AAR Senior Vice President John T. Gray. “The broad range of commodities that are seeing higher rail volumes is a welcome sign for the economy.”
USA coal production is down 5.5% same week year-over-year - and coal accounts for well over 1/3rd of carloads.
Here is a look at the weekly data comparing it to the same week one year ago, backing out economically less intuitive coal and grain, and comparing growth year-to-date.
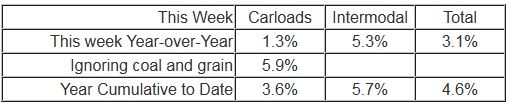
Current Rail Chart

From EIA.gov:
For the week ended August 30, 2014:
- Estimated U.S. coal production totaled approximately 19.2 million short tons (mmst)
- This production estimate is 0.8% lower than last week's estimate and 5.5% lower than the production estimate in the comparable week in 2013
- Coal production east of the Mississippi River totaled 7.8 mmst
- Coal production west of the Mississippi River totaled 11.4 mmst
- U.S. year-to-date coal production totaled 654.1 mmst, 1.1% lower than the comparable year-to-date coal production in 2013


Comments
Log in or sign up to join the conversation.