

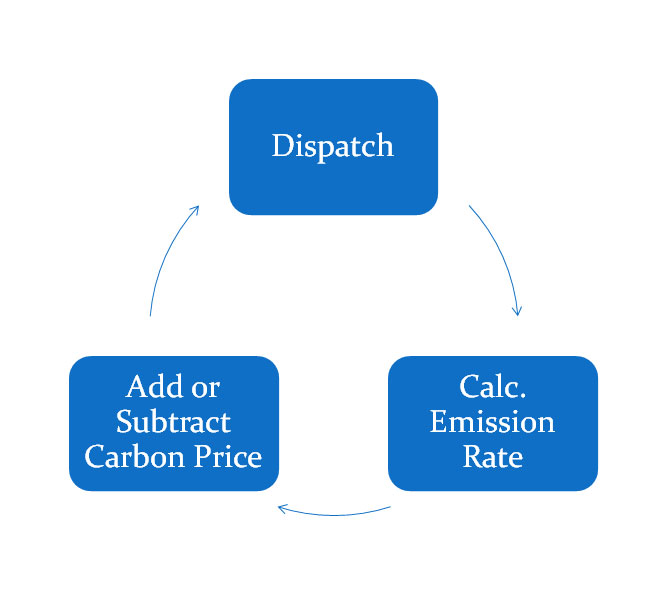
Given our completed summer 2015 analysis and our last power discussions centered in the East, we head West in this example analysis and quantify the risk in Mid-Columbia (Mid-C) power hub on a high level. In order to make an effective decision, one requires knowing more than the fact that higher gas prices, higher load, and lower hydro generation produces higher power prices – but by knowing the extent and the probabilities this leads to effective decision making. Power Market Analysis (PMA) is built to deliver you this knowledge by using AuroraXMP by EPIS and following the fundamentals of power modeling as described in the whitepaper.
Current Mid-C Market
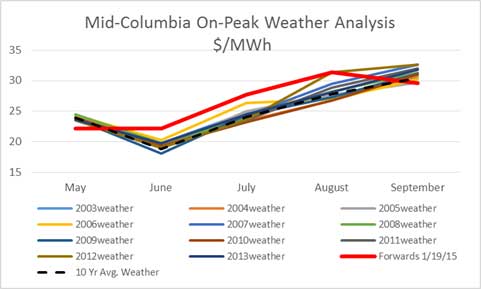
Examining the Mid-C On-Peak power curve, we see some very interesting results. The current forward curve for the summer rises from $22/MWh to $30/MWh by the end of summer. To many, these prices are likely extremely low. However, this is what you get in a hydro based environment with $3/mmbtu gas prices. Based on our preliminary analysis, it would indicate the prices can actually be much lower for many of the summer months. We ran over 60+ simulations for this summer.
Weather Analysis
To understand weather, we ran the last 11 year actual weather patterns and generated a new load forecast under those parameters. The weather changes in the region over the last 11 years are not that impactful in the summer. The largest standard deviation was in August at less than $2/MWh. This makes sense given the temperate summer weather in the Northwest.
Gas Price Analysis
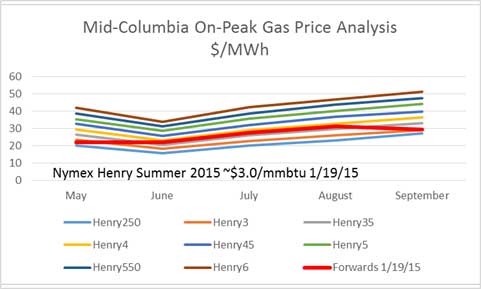
To understand the impact on gas prices, we changed gas prices from $2.5/mmbtu to $6/mmbtu in 10 cent increments. The graph below displays the results in 50 cents increments. Holding all other variables constant, the changing gas price can have a standard deviation impact of around $8/MWh. The graph indicates the futures market is anticipating a higher heat rate than the model or the power trader’s sense higher gas prices by $0.5/mmbtu either through basis or Henry.
Hydro Analysis
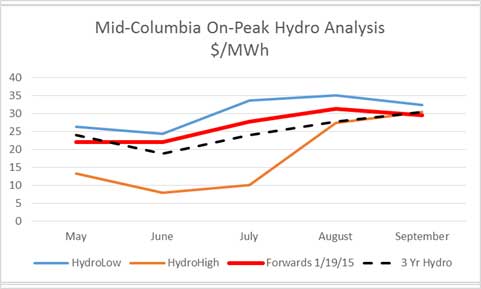
By far, the biggest risk to Mid-C is the hydro conditions. We examined 70 years of hydro conditions and used the 1929 case for the low hydro year and the 1997 case for the high hydro year. The forward curve is likely concerned about a low hydro year given the issues from the past few years. However, the prices can fall significantly if a hydro year similar to 1997 was to occur.

Comments
Log in or sign up to join the conversation.