

The Second Estimate for Q3 GDP, to one decimal, came in at 3.5% (3.51% to two decimal places), a decrease from 4.2% for the Q2 Third Estimate. Investing.com had a consensus of 3.6%.
Here is the slightly abbreviated opening text from the Bureau of Economic Analysis news release:
Real gross domestic product (GDP) increased at an annual rate of 3.5 percent in the third quarter of 2018 (table 1), according to the "second" estimate released by the Bureau of Economic Analysis. In the second quarter, real GDP increased 4.2 percent.
The GDP estimate released today is based on more complete source data than were available for the "advance" estimate issued last month. In the advance estimate, the increase in real GDP was also 3.5 percent. With this second estimate for the third quarter, the general picture of economic growth remains the same; upward revisions to nonresidential fixed investment and private inventory investment were offset by downward revisions to personal consumption expenditures (PCE) and state and local government spending (see "Updates to GDP" on page 2).
The third-quarter percent change in real GDP was unrevised from the advance estimate, reflecting upward revisions to nonresidential fixed investment and private inventory investment that were offset by downward revisions to PCE and state and local government spending. For more information, see the Technical Note. A detailed "Key Source Data and Assumptions" file is also posted for each release. For information on updates to GDP, see the "Additional Information" section that follows. [Full Release]
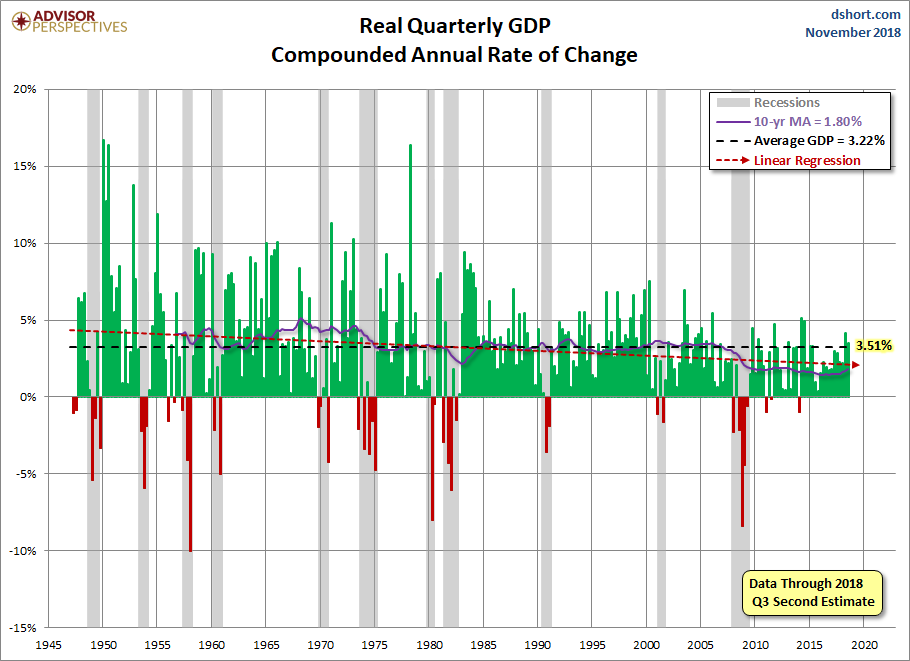
Here is a look at Quarterly GDP since Q2 1947. Prior to 1947, GDP was an annual calculation. To be more precise, the chart shows is the annualized percentage change from the preceding quarter in Real (inflation-adjusted) Gross Domestic Product. We've also included recessions, which are determined by the National Bureau of Economic Research (NBER). Also illustrated are the 3.22% average (arithmetic mean) and the 10-year moving average, currently at 1.80%.
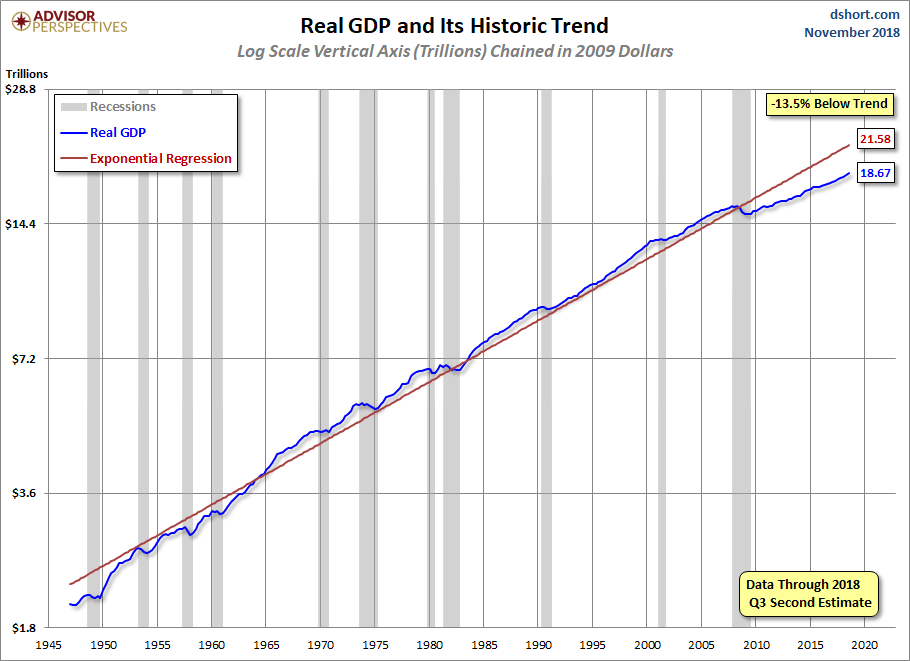
Here is a log-scale chart of real GDP with an exponential regression, which helps us understand growth cycles since the 1947 inception of quarterly GDP. The latest number puts us 13.5% below trend.
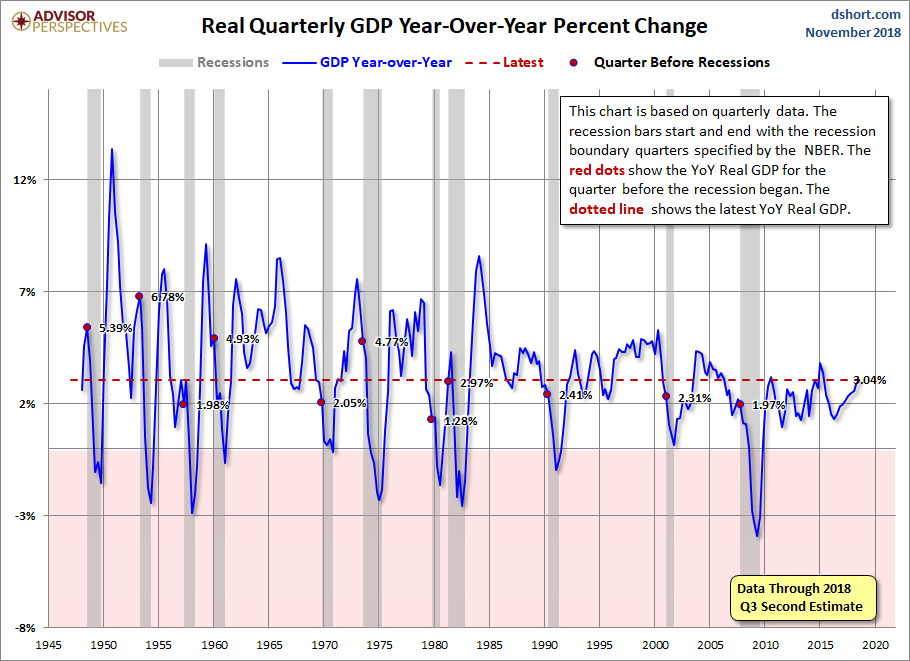
A particularly telling representation of slowing growth in the US economy is the year-over-year rate of change. The average rate at the start of recessions is 3.35%. Six of the eleven recessions over this timeframe have begun at a higher level of current real YoY GDP.
In summary, the Q3 GDP Second Estimate of 3.5% was fractionally worse than expected and worse than the Q2 Third Estimate.



Comments
Log in or sign up to join the conversation.