


Image: Bigstock
The Q3 earnings season has reconfirmed the broad-based strength that we have been seeing in recent reporting cycles. The pace of earnings and revenue growth remains strong and broad-based. Even more notably, the revisions trend remains positive, with estimates for 2026 Q4 and full-year 2027 continuing to rise.
Total Q3 earnings for the 451 S&P 500 members that have reported results are up +24.6% from the same period last year on +13.5% higher revenues, with 82.5% beating EPS estimates and 74.9% beating revenue estimates. The proportion of these 451 index members beating both EPS and revenue estimates (the ‘blended’ beats percentage) is 65.4%.
Excluding the Tech sector’s substantial contribution, Q3 earnings for the rest of the S&P 500 index would be up +19.9% (vs. +28.8% otherwise). Excluding the Energy sector, the aggregate growth rate would decline to +23.2%. Excluding both the Energy and Tech sectors, Q3 earnings for the rest of the index would be up +10.5% on +7.6% higher revenues.
Micron (MU - Free Report) and Nvidia (NVDA - Free Report) continue to be material contributors to the Tech sector’s growth picture. Excluding Nvidia, Micron, and Alphabet (GOOGL - Free Report), which enjoyed an outsized gain in the preceding period, Q3 earnings for the rest of the Tech sector would be up +29.6% (vs. +45.5% otherwise).
The Tech Sector Earnings Scorecard
The Tech sector in general, and the broader AI basket in particular, has been in the eye of the storm in recent weeks, with worries about data center buildout, funding, and permitting in the spotlight. These worries have been weighing on these stocks’ performance lately, as the one-month performance chart below of Micron, Alphabet, and the Zacks Tech sector relative to the S&P 500 index shows.
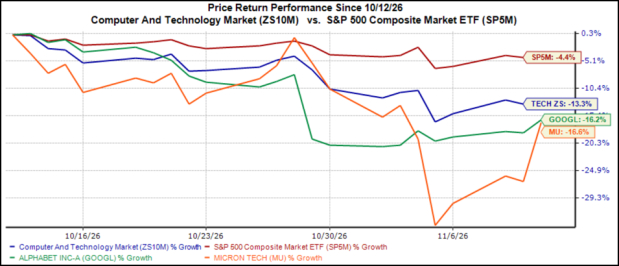
Image Source: Zacks Investment Research
We deliberately used Alphabet and Micron in the chart above as a proxy for the high-quality part of the AI basket. Both companies are particularly relevant from an earnings standpoint, with Micron posting blockbuster results at the start of the Q3 reporting cycle while Alphabet famously failed to impress on that score.
Alphabet is hardly alone in struggling to beat consensus estimates in Q3, as the Tech sector as a whole has been at best average on this score, as the comparison charts below show.
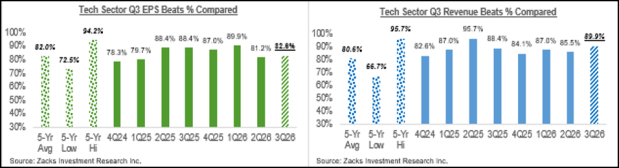
Image Source: Zacks Investment Research
These comparison charts show Q3 EPS and revenue beat percentages for 69 of the 89 S&P 500 companies that have already reported results. As you can see in the left-hand side chart, the Q3 EPS beats percentage for this group is tracking a hair above the average for the preceding 20 quarters for this same group of 69 Tech companies.
We noted earlier how Micron Technology has been a big contributor to the sector’s strong growth this quarter, while Alphabet had joined Micron in the preceding period. Including both of these Tech players, the Tech sector’s Q3 earnings are up +33.1% from the same period last year on +27.2% higher revenues, as the comparison charts below show.
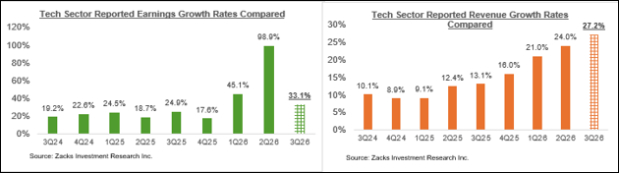
Image Source: Zacks Investment Research
Driving the unusually strong earnings growth number (+98.9%) in 2026 Q2 is because of Alphabet’s booking of a huge gain on its SpaceX (SPCX) stake after that company’s IPO. We typically strip out non-recurring gains and losses from our earnings data, but we decided to keep the Alphabet gain in, as having equity stakes in a variety of companies is actually part of its business, even as the SpaceX-type gain ends up distorting our aggregate data from a comparability standpoint, as is the case here.
The comparison charts below strip out Alphabet and Micron from the earnings and revenue data for the Tech sector for all periods.
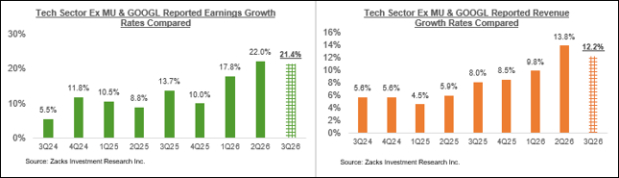
Image Source: Zacks Investment Research
Looking at Q3 as a whole, combining the actual results that have come out with estimates for the still-to-come Tech companies, total earnings are on track to increase by +45.5% from the same period last year on +34.7% higher revenues.
The sector’s Q3 earnings growth pace drops to +29.6% from +45.5% once contributions from Micron, Alphabet, and Nvidia are excluded, as the chart below shows.
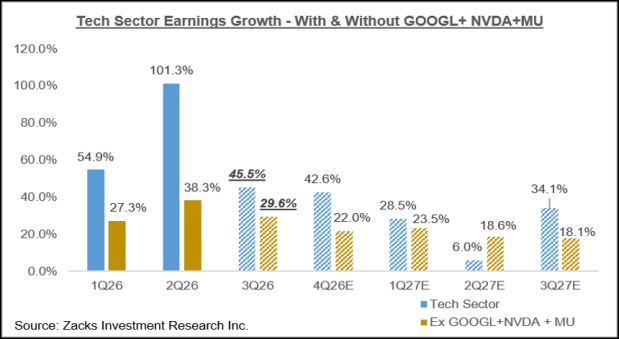
Image Source: Zacks Investment Research
The Earnings Big Picture
The chart below shows S&P 500 expectations for 2026 Q3, comparing what was achieved in the preceding four periods with what is currently expected for the following three quarters.
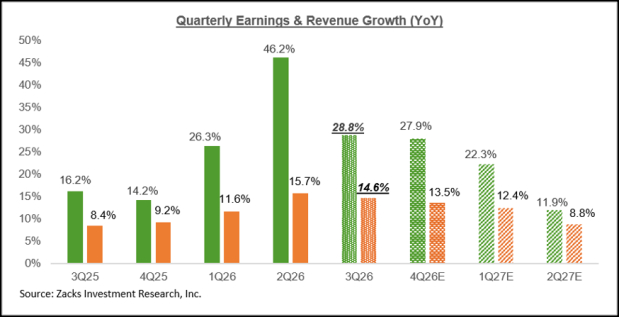
Image Source: Zacks Investment Research
We have shown how Q3 estimates have moved higher since the quarter got underway. Below, we show how estimates for the last quarter of the year have evolved in recent weeks.
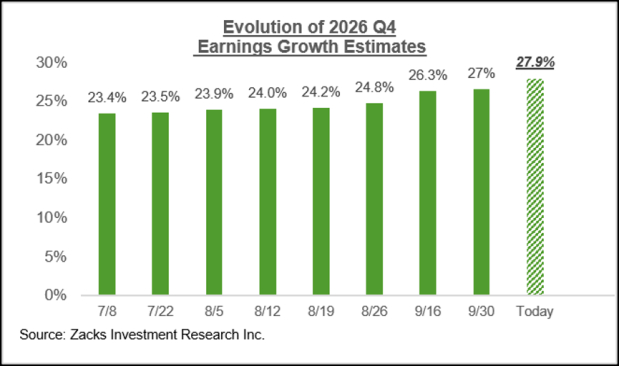
Image Source: Zacks Investment Research
The chart below shows the overall earnings picture for the S&P 500 index on an annual basis.
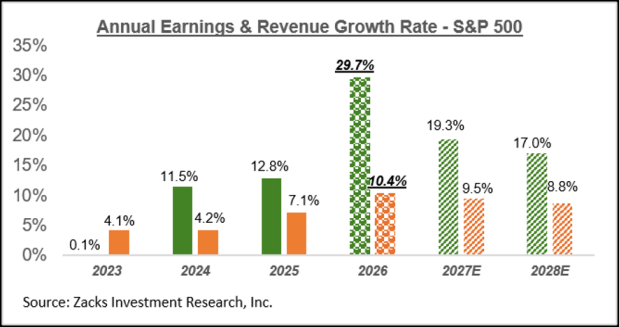
Image Source: Zacks Investment Research
As is the case with estimates for 2026 Q4, estimates for full-year 2027 are also moving higher, as the chart below shows.
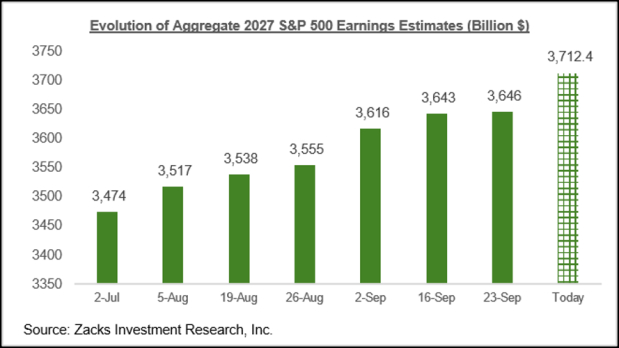
Image Source: Zacks Investment Research
Since the beginning of July, estimates for 2027 have increased for 10 of the 16 Zacks sectors, with Tech, Energy, Finance and Industrials leading the way.
With 90.2% of the S&P 500 results already in, the revisions trend has remained consistently positive. We will keep a close watch on this key metric through the remainder of this reporting cycle.



Comments
Log in or sign up to join the conversation.