

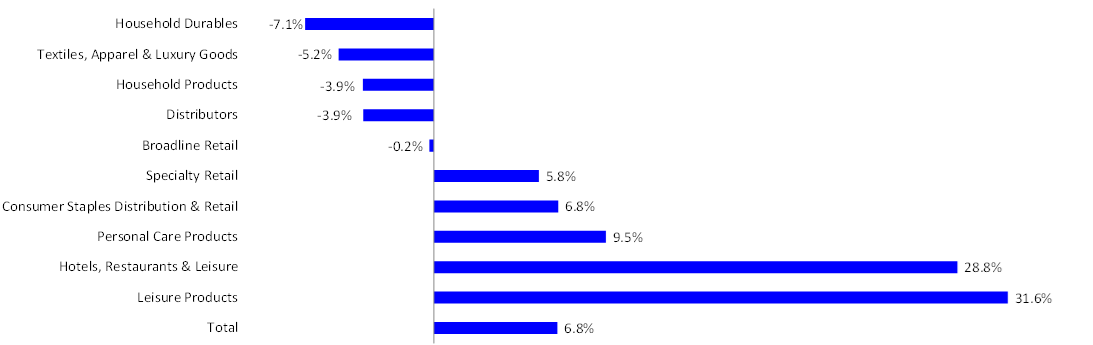
The LSEG U.S. Retail and Restaurant Q3 earnings index, which tracks changes in the growth rate of earnings within the sector, is expected to post a 6.8% growth over last year’s levels. Our metrics show that five of 10 consumer-related industries have turned negative (Exhibit 1).
Of the 184 retailers tracked by LSEG, the Leisure Products sector is headed for the highest earnings growth rate in the third quarter, recording a 31.6% surge over last year’s level. The second-strongest sector is Hotels, Restaurant & Leisure with a 28.8% growth estimate.
At the other end of the spectrum, Household Durables has the weakest anticipated Q3 2026 estimate, with profits expected to decline by 7.1% (Exhibit 1).
Exhibit 1: The LSEG Retail Earnings Growth Rate – Q3 2026
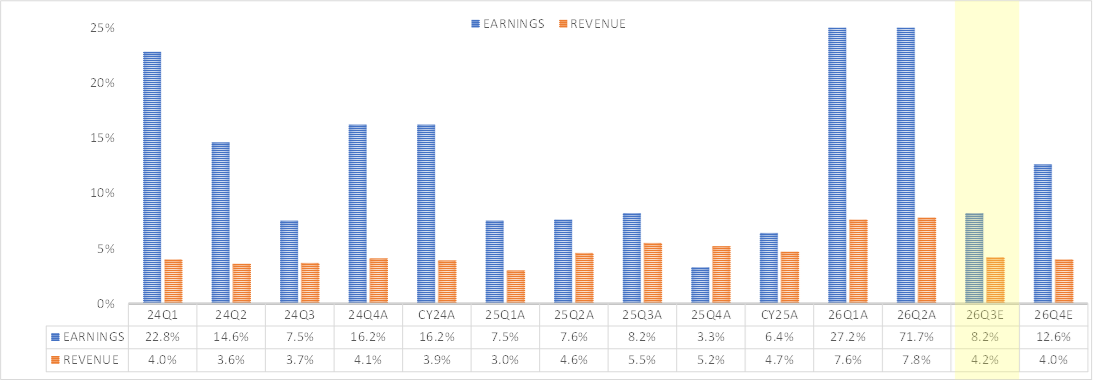
Retail earnings remained robust in the second quarter of 2026, supported by resilient consumer spending and elevated promotional activity. However, recent earnings reports point to moderating spending momentum and an increasingly pronounced divide across income cohorts. Against this backdrop, the LSEG U.S. Retail and Restaurant Index posted an impressive 71.7% earnings growth rate in Q2.
Looking ahead, momentum is expected to normalize significantly. The LSEG U.S. Retail and Restaurant Index is currently on track to post Q3 earnings growth of 6.8%, a sharp deceleration from Q2’s 71.7% increase. A similar slowdown is expected on the top line, with revenue growth projected to cool from a robust 7.8% in Q2 to 3.6% in Q3 (Exhibit 2). The third quarter typically represents a transitional period for consumer spending, following summer travel and back-to-school activity but preceding the critical holiday shopping season. Still, the expected slowdown suggests retailers will enter the holidays facing a more selective consumer who is increasingly focused on value and discretionary spending choices.
Exhibit 2: LSEG Earnings Dashboard
This week in retail
Costco (COST) is on track to report fiscal Q4 2026 earnings after the market closes today, with expectations pointing to another strong quarter. Analysts polled by LSEG currently expect earnings and revenue to increase 11.2% and 10.1%, respectively, while membership fee revenue is projected to rise 6.1%.
Same-store sales (SSS) are expected to increase by 8.1%, above the 5%–7% range that has largely prevailed over the past four years. Comparable sales across Costco’s U.S. and international businesses are also expected to rise by at least 5.1%, comfortably above the 3% threshold typically associated with healthy retail growth. The strength underscores Costco’s ability to drive traffic and maintain customer loyalty through its value proposition.
Digital remains another bright spot. Costco has expanded its same-day delivery partnerships with Uber (UBER) and DoorDash (DASH), with Uber delivery now reaching 47 states and DoorDash available across all U.S. Costco locations. Against this backdrop, digital SSS are expected to rise by 19.8%, highlighting continued consumer demand for convenience.
While sales and comps are expected to remain strong, Wall Street will also be focused on membership growth, renewal rates and margins. These measures will provide further insight into whether Costco’s strong traffic and value proposition are translating into equally robust earnings growth.
Nike (NKE) is scheduled to report fiscal Q1 2027 earnings next week, with expectations pointing to a considerably more challenging quarter. Analysts polled by LSEG currently expect earnings to decline by 10.6%, accompanied by a 3.3% decline in revenue.
The sportswear giant continues to navigate softer demand, heightened competition and a more promotional retail environment. Investors will be looking for evidence that Nike’s efforts to refresh its product pipeline, strengthen wholesale relationships and reignite consumer demand are beginning to gain traction.
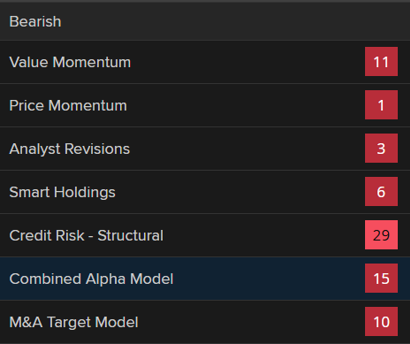
StarMine signals also point to a challenging backdrop heading into the results. Nike has a Price Momentum (PriceMo) score of 1 out of 100, placing it at the bottom of the model’s rankings and reflecting particularly weak share-price momentum (Exhibit 3). Its Smart Holdings score of 6 also signals weak institutional investor positioning based on the factors historically favored by sophisticated investors.
Meanwhile, Nike’s StarMine Analyst Revisions Model (ARM) score stands at just 3 out of 100, reflecting negative revisions to sell-side analyst estimates. Taken together, the PriceMo, Smart Holdings and ARM readings indicate weak price momentum alongside cautious buy-side positioning and deteriorating sell-side sentiment ahead of the earnings release.
The contrast between Costco and Nike highlights a broader theme this earnings season. Costco continues to benefit from a compelling value proposition, strong customer loyalty and investments in convenience, while Nike is navigating softer demand, greater competition and pressure to reinvigorate its product offering.
Exhibit 3: Nike StarMine Model Scores



Comments
Log in or sign up to join the conversation.