

The U.S. consumer remains resilient enough to support earnings growth, but that resilience is increasingly concentrated. Strong profit growth is being driven by a handful of large, high-margin retailers, while guidance across the broader sector points to a more cautious outlook for discretionary spending in the second half of the year.
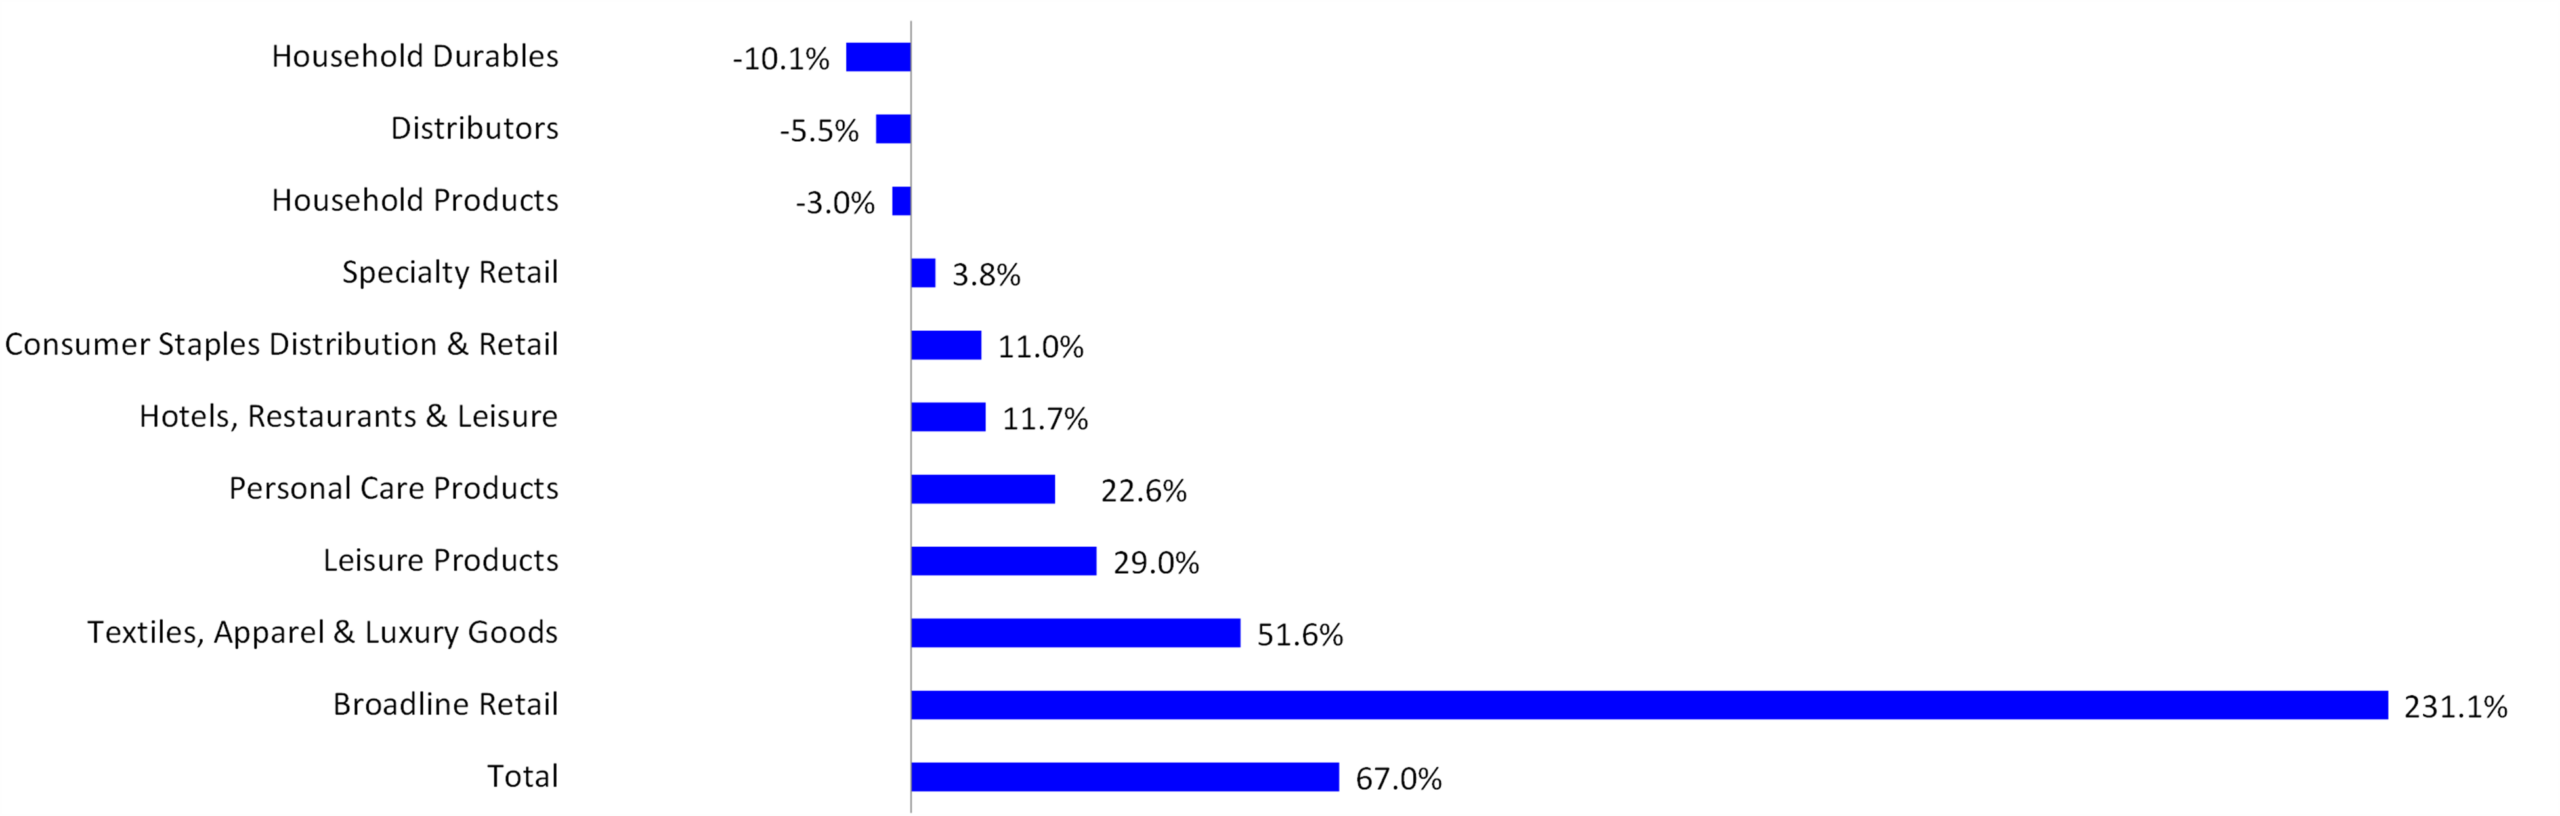
The LSEG U.S. Retail and Restaurant Q2 earnings index, which tracks changes in the growth rate of earnings within the sector, is expected to show a 67.0% growth over last year’s levels. Our metrics show that only three of 10 consumer-related industries have turned negative (Exhibit 1).
Of the 185 retailers tracked by LSEG, the Broadline Retail sector, representing a wide variety of consumer goods, is headed for the highest earnings growth rate in the second quarter, recording a 231.1% surge over last year’s level. The second-strongest sector is Textiles, Apparel & Luxury Goods followed by the Leisure Products with a 51.6% and 29.0% growth estimates, respectively.
At the other end of the spectrum, Household Durables has the weakest anticipated Q2 2026 estimate, with profits expected to decline by -10.1% (Exhibit 1). To date, 142 of the 185 companies in our Retail/Restaurant Index have reported their EPS results for Q2 2026, representing 77% of the index.
Exhibit 1: The LSEG Retail Earnings Growth Rate – Q2 2026
Source: LSEG I/B/E/S
The strongest sector is the Broadline Retail group. Of the six companies in this group, four are on track to post positive estimated earnings growth for Q2. Etsy (ETSY) and Amazon (AMZN) reported the strongest earnings growth rates of 292.0%, and 33.3%, respectively. Similarly, Olie’s Bargain Outlet (OLLI) is on track to report robust earnings growth rates of 14.5%.
The second strongest sector is Textiles, Apparel & Luxury Goods. Within this group, Nike (NKE) posted the strongest earnings growth, at 414.3%. However, performance across the sector has been mixed: of the 17 companies in the group, five are on track to report negative earnings growth for Q2. PVH (PVH) is expected to deliver a robust 22.1% earnings growth rate, while Lululemon (LULU) is projected to post weak results, with earnings expected to decline 42.0% year over year.
Meanwhile, the Household Durables group is on track to post the weakest year-over-year earnings comparisons. Negative growth expectations are directly responsible for the forecast decline in the overall earnings growth rate within the group. Fifteen out of 24 companies struggled to match year-ago earnings growth levels. Whirlpool Corp. (WHR) already reported a 115.7% decline in earnings, while Toll Brothers (TOL) is on track to report 21.4% decline in earnings growth in the second quarter of 2026.
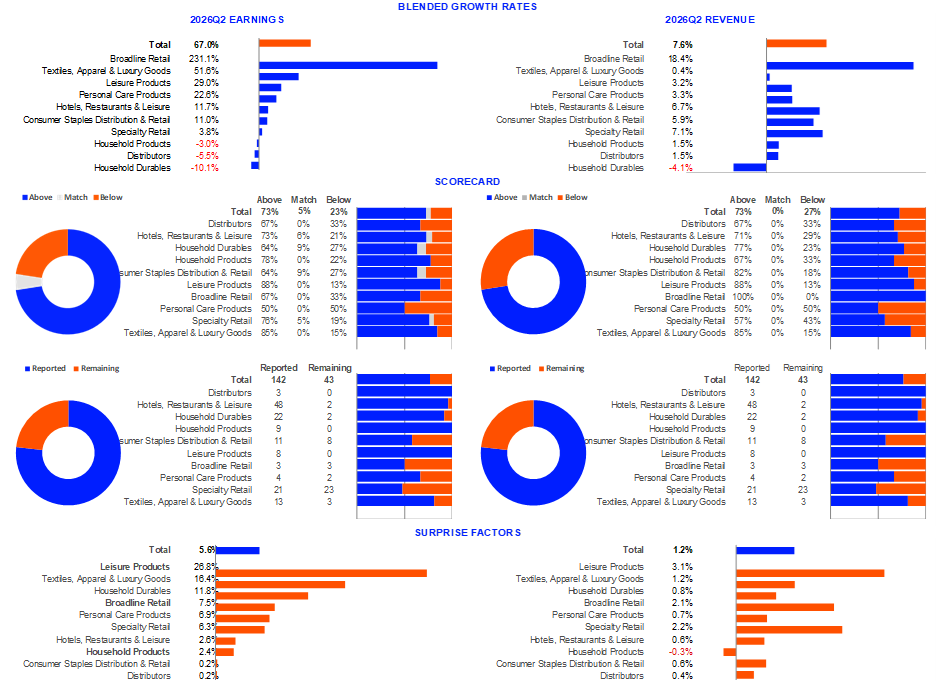
So far, 142 companies, representing 76.8% of those in our Retail/Restaurant Index, have reported Q2 2026 earnings. Of these, 73% exceeded analysts’ expectations, 5% met expectations, and the remaining 22% fell short of consensus estimates (Exhibit 2). The blended earnings growth rate for Q2 2026 currently stands at 67.0%. However, Amazon’s substantial weighting in the index significantly skews the overall result. Excluding Amazon, the blended earnings growth rate declines sharply from 67.0% to 7.1%.
To date, 142 companies in the Retail/Restaurant Index have reported Q2 2026 revenue. For this group, the blended revenue growth rate stands at 7.6%, in line with Q1 2026 and above the long-term average of 5.9%. Of the companies that have reported so far, 73% exceeded analysts’ revenue expectations, while the remaining 27% fell short of consensus estimates.
Exhibit 2: LSEG Earnings Dashboard
Source: LSEG I/B/E/S
Guidance
To date, 142 retailers have reported Q2 2026 earnings, with many citing elevated prices, persistent macroeconomic challenges and a more cautious consumer as key headwinds. Additionally, nearly half of these companies flagged growing pressure from tariffs and higher gas prices, both of which are squeezing consumers and supply chains simultaneously.
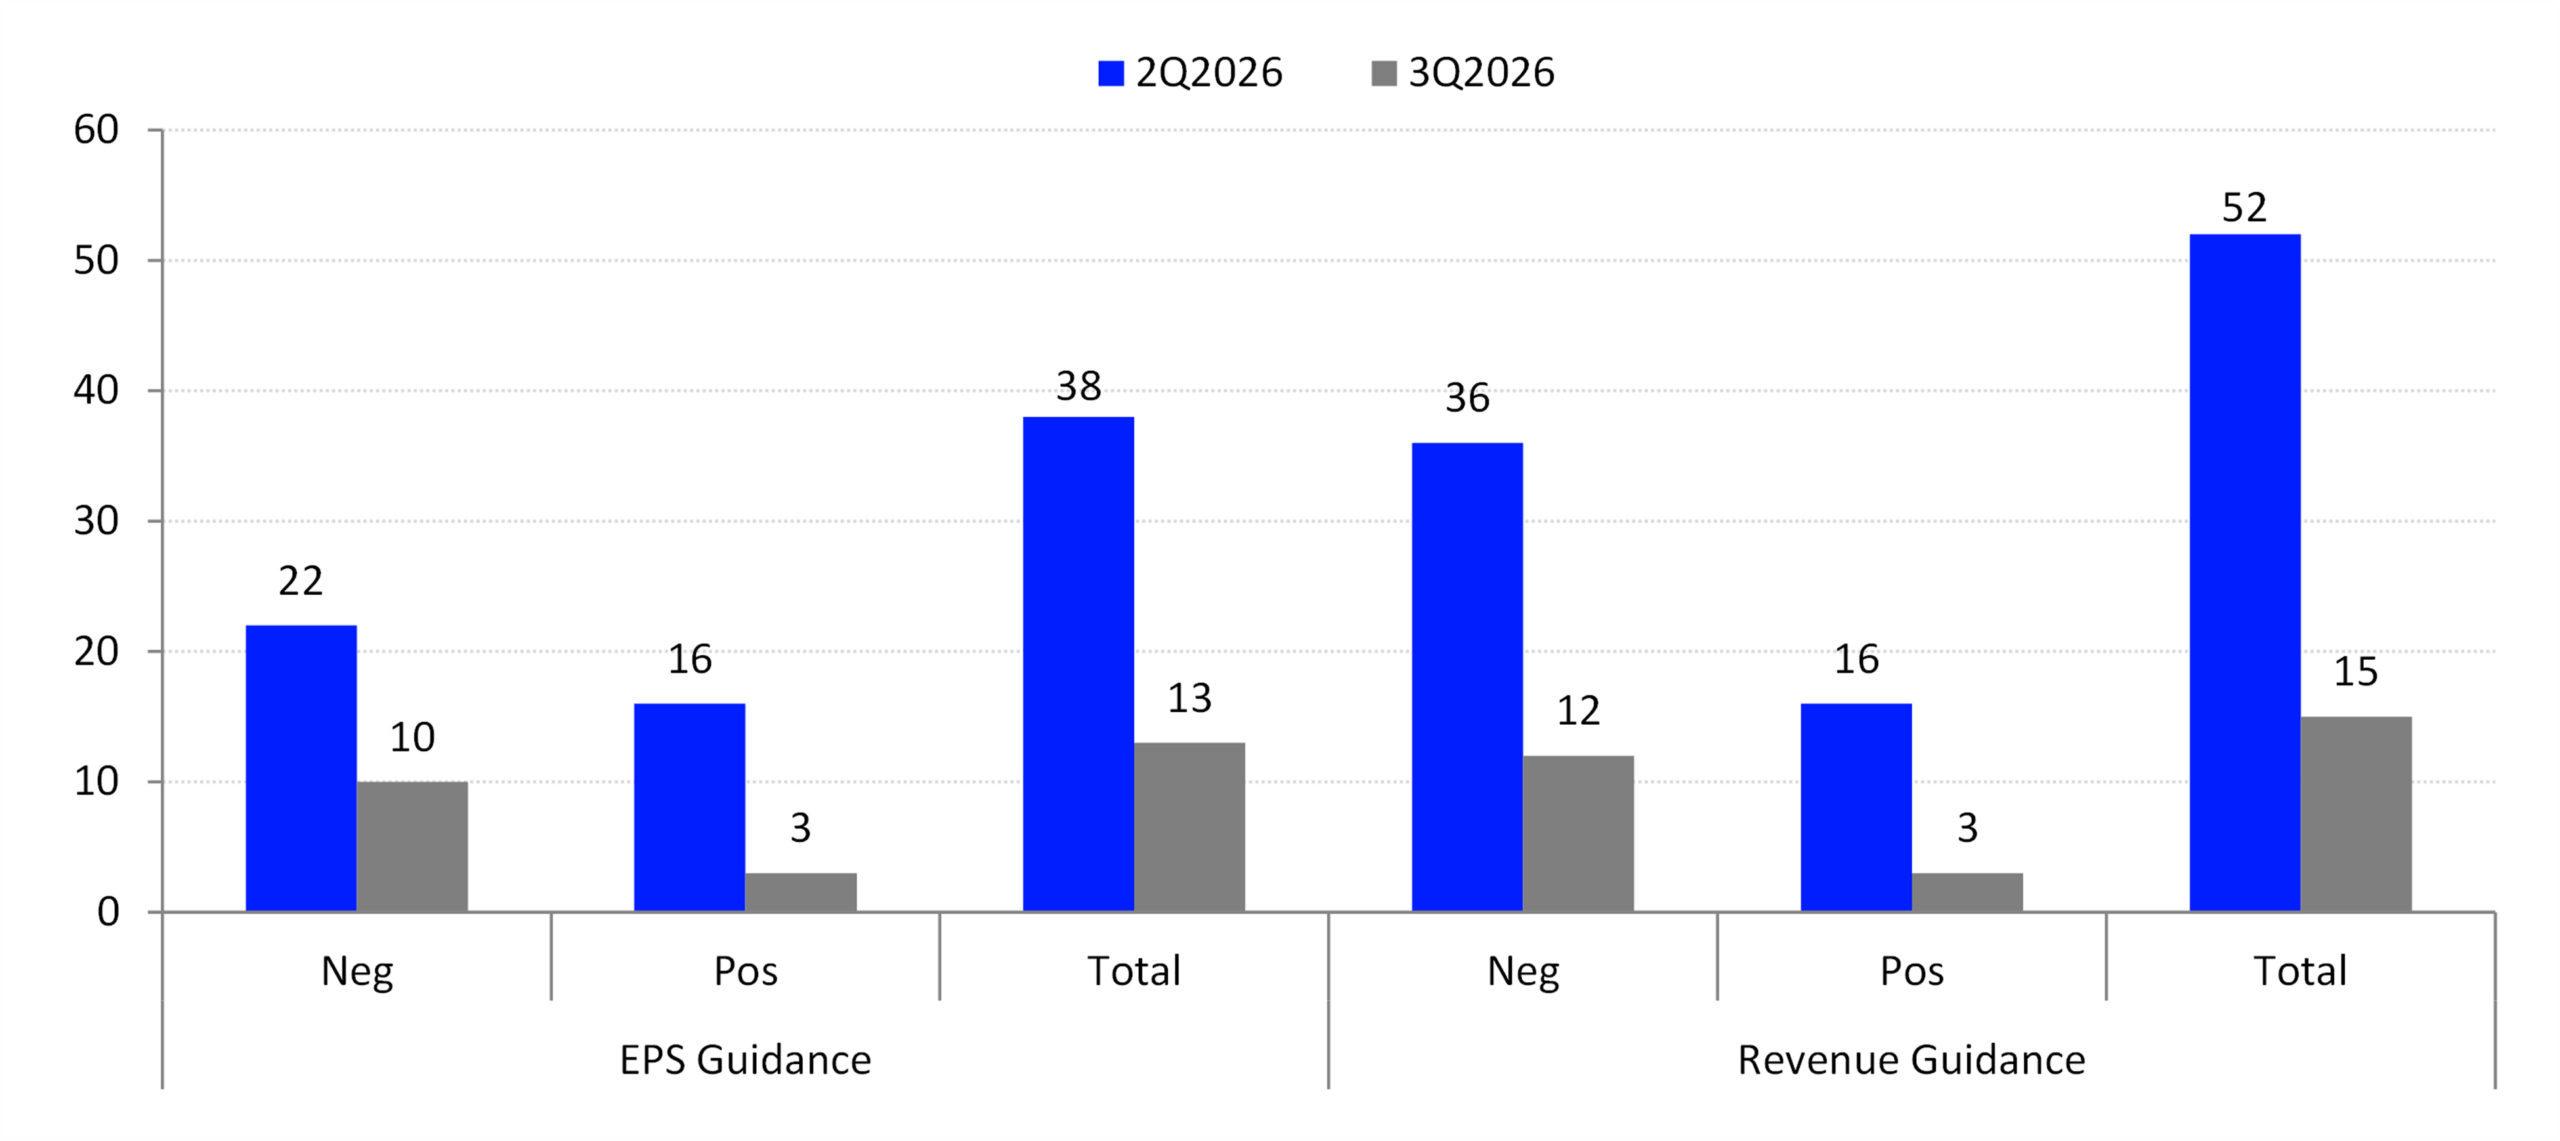
The bulk of retailers still have to report Q2 2026 results. Going into the quarter, there are more negative guidance than positive; 22 retailers issued negative preannouncements, while 16 issued positive EPS guidance for Q2 2026 so far (Exhibit 3). Of those retailers offering revenue guidance, 36 warned of disappointing results, while 16 said revenue might be better than previously expected in Q2 2026.
Looking forward to Q3 2026; 10 retailers issued negative earnings preannouncements, while only three issued positive EPS guidance for Q3 2026. Of those retailers offering revenue guidance, twelve warned of disappointing results, while three said revenue might be better than previously expected in Q3 2026.
Exhibit 3: Earnings and Revenue Guidance: Q2 2026 – Q3 2026
Source: LSEG I/B/E/S
Retail sales
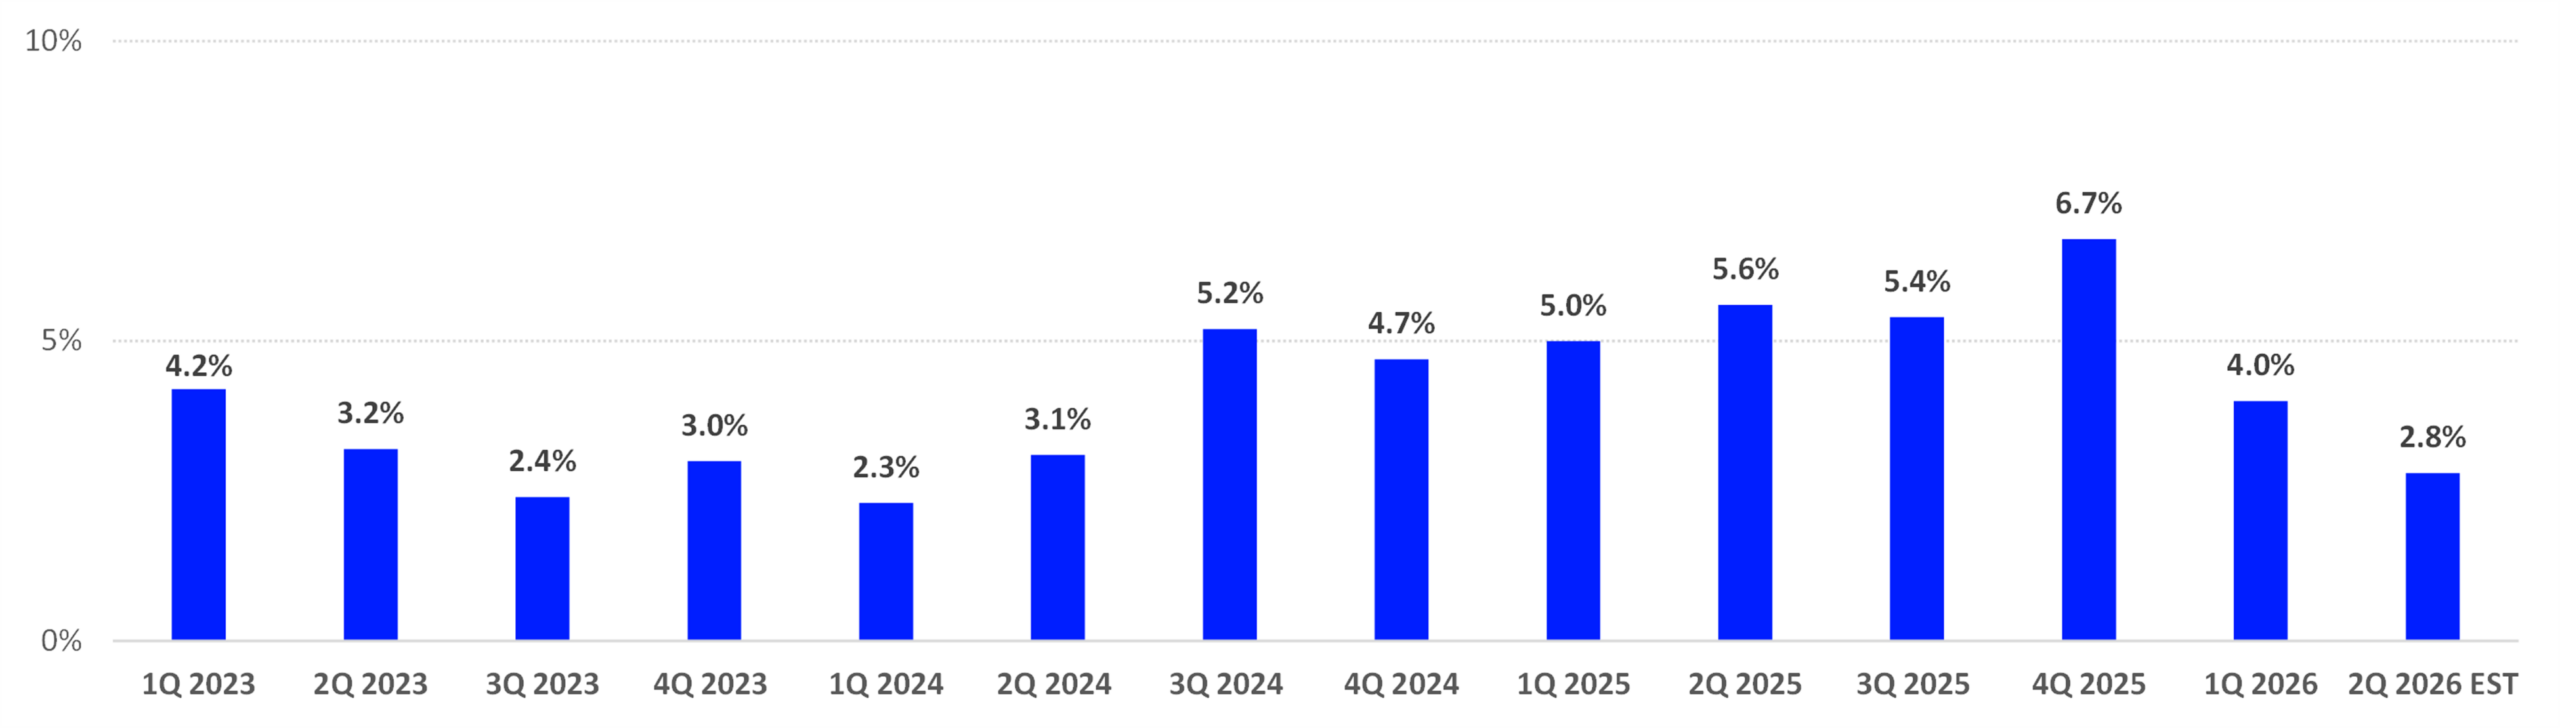
The LSEG Same Store Sales (SSS) index is expected to see a robust 2.8% gain in Q2 2026 (Exhibit 4). An increase of 3.0% in SSS signals that consumer spending is healthy. Looking back one year, Q2 2025 SSS notched a gain of 5.6%, showing that retailers are facing difficult comparisons from a year ago.
Exhibit 4: LSEG Same Store Sales Index: 2023 – Present
Source: LSEG I/B/E/S
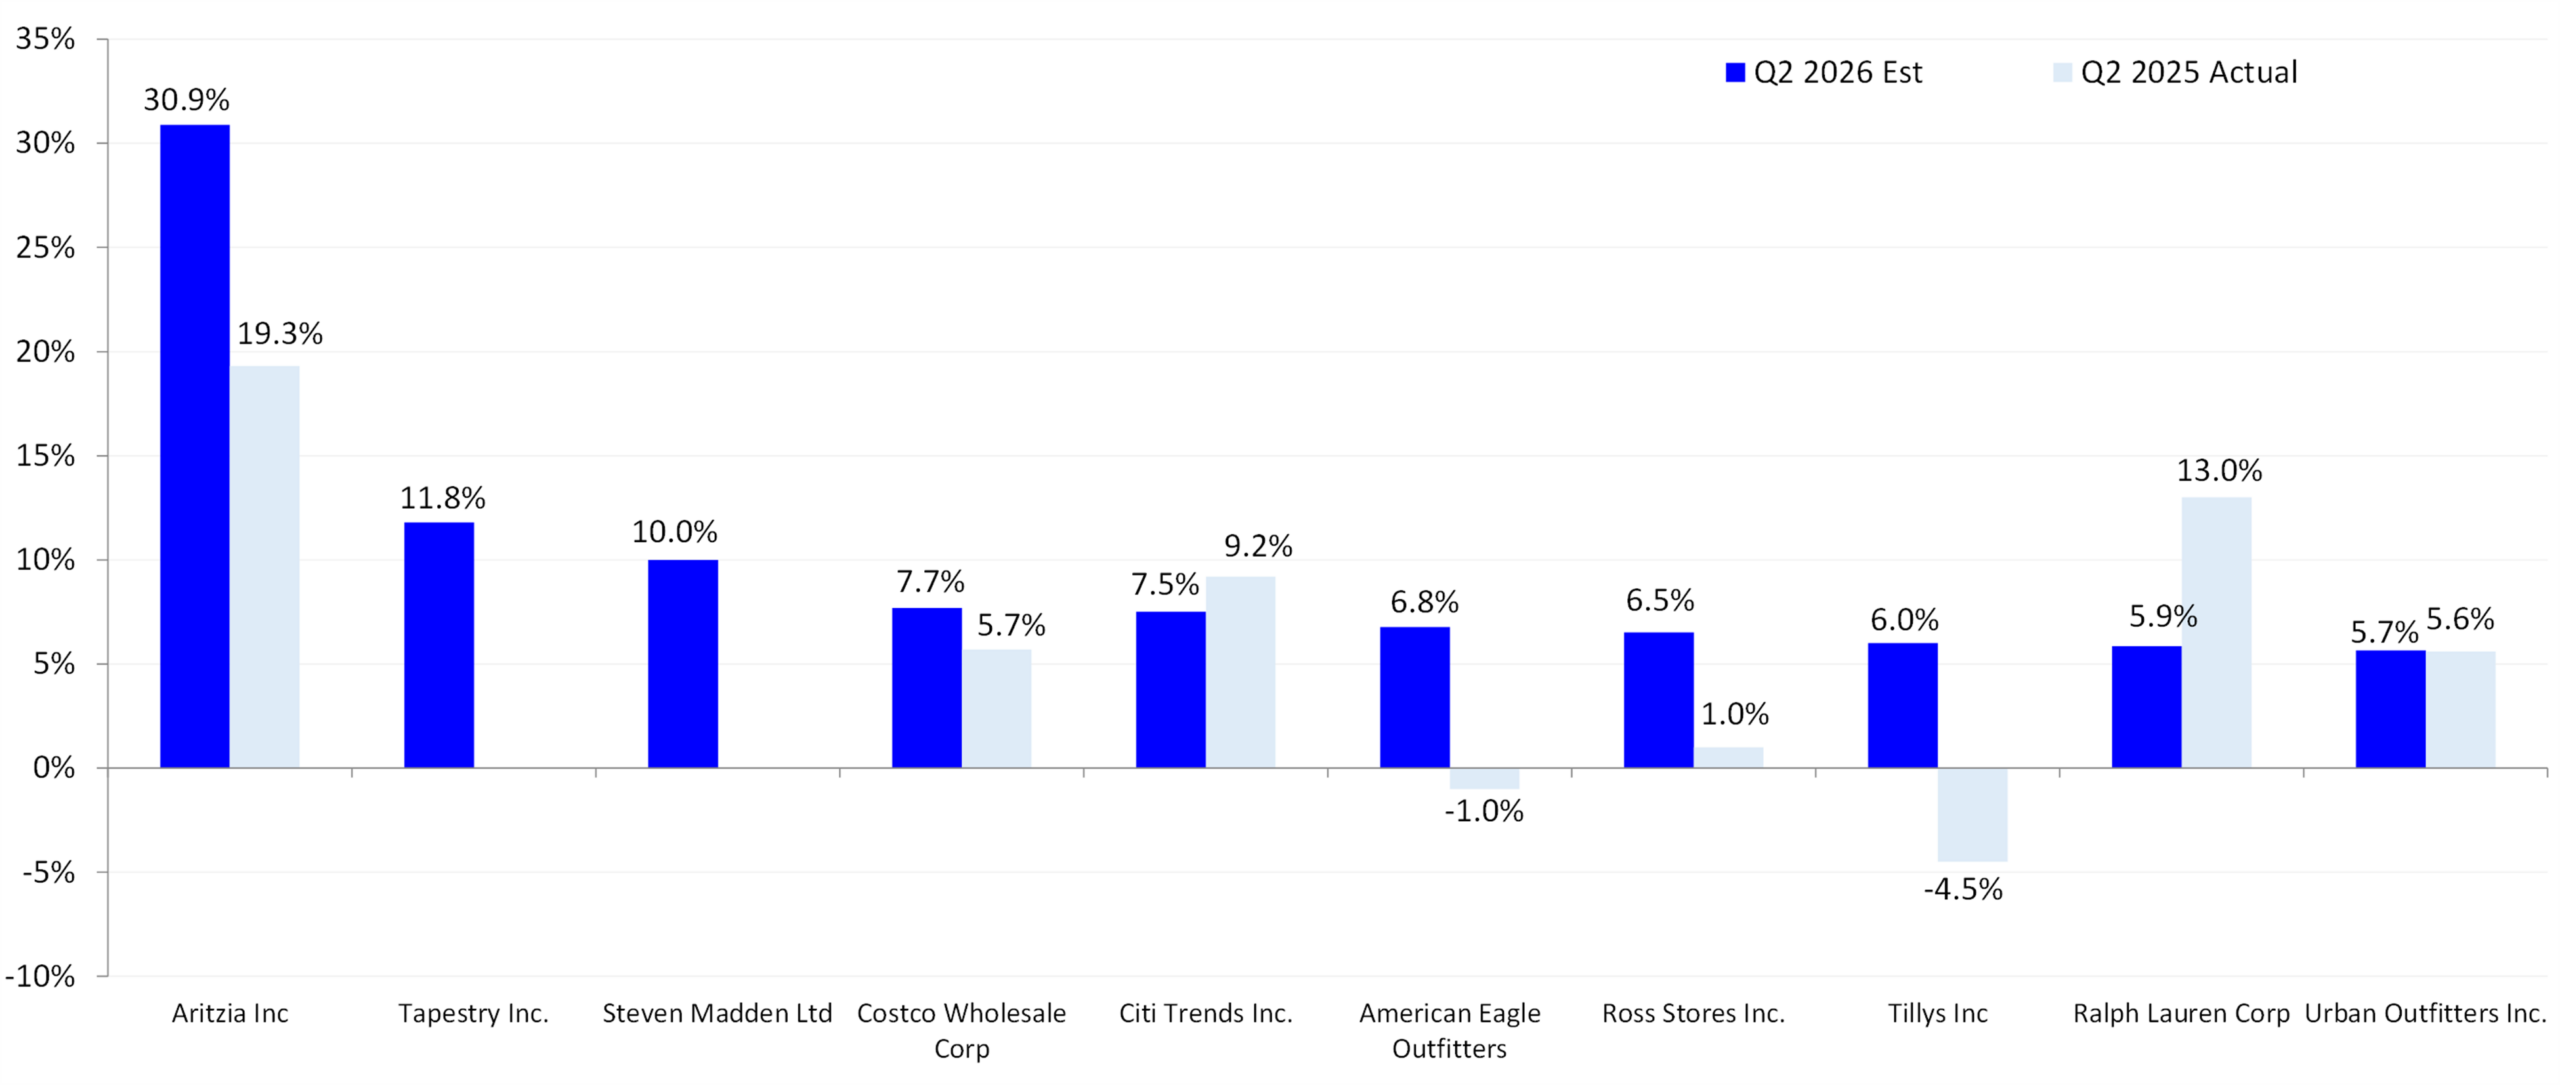
When it comes to apparel, retailers that offer shoppers a steady stream of novelty tend to cultivate strong customer loyalty. Aritzia (ATZAF) in particular, is facing the most difficult comparison from a year-ago of 19.3% and is on track to delivered the strongest same-store sales (SSS) result of the quarter at 30.9%. Notably, nine of the top ten SSS performers this quarter are in the apparel category just in time for back-to-school. As a result, American Eagle (AEO) and Urban Outfitters (URBN) are expected to post SSS growth of 6.8% and 5.7%, respectively. Likewise, Ross Stores (ROST) and Citi Trends (CTRN) are driving a projected 6.5% and 7.5% gains, respectively.
At the same time, consumers continue to feel the pressure of elevated food prices, sustaining demand for discount retailers. These value-driven stores remain resilient, holding steady business volumes despite challenging year-over-year comparisons. Walmart (WMT), known for its strong value proposition and loyal customer base, is expected to post a 3.8% SSS increase. Meanwhile, Costco (COST) is on track to report a robust 7.7% gain, despite facing tough comparisons from a year ago.
Exhibit 5: Strongest Same Store Sales Estimates: Q2 2026 Estimate vs. Q2 2025 Actual
Source: LSEG I/B/E/S
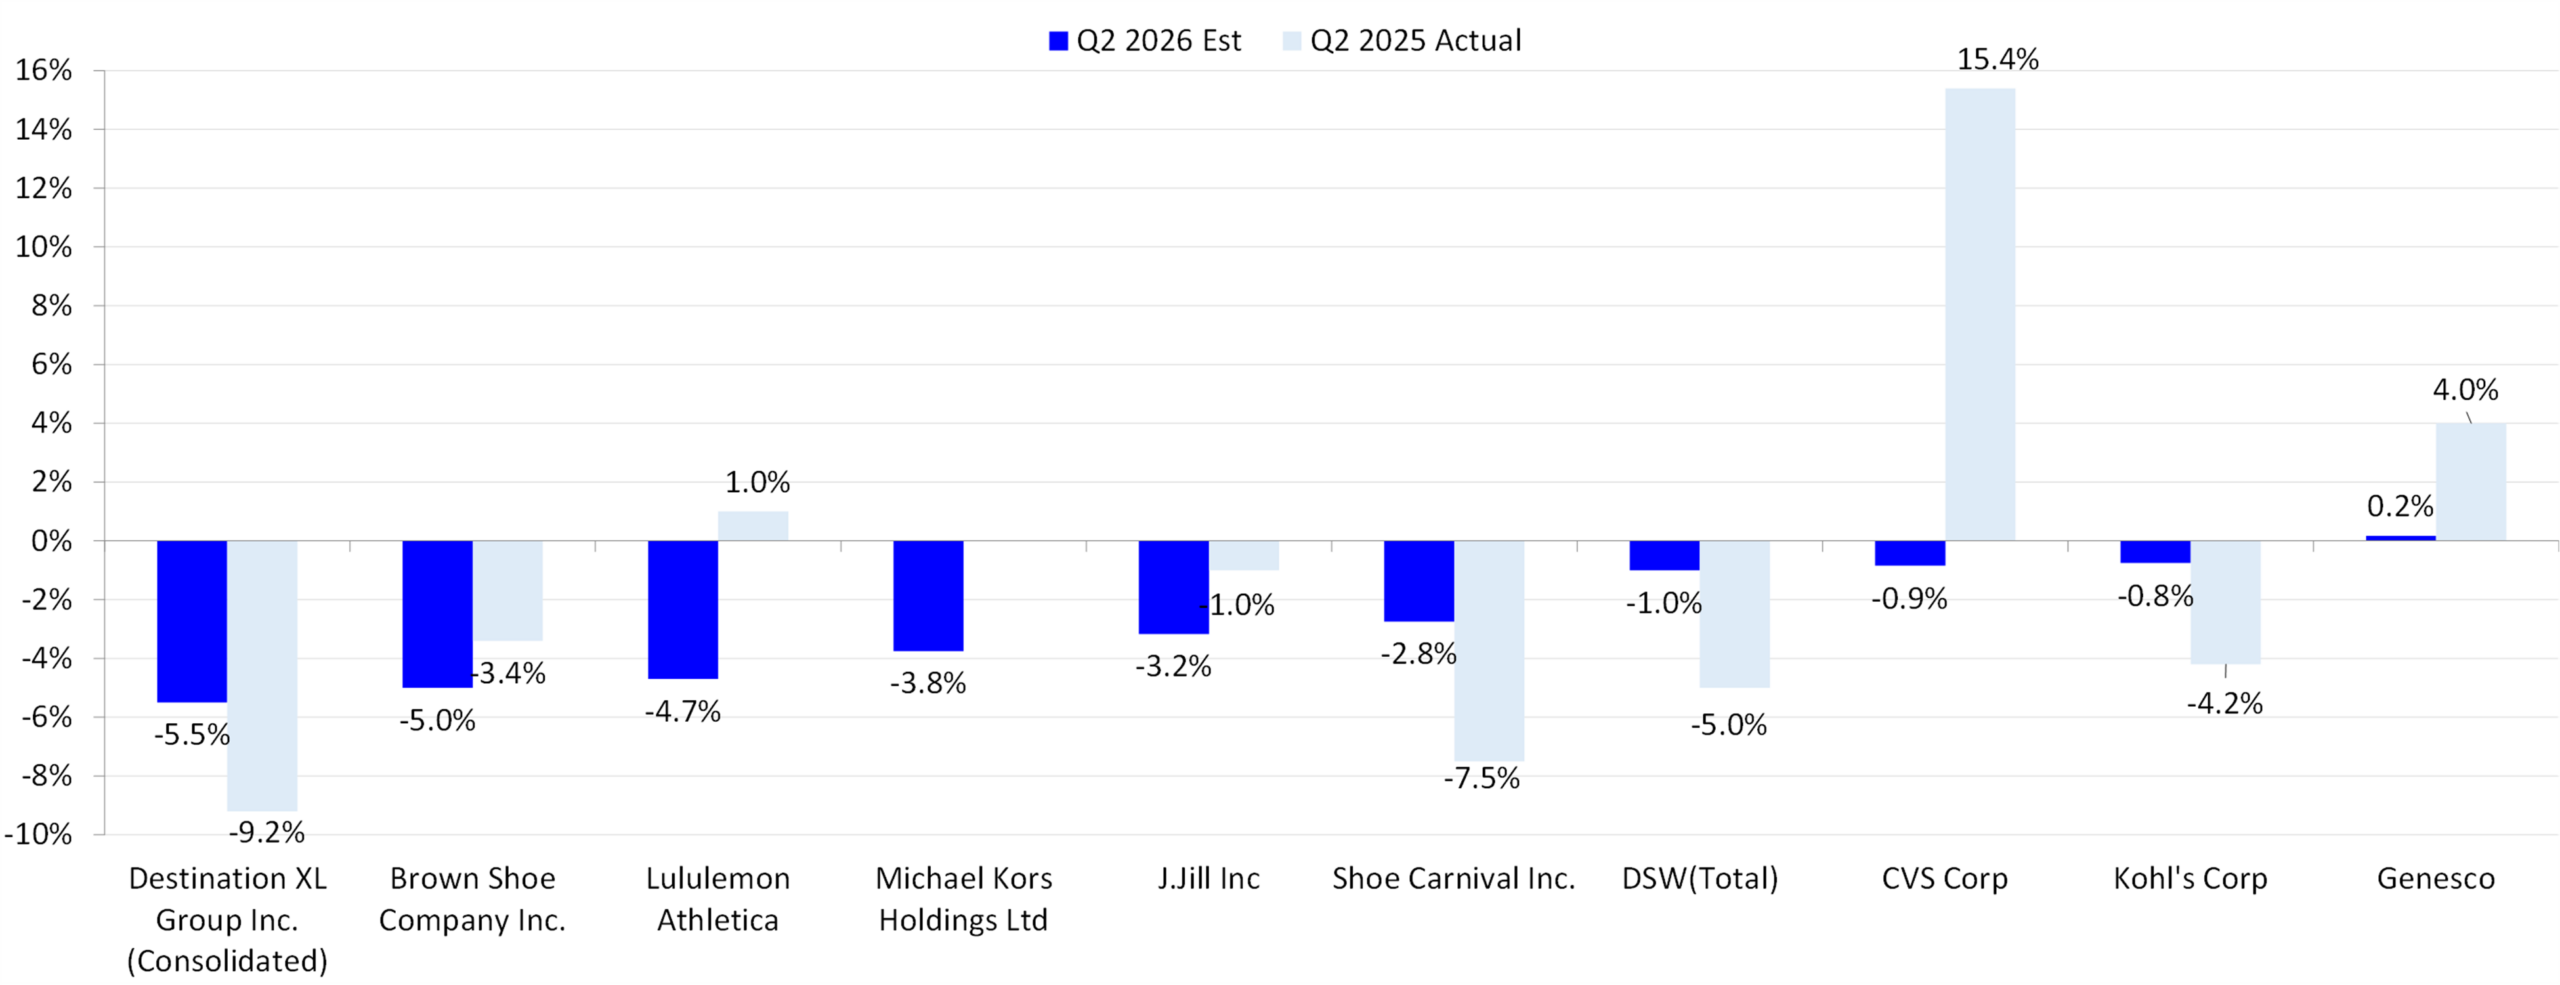
On the other hand, mall-based and big-box department stores continue to fall out of favor with consumers. Kohl’s (KSS) is projected to report weak Q2 2026 same-store sales (SSS) decline of -0.8% (see Exhibit 6). Other underperformers such as J. Jill (JILL), Shoe Carnival (SCVL), and Destination XL Group (DXLG) remain in the bottom tier as they grapple with ongoing company-specific challenges.
Exhibit 6: Weakest Same Store Sales Estimates: Q2 2026 Estimate vs. Q2 2025 Actual
Source: LSEG I/B/E/S
Restaurant Same Store Sales
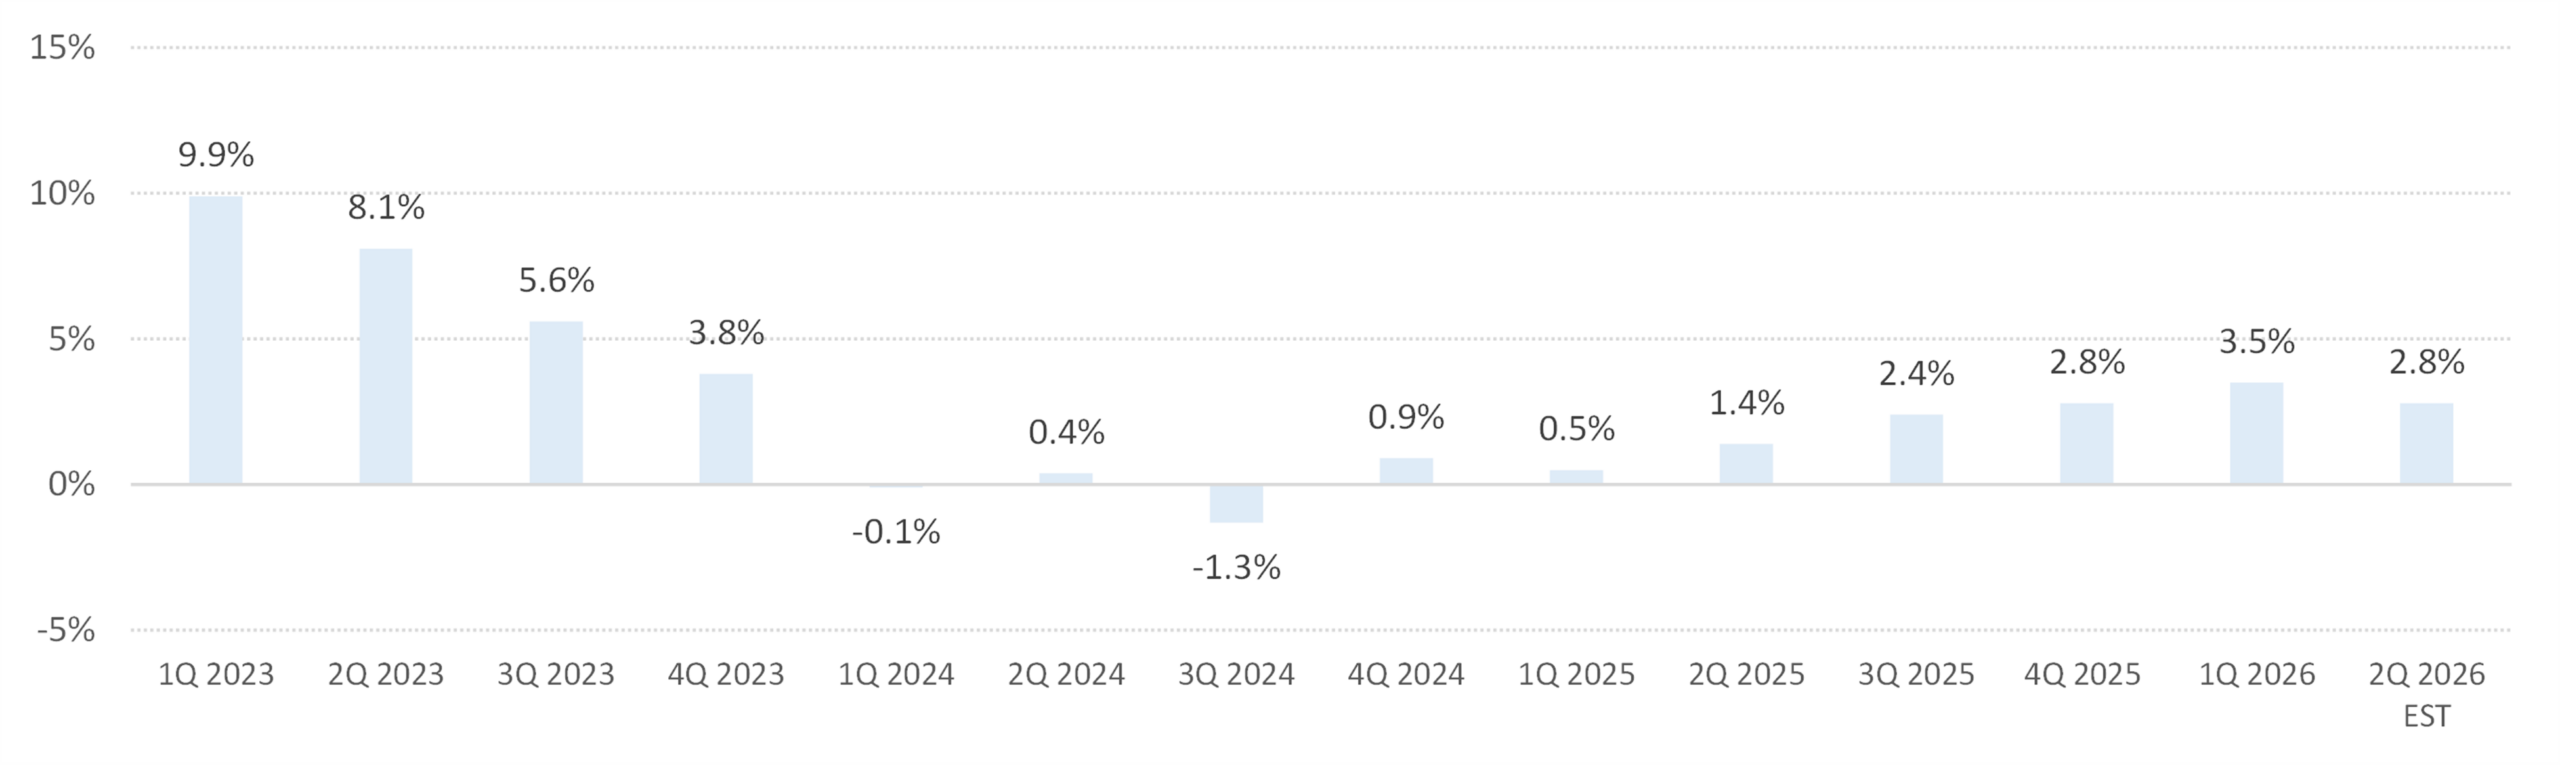
The LSEG Restaurant Same Store Sales (SSS) index is expected to see a 2.8% growth in SSS in Q2 2026, on top of facing last year’s comparison of 1.4%. (Exhibit 7).
Within this industry, the Quick Service sector is on top with a 3.0% SSS estimate, stronger than the Casual Dining sector. The Casual Dining sector is on track to see a 2.5% SSS.
Exhibit 7: LSEG Restaurant Same Store Sales Index: 2023 – Present
Source: LSEG I/B/E/S
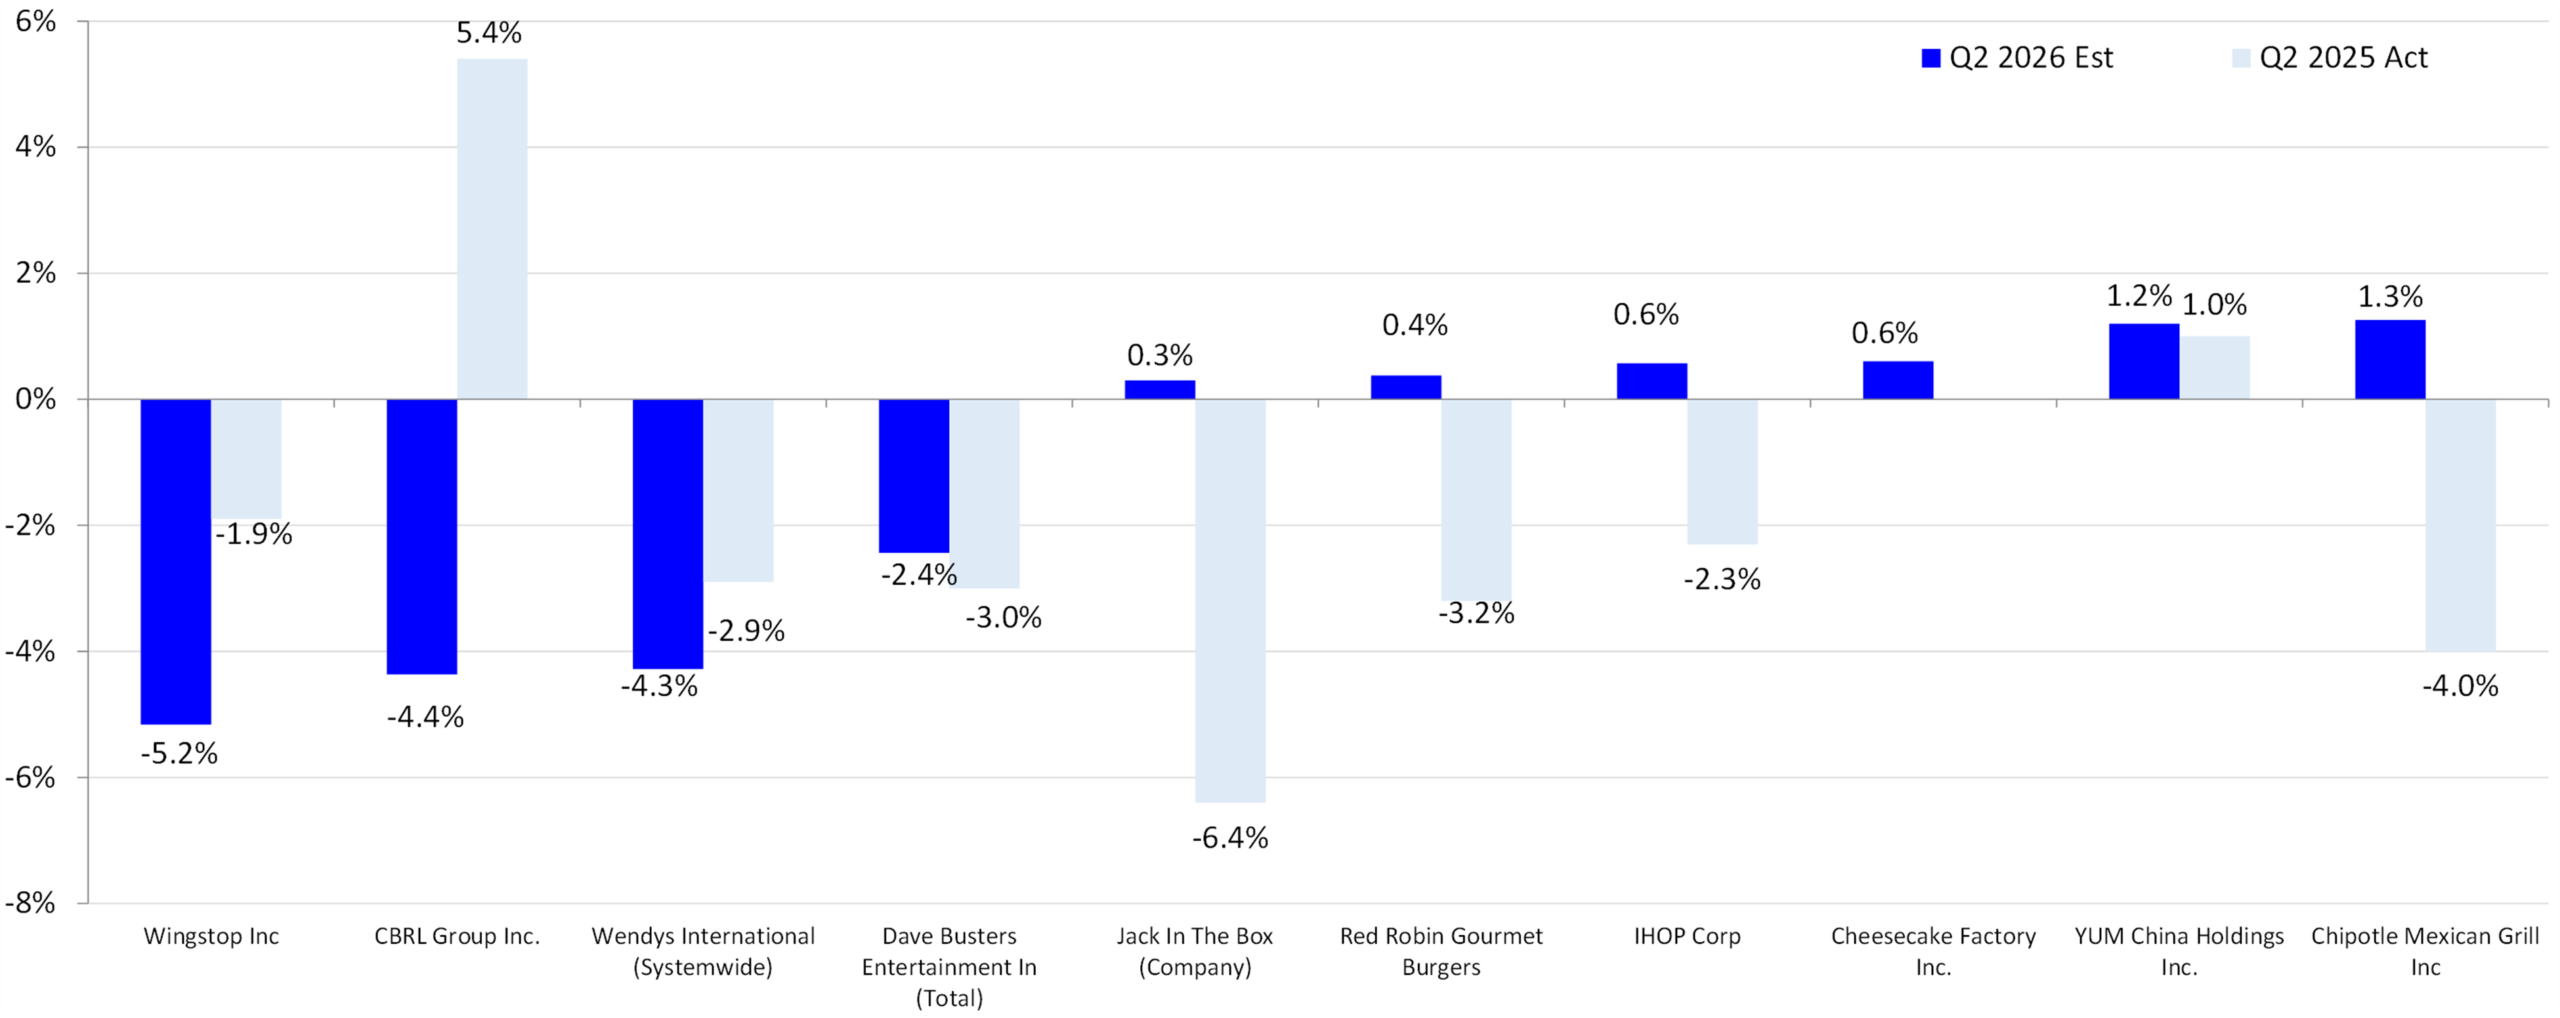
In the restaurant sector, approximately 82% of the companies in our same-store sales (SSS) index have reported or are on track to report positive Q2 2026 results. However, it’s important to note that many are benefiting from relatively easy year-over-year comparisons. On the weaker end, Dave and Buster’s (PLAY) has one of the lowest estimates at -2.4%. Meanwhile, Wingstop (WING), which faced an easy comparison from a year ago, has already reported a -7.5% comp, below its -5.2% estimate.
Exhibit 8: Weakest Restaurant Same Store Sales Estimates: Q2 2026 Estimate vs. Q2 2025 Actual
Source: LSEG I/B/E/S
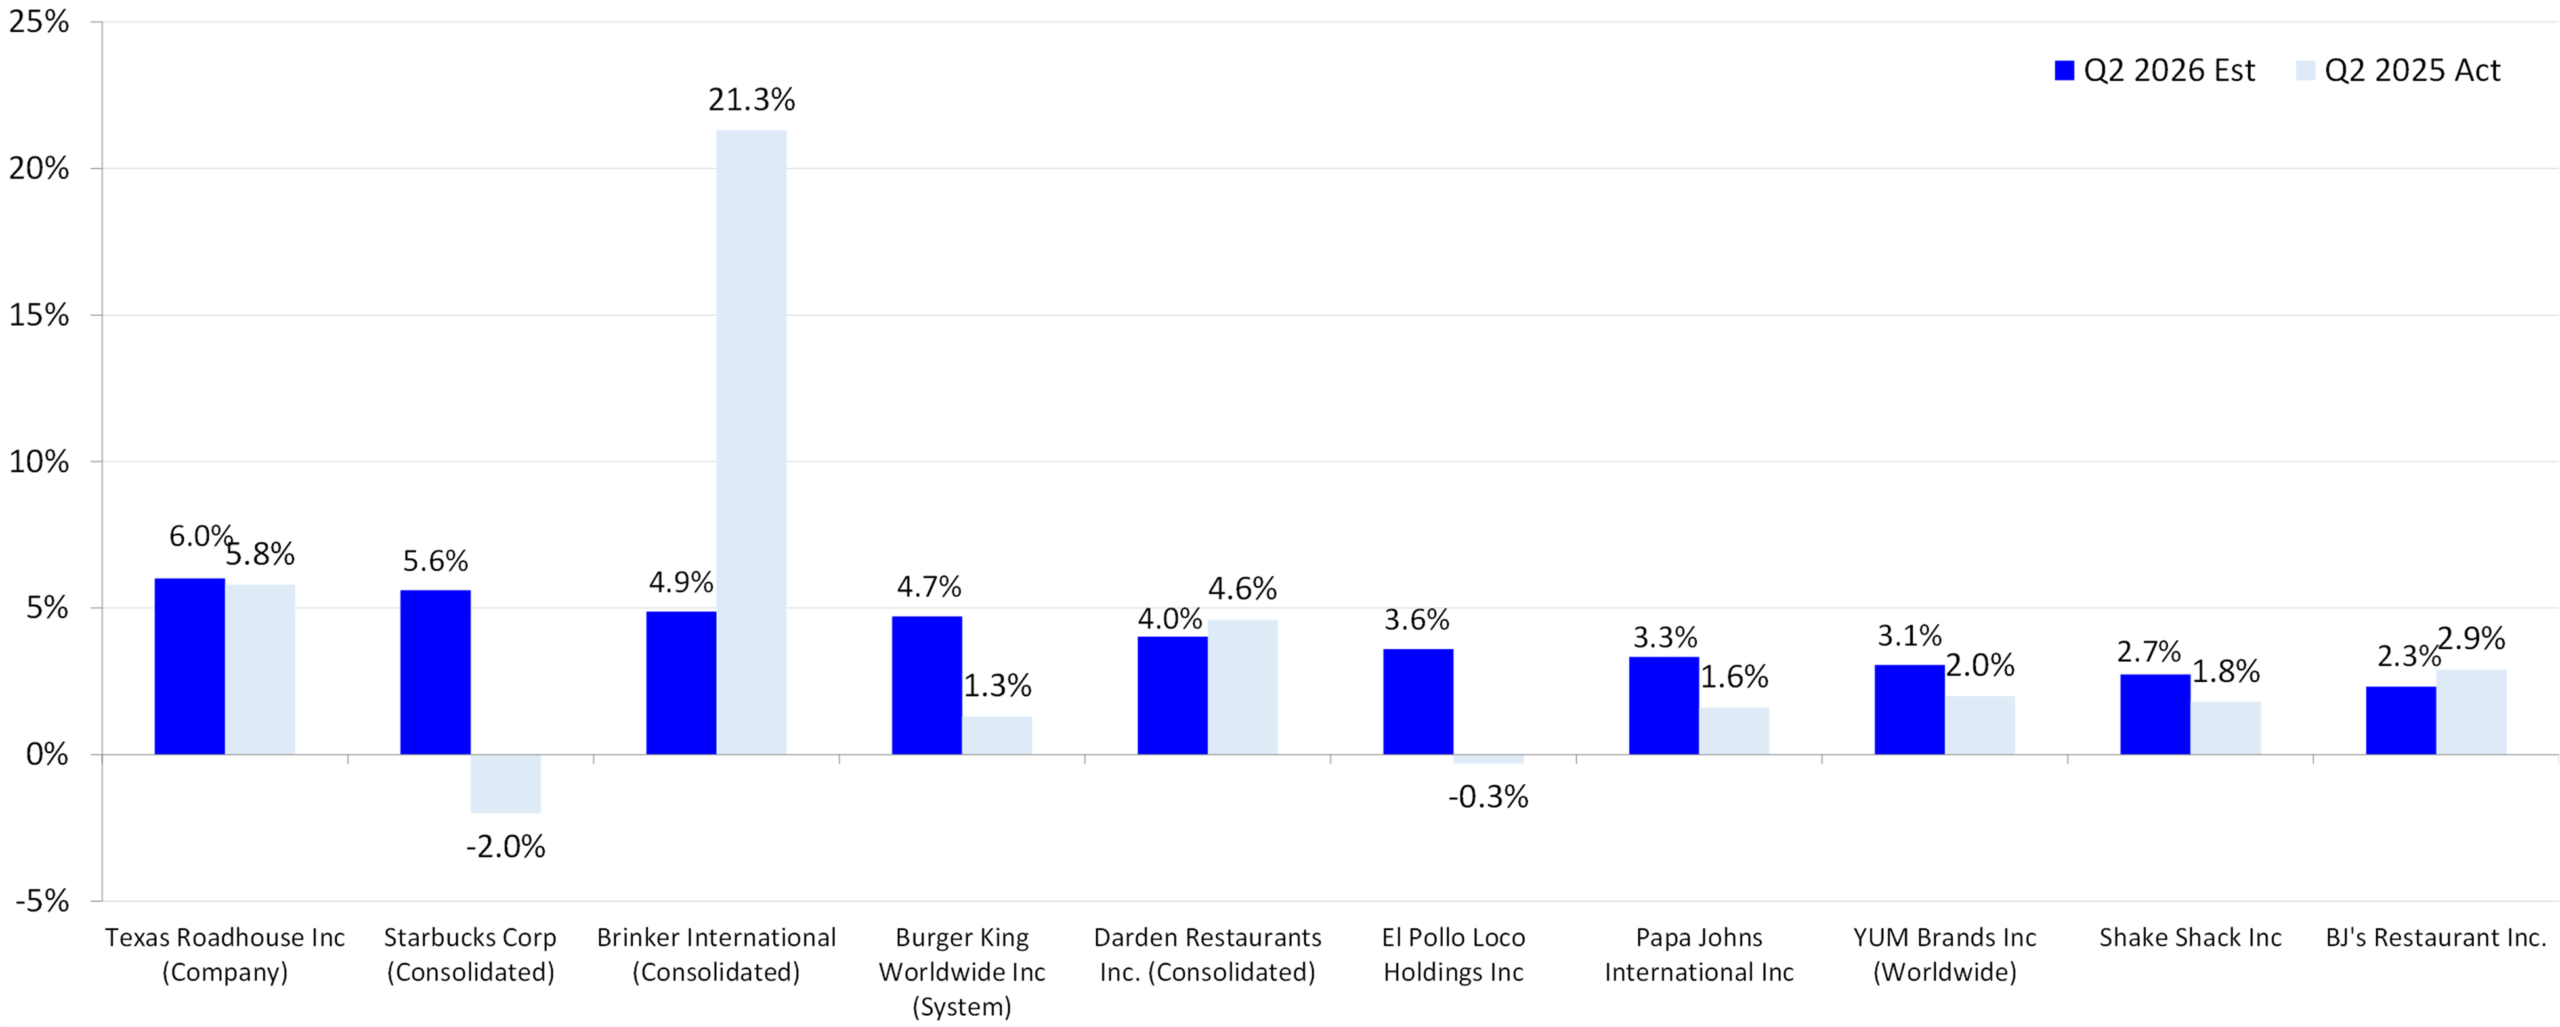
On the positive side, there are notable standouts. Brinker International (EAT) already reported a 5.0% SSS slightly above its 4.9% estimate, despite facing a difficult comparison from last year’s 21.3% growth. Similarly, Texas Roadhouse (TXRH) and Shake Shack (SHAK) already beat their SSS estimates and delivered solid comps of 6.2% and 3.5%, respectively.
Exhibit 9: Strongest Restaurant Same Store Sales Estimates: Q2 2026 Estimate vs. Q2 2025 Actual
Source: LSEG I/B/E/S


Comments
Log in or sign up to join the conversation.