

DAX30 CFD
Our overall opinion of the DAX30 didn't change much over the last week of trading, even though it became clear that bulls lost some of their steam and a drop and quarter-end close below 12,000 points appear to be a serious option.
Currently, traders around the globe speculate as to whether recent gains from the March and yearly lows over the second quarter could be pocketed, and asset allocators like pension funds could reallocate larger amounts into bonds. In fact, Wells Fargo estimates that the rebalance into bonds could be the largest in six years.
While these considerations mainly focus on US Equities, the positive correlation the European indices and thus the German DAX30 is unquestionably given and would also hit the German index.
So, if we get to see a break below 12,000 points, the technical main focus will be on the region around 11,800 points, a break lower makes a deeper correction possible and could see a re-test of the region around 11,450/500.
On the other hand: if the bulls can avoid a push back below 12,000 points, another stint as high as 12,900 points, probably even back above 13,000 points stays an option:
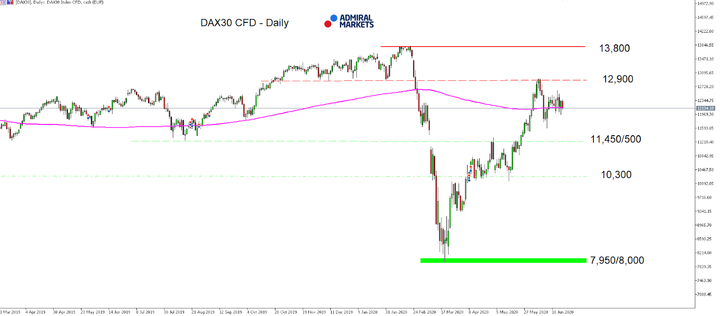
Source: Admiral Markets MT5 with MT5-SE Add-on DAX30 CFD Daily chart (between March 13, 2019, to June 26, 2020). Accessed: June 26, 2020, at 10:00pm GMT - Please note: Past performance is not a reliable indicator of future results, or future performance.
In 2015, the value of the DAX30 CFD increased by 9.56%, in 2016, it increased by 6.87%, in 2017, it increased by 12.51%, in 2018, it fell by 18.26%, in 2019, it increased by 26.44% meaning that after five years, it was up by 34.2%.
US Dollar
While 10-year US yields presented themselves over the last week again, holding clearly above 0.60%, potentially thanks to solid US economic projections over the last weeks and the Citi US Economic Surprise Index hitting record high after record high (note: the Citi US economic surprise index aggregates all material or market-moving economic data relative to consensus, currently showing that economic data surprises on the upside, outperforming expectations of market participants/analysts), our picture for the US dollar stays bearish.
The main reason for our increasing scepticism is the bullish performance of Gold with the yellow metal breaking to new yearly highs, despite no significant risk-off among market participants and US yields staying stable.
Our interpretation is that Gold traders might currently anticipate a Fed increasing the pace of her QE again, most likely driven by rising volatility in Equity and/or bond markets and thus a break lower in US yields.
That in mind leaves the mode in the US dollar currently neutral, technically between 94.00 and 104.00 points, but chances of a near-term break below 94.00 points stay elevated, activating 93.00 points the first target on the downside.
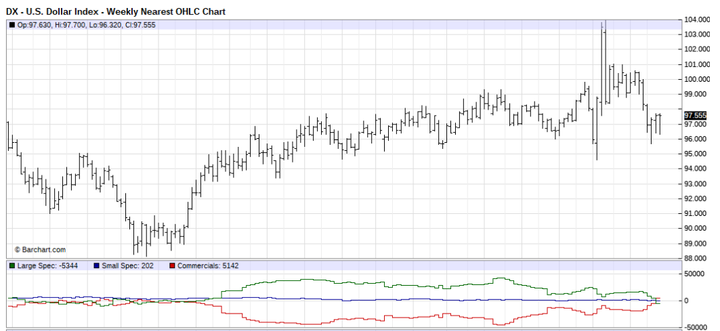
Source: Barchart - U.S Dollar Index - Weekly Nearest OHLC Chart (between July 2017 to June 2020). Accessed: June 26, 2020, at 10:00pm GMT
Euro
In our last weekly market outlook we made the re-test of the region around 1.1150/1200 a topic that
[…]the current corrective move might be the beginning of an aggressive attack to break above 1.1400/50.[…]
While we still wait for the aggressive attempt to break above 1.1400/50, the Euro took on bullish momentum against the region 1.1150/1200 after recent European economic indications surprised like the Manufacturing PMI for France last Tuesday which increased to 52.1 in June, beating market forecasts of 46 and pointing to the biggest expansion in the manufacturing sector since September of 2018.
Economic indications from Germany also surprised with the ifo Business Climate indicator rising by 6.5 points from the previous month to a four-month high of 86.2, beating market expectations 85.0 and pointing to the largest monthly increase in the index ever.
While we certainly remain cautious in regards to the sustainability of these numbers after the Corona lockdown, the overall picture in the Euro against the US dollar stays definitely positive.
While the monetary and fiscal stimulus in the eurozone should result in European yields to rise while US yields are expected to drop (while the Fed should be expected to balloon its balance sheet even further, it seems unlikely that more fiscal stimulus from the US government should be expected, given the US presidential election later this year), the yield differential between European and US yields should be expected to drop, favouring gains in the EUR/USD.
A break above 1.1400/50 leaves the EUR/USD bullish potential up to the region around 1.1700/1.1800, while a drop below 1.1200 could trigger a deeper correction with a target around 1.1000:
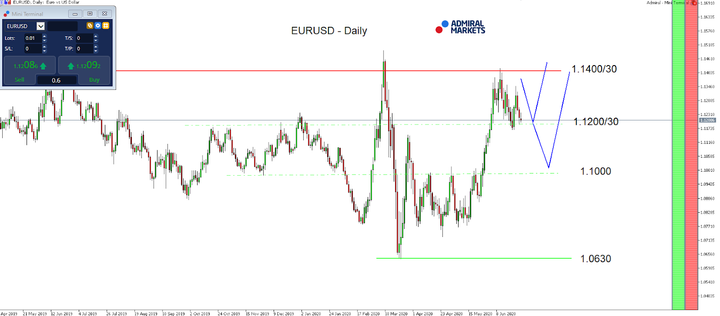
Source: Admiral Markets MT5 with MT5-SE Add-on EUR/USD Daily chart (between April 29, 2019, to June 26, 2020). Accessed: June 26, 2020, at 10:00pm GMT - Please note: Past performance is not a reliable indicator of future results, or future performance.
In 2015, the value of the EUR/USD fell by 10.2%, in 2016, it fell by 3.2%, in 2017, it increased by 13.92%, 2018, it fell by 4.4%, 2019, it fell by 2.2%, meaning that after five years, it was down by 7.3%.
JPY
The USD/JPY saw a significant push below 106.80/107.00 over the last week of trading which is especially noteworthy, since 10-year US yields presented themselves once again quite stable, holding above the important region of support around 0.60% and still solid US economic projections with the Citi US Economic Surprise Index hitting record high after record high.
One potential driver could have been that the recent JPY strength was related to the Softbank sale of T-Mobile shares.
While this could certainly be true, we are a little sceptical here since news around this sale have been played in the markets for quite some time now and such a sale and corresponding hedges are usually taking place ahead of time.
Still, the break lower in the USD/JPY does not come as a big surprise to us since we've been sceptical and favouring short engagements in the USD/JPY for quite a while now and consider recent price action to be sustainable, levelling the path down to the region around 105.00.
Our bearish expectation stays true as long as the currency pair does not sustainably recapture 109.00/50 and could find an aggressive driver once US yields finally break lower:
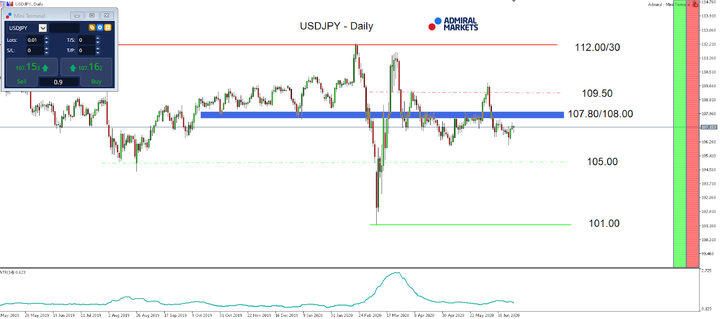
Source: Admiral Markets MT5 with MT5-SE Add-on USD/JPY Daily chart (between May 6, 2019, to June 26, 2020). Accessed: June 26, 2020, at 10:00pm GMT
In 2015, the value of USD/JPY increased by 0.5%, in 2016, it fell by 2.8%, in 2017, it fell by 3.6%, in 2018, it fell by 2.7%, in 2019, it fell by 0.85%, meaning that after five years, it was down by 9.2%.
Gold
Over the course of last week, Gold not only broke above the technical important region around 1,745 USD, but also marked new yearly highs.
In fact, chances seem elevated that we get to see an attempt to break above 1,800 USD and to the highest levels since 2012 into the quarterly close and thus in the days to come.
What's certainly interesting is that this break higher occurred despite the ongoing stabilisation of 10-year US yields above 0.60%, most likely induced after some solid US economic projections over the last weeks and the Citi US Economic Surprise Index hitting record high after record high (note: the Citi US economic surprise index aggregates all material or market-moving economic data relative to consensus, currently showing that economic data surprises on the upside, outperforming expectations of market participants/analysts).
Our interpretation is that Gold bulls are probably anticipating another wave down in terms of economic projections, but also a Fed which will rather sooner than later increase its balance sheet again after its 'short-term taper' over the course of the last two weeks.
That may become especially true if volatility in Equities picks up once again, similar to the heavier volatility after the Fed on June 11.
Such an increase could act as a very bullish driver for Gold, levelling the path rather sooner than later up to the current all-time high around 1,920 USD.
Technically the mode on a daily time-frame in Gold stays bullish as long as we trade above 1,660 USD:
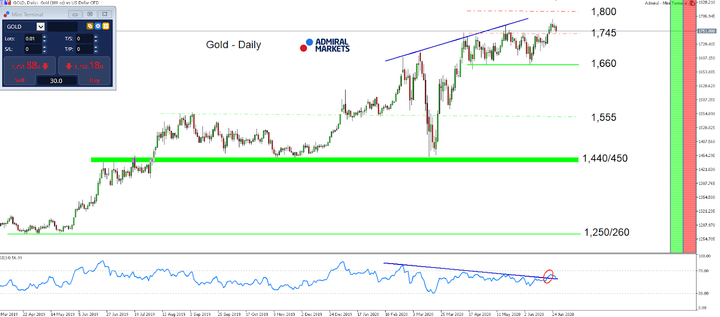
Source: Admiral Markets MT5 with MT5-SE Add-on Gold Daily chart (between March 28, 2019, to June 26, 2020). Accessed: June 26, 2020, at 10:00pm GMT - Please note: Past performance is not a reliable indicator of future results, or future performance.
In 2015, the value of gold fell by 10.4%, in 2016, it increased by 8.1%, in 2017, it increased by 13.1%, in 2018, it fell by 1.6%, in 2019, it increased by 18.9%, meaning that after five years, it was up by 28%.



Comments
Log in or sign up to join the conversation.