


Nonfarm payrolls in the United States expanded by 263,000 in September, somewhat less than the Dow Jones projection of 275,000, while the unemployment rate fell to 3.5%, compared to the forecast of 3.7%.
Some observers feel the report shows that the labour market is strong despite the Federal Reserve's efforts to slow the economy, which may embolden the Fed to proceed with another aggressive rate hike at its November meeting. This resulted in a dramatic drop in the US equity markets on October 7.

Although Bitcoin has traded in close correlation with US equity markets for the majority of 2022, this may change in the second half of the year, with Bitcoin "shifting toward becoming a risk-off asset, like gold and US Treasury's," according to Bloomberg Intelligence senior commodity strategist Mike McGlone in the Oct. 5 Bloomberg Crypto Outlook report.
To evaluate the short-term price prognosis, examine the charts of the S&P 500 index, the US dollar index (DXY), and the major cryptocurrencies.
SPX
On September 30, the S&P 500 index (SPX) fell and finished below its June low of $3,636. However, the bears were unable to sustain the lower levels. On Oct. 3, buyers aggressively purchased the drop, pushing the price back over the breakdown level of $3,636. This may have caught the aggressive bears by surprise, resulting in a short squeeze that pushed the price to the 20-day exponential moving average (EMA) ($3,779) on Oct. 4.
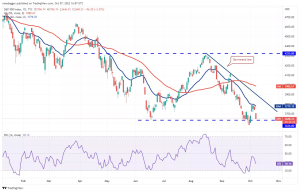
In a bear Market Volatility, experienced traders continue to sell on rallies, which is what the index did. The bears halted the recovery at the 20-day EMA, and the stock fell precipitously on October 7.
The zone between $3,636 and $3,584 is critical for the bulls to defend because a break and closure below it could signify the start of a new decline. The index may then fall to $3,500, and subsequently to $3,325.
If the price rebounds off the support zone, it indicates that the bulls are accumulating at lower levels. Buyers will next attempt to drive the stock over the 20-day EMA once more. If they are successful, the index may rise to the downtrend line.
The bulls must break through this level to signify that the short-term corrective phase is gone. The index may then begin a rally to $4,100.
DXY
The US dollar index is still on an upward trajectory. On Oct. 4, sellers drove the price below the 20-day EMA (111), but they were unable to maintain the lower levels. On Oct. 5, aggressive buying on dips lifted the price back over the 20-day EMA.
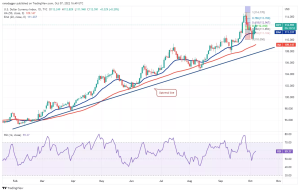
The bears are attempting to halt the uptrend between the 50% Fibonacci retracement level of $112.41 and the 61.8% retracement level of $112.96. If the price falls quickly from this level, it indicates that traders are selling on rallies. This might push the price back up to the 20-day EMA and eventually to $110.05.
If the $110.05 support level breaks way, it indicates that the short-term bullish impetus has faded. The price may then fall back to the uptrend line. A closing below this support level could suggest that the index has peaked.
Instead, if bulls push the index above $112.96, it might retest the multi-year high of $114.77. A break over this resistance level could indicate that the uptrend has resumed. The next upside goal is $117.14.
BTC/USDT
The 50-day simple moving average (SMA) ($20,019) and the downtrend line are providing strong resistance to Bitcoin's rescue surge. This demonstrates that bears are selling on rallies and will attempt to bring the price down to $18,626.
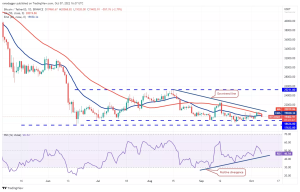
Retesting a support level repeatedly tends to erode it. If bears push the price below the significant support level of $18,626, the BTC/USDT pair could see panic selling. This might pave the way for a retest of the June low of $17,622.
To invalidate this bearish perspective, the bulls must push the price above the downtrend line and keep it there. If this occurs, positive momentum may increase and the pair may rise to $22,799. At this elevation, the bears may be a significant problem.
ETH/USDT
Since Oct. 4, ether has been trading near the 20-day exponential moving average ($1,364). The bears are defending the level, but the bulls have not given up much ground, which is a good sign. This indicates that purchasers expect the recovery to go longer.
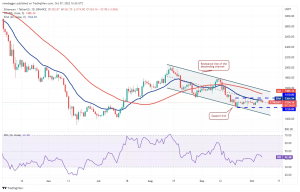
If buyers push the price over the 20-day EMA and the horizontal resistance at $1,410, the ETH/USDT pair could rally to the descending channel's resistance line. Bears may sell aggressively at this level.
If the price falls sharply off the resistance line, it suggests that the pair may stay in the channel for a few more days.
Bullish momentum may increase when the price rises above the channel. Alternatively, if bears push the price below the $1,220 support, the selling could get more intense.
BNB/USDT
BNB broke above the moving averages on October 3, but the bulls were unable to push the price above the next resistance level of $300. This indicates that bears are more active at higher elevations.
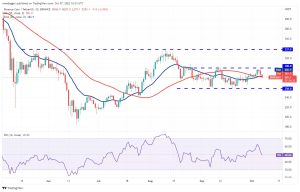
If the price remains below the moving averages, the BNB/USDT pair may remain trapped between $258 and $300 for some time. The flattening 20-day EMA ($283) and the relative strength index (RSI) near the middle suggest a short-term consolidation.
If the price returns from its current level, the bulls will try to push it above the overhead resistance zone between $300 and $308. If they succeed, the pair may be able to rally to the hard overhead resistance at $338.
XRP/USDT
XRP has been seeking to break through the first overhead barrier near $0.51 in order to retest the intraday high of $0.56 set on September 23. On the upside, this is the crucial level to watch because a break above it could signify the continuation of the uptrend.
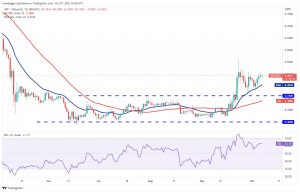
The positive RSI and upsloping moving averages signal that the path of least resistance is to the upward. If buyers push the price above $0.56, the XRP/USDT pair may gain momentum and rise to $0.66.
Bears will seek to drag the pair to the 20-day EMA if the price falls from the current level or the overhead resistance at $0.56. A strong rebound from this level might preserve the advantage in the buyers' favour, but a breach below this support could push the pair below $0.41.
ADA/USDT
Cardano fell below the uptrend line on September 30, and the bears successfully defended the level during the Oct. 4-6 retest. This indicates that the bears have turned the uptrend line into resistance.
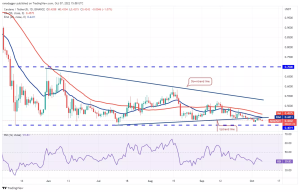
The bears will attempt to breach the critical support level of $0.40. If this support fails, selling could gain strength, and the ADA/USDT pair could enter the second leg of the downtrend. The pair may then fall to $0.35.
Bulls must swiftly push the price above the moving averages if they are to avoid another move down. If this occurs, the pair may rise to the downtrend line. Buyers must overcome this barrier in order to suggest a prospective trend change.
SOL/USDT
Solana broke above the moving averages on October 4, but the bulls were unable to build on this momentum. This implies that bears continue to regard rallies as a buying opportunity.
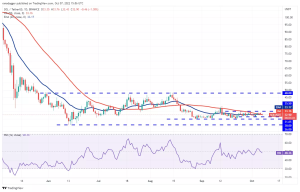
The 20-day EMA ($33.17) is steady, and the RSI is near the midway, indicating a supply-demand equilibrium. If the price continues to fall below the moving averages, the SOL/USDT pair might fall to $31.65. If the price bounces strongly off the support, it suggests that the range-bound action may continue for a few more days.
Buyers must push the price over the overhead resistance level of $35.50 in order to clear the way for a probable rally to $39. If the price falls below $31.65, the pair may revisit the critical support level of $30.
DOGE/USDT
On October 4, Dogecoin jumped above the moving averages, but the bulls were unable to sustain the pace. The price has dropped from $0.07 to the moving averages.
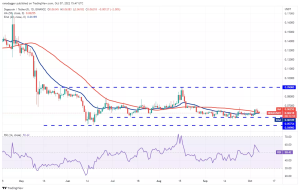
If the price bounces strongly off the moving averages, it indicates that the bulls are seeking to form a higher low. Buyers will then attempt to push the price above $0.07 in order to gain the edge in the short term. Because there is no significant resistance between $0.07 and $0.09, the DOGE/USDT pair may be able to complete this excursion fast.
In contrast, if the price falls below the moving averages, the bears will attempt to plunge the pair below the $0.06 support level once more. If the pair breaks through this support, it could drop to the June low of around $0.05.
MATIC/USDT
On October 4, Polygon surpassed the moving averages and reached the downtrend line. The bears are attempting to stop the recovery at the downtrend line, but the bulls have not given up ground to the sellers.
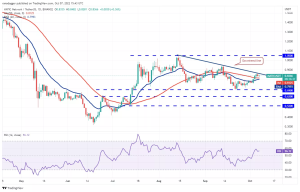
The 20-day EMA ($0.80) is gradually rising, and the RSI is in positive territory, indicating that bulls are in control. This increases the likelihood of a break above the downtrend line. If this occurs, the MATIC/USDT pair may rise to $0.94 and then to $1.05.
This bullish outlook may be rendered obsolete in the near term if the price falls and breaks below the 20-day EMA. The pair might then fall to the strong support level of $0.69. To gain the upper hand, the bears must lower the price below this level.
Comments
Log in or sign up to join the conversation.