


By Eli Levy of Cannon Trading
The cushion is gone. The index closed under the flip for the first time this letter has logged.
Yesterday’s cushion was the thinnest reading on our record. Last night it went negative. The S&P settled eleven points below the dealer gamma flip, and the corridor between the two walls collapsed from five hundred points to two hundred in a single session. That is a different market structure to the one that has absorbed every wobble since July — and it arrives on the morning a twenty-year auction clears one hour before the July FOMC minutes.
ES U26
7,716.00
+2.00 · +0.03%
NQ U26
29,525.25
−60.75 · −0.21%
VIX
15.78
−0.06 · −0.38%
WTI
85.81
+0.87 · +1.02%
US 30Y
5.277%
−0.8 bp
TODAY13:00 twenty-year bond auction (reopening) · 14:00 July FOMC minutes · 10:30 EIA petroleum status · 14:30 Trump remarks with technology leaders · no Fed speakers scheduled · Target, Lowe’s and Analog Devices reported before the open · Canada tariff pause expires end of Friday
ACT ITrade Today
Everything you need before the bell.
01 — THE 90-SECOND READ
Structure changed sides overnight
REGIME
Negative gamma,
first on our log
Cash closed 0.15% below the dealer gamma flip, eleven points under it. In this configuration dealer hedging sells weakness and buys strength, which amplifies moves rather than damping them. Every prior reading in this log has been positive: 8.49% above on August 14, 2.74% on August 17, 1.19% yesterday. What changes it back: a cash reclaim of the flip, mapped in Section 04. Eleven points is a regime that can change hands twice in a session — and both walls moved inward to meet it.
The regime crossed, and our own trigger never fired
Yesterday this letter named 7,652.84 as the level that would end positive gamma. Cash closed thirty-nine points above it. The regime changed anyway, because the flip rose fifty points and met the tape coming down. Section 04.
The corridor collapsed by three hundred points
The call wall came in from 8,000 to 7,800; the put wall went up from 7,500 to 7,600. A five-hundred-point band in which neither level mattered is now a two-hundred-point band in which both do, with cash in the middle. Section 04.
Yardeni named the level, and it is not far
Ed Yardeni published the ceiling on his own case: at a 5% ten-year his fair-value multiple falls to 20 times, which is where the index already trades. The ten-year is at 4.69%. Section 05.
The auction comes before the minutes
A twenty-year reopening clears at 1:00 PM; the July minutes land at 2:00 PM. That ordering is the day’s real risk, and the scenario map in Section 03 is built on it rather than on the direction.
Retail confirmed the crack, not the beat
Target beat on a headline padded with tariff refunds and trades −4%; Lowe’s cut its full-year guide to the low end and trades −2%. Tuesday’s Home Depot beat now looks like the outlier. Section 08.
The AI unwind is a credit story wearing an equity costume
Anthropic’s run-rate landed below the buy-side whisper and Seoul took the damage — the Kospi fell 5.80% overnight, its worst session of the year. But the paper that funds this buildout is what has to clear against a long bond at nineteen-year highs. Section 10.
02 — THE SCOREBOARD
Where everything sits
Instrument | Last | Change | Note |
|---|---|---|---|
S&P 500cash, Tue close | 7,691.76 | −53.30 · −0.69% | Third straight loss. Still 1.1% above its 20-day. |
Nasdaq CompositeTue close | 26,289.71 | −355.20 · −1.33% | Memory and optics did the damage. |
Dow IndustrialsTue close | 53,343.40 | −116.38 · −0.22% | Held up best. Again. |
Russell 2000Tue close | 3,017.89 | −39.65 · −1.30% | Small caps with the Nasdaq, not the Dow. |
ES E-mini S&PSep 2026 | 7,716.00 | +2.00 · +0.03% | Settled 7,714.00. Flat into the auction. |
NQ E-mini NasdaqSep 2026 | 29,525.25 | −60.75 · −0.21% | Settled 29,586.00. Still the laggard. |
YM E-mini DowSep 2026 | 53,447 | +44 · +0.08% | Green for a second morning. |
RTY E-mini RussellSep 2026 | 3,026.30 | −0.10 · 0.00% | Unchanged after a 1.30% cash drop. |
WTI crudeSep | 85.81 | +0.87 · +1.02% | Fourth straight up session. Section 07. |
Brent crudeOct | 91.84 | +0.82 · +0.90% | Hormuz still shut in practice. |
Natural gasSep | 2.814 | +0.038 · +1.37% | Both Cannon trend reads still down. |
GoldDec | 4,422.10 | +1.50 · +0.03% | Flat after a 1.70% down session. |
SilverSep | 63.59 | −0.447 · −0.70% | Down 3.46% yesterday. Larger beta, same trade. |
CopperSep | 6.423 | −0.0695 · −1.07% | Two sessions of industrial-metal selling. |
US 2-year | 4.158% | −1.7 bp | Front end still anchored by the hike debate. |
US 10-year | 4.690% | −1.6 bp | Touched 4.75% yesterday, highest since Jan 2025. |
US 30-year | 5.277% | −0.8 bp | Settled 5.285% off a 5.33% print. Section 07. |
2s10s | +53.2 bp | +0.1 bp | Steepener holding. The long end still leads. |
DXY | 99.411 | −0.246 · −0.25% | Near two-month lows. Section 05. |
EUR/USD | 1.1605 | +0.0031 · +0.27% | ECB September hike close to fully priced. |
USD/JPY | 159.10 | −0.52 · −0.33% | Yen firmer into a 3.16% Nikkei drop. |
VIX | 15.78 | −0.06 · −0.38% | 14.25 on August 14 was the 2026 low. |
Bitcoin | 64,451.50 | −154.63 · −0.24% | Short-term trend up, long-term still down. |
Sentiment & flow gauges
Gauge | Reading | Prior | Read |
|---|---|---|---|
CNN Fear & Greed7:33 AM ET | 54 | 621 week ago | Neutral. Was 37 a month ago — the round trip is complete. |
AAII bull / bearwk to Aug 12 | 34.7 / 37.9 | 37.0 / 38.0 | Spread −3.2. Retail net bearish for a second week. |
SPX implied volTue close | 12.68% | 12.27%historic | IV rank 12.9%. Implied above realised for a second session. |
Asset-manager S&P net longCFTC, Aug 11 | +948,481 | — | Leveraged funds net short 280,446, having covered 49,848. |
S&P 500 above 50-dayTue close | 59.6% | 62.0% | Above 200-day 68.1%, barely changed. Short-term breadth is what is going. |
Sept FOMC — hikeas of Aug 18 | ~35% | ~52%a week earlier | Hold ~65%, ease 0.0%. Section 09. |
Overnight: Nikkei −3.16% to 65,326.42 · Kospi −5.80% to 6,471.17 · Shanghai −2.40% · Hang Seng +0.09% · ASX −0.18% · Stoxx 600 +0.06%, DAX −0.05%, CAC +0.41%, FTSE −0.02%. Index rows are Tuesday’s cash closes; futures, commodities, FX, rates and overnight quotes are as of 7:40 AM ET.
The flow read
The positioning picture has not changed and that is precisely why the structural change matters. Asset managers still hold 948,481 contracts net long in S&P futures, leveraged funds have covered nearly fifty thousand shorts, and retail says it is bearish while the index sits 1.4% off its record close. There is no crowded short to squeeze and a very full real-money book to sell. That was survivable while dealer hedging leaned against every move. It is a different proposition now that hedging leans with them.
Breadth is the leading indicator here rather than the index. The index is still 1.1% above its twenty-day average and 2.3% above its fifty-day, having lost less than three-quarters of a percent on the session — and yet new highs against new lows across all US exchanges ran 108 to 141, negative. The average stock has been going down for longer than the index has, and the negative-gamma switch removes the mechanism that was hiding it.
Tuesday’s calls, graded
HIT
Cannon Desk, Tuesday — that the gamma cushion “is closer to running out of room than at any point” in the month. It ran out in one session — the cushion went from positive to negative overnight for the first time on our record.
MISS
Cannon Desk, Tuesday — naming 7,652.84 as the cash level that ends positive gamma. Cash held above it and the regime changed anyway — the right idea attached to the wrong object. Section 10.
MISS
Cannon Desk, Tuesday — that the 8,000/7,500 corridor was “wide enough that neither is a magnet and both are real barriers.” Both walls moved inward within twenty-four hours. Durability was the wrong assumption.
HIT
Lori Calvasina, RBC Capital Markets — that US consumer resilience is starting to show cracks, concentrated in discretionary. Home Depot went against her Tuesday; Target and Lowe’s went for her this morning. Section 08.
MISS
Yung-Yu Ma, PNC — that the consumer is not what holds the rally back. Lowe’s cut its full-year outlook this morning. The thesis survived Home Depot and not the next two prints.
OPEN
Tom Lee, Fundstrat — 8,000 by month-end. That now requires 4.0% in eight sessions, from below the flip.
03 — CALENDAR & SCENARIO MAP
Two events, one hour apart, in the order that matters
ET | Event | Cons. / Prior | Note |
|---|---|---|---|
Wed 02:00 | UK CPI (Jul) — released | 2.9% / 2.6% | Core 2.6%. Four-month high on energy bills. |
Wed 05:00 | Euro area HICP final (Jul) | — | Lagarde speaks. September ECB hike near fully priced. |
Wed 06:00 | Target · Lowe’s · Analog Devices — reported | — | Section 08. |
Wed 10:30 | EIA weekly petroleum status | — | API late Tuesday: crude −0.3mn, Cushing −1.4mn. |
Wed 13:00 | Twenty-year bond auction (reopening) | — | Clears one hour before the minutes. Scenario map below. |
Wed 14:00 | July FOMC minutes | — | Three dissents, all to hike. Section 09. |
Wed 14:30 | Trump remarks with technology leaders | — | Lands inside the minutes reaction. |
Thu 08:30 | Weekly claims · Philadelphia Fed · 10:00 leading indicators | — | Walmart and Alibaba report. |
Fri 09:45 | Flash manufacturing & services PMI | — | Canada tariff pause expires end of day. |
Retail sequence: Target, Lowe’s and Analog Devices this morning · Ross Stores Thursday · Williams-Sonoma Friday. Nvidia reports Wednesday August 26 after the close, and core PCE lands the same day. Jackson Hole runs August 27–29, with Chair Warsh’s keynote on Friday the 28th — his first as chair.
1:00 PM AUCTION, 2:00 PM MINUTES, NEGATIVE GAMMA IN BETWEEN20Y reopening · three dissents to hike · cash 11 pts under the flip
THE AUCTION CLEARS AND THE MINUTES ARE OLD NEWS
A reopening that stops on or through the screen takes the supply question off the table for a week, and the minutes describe a meeting held three weeks ago by a committee that has since seen softer jobs and in-line inflation. In that branch the long end retraces, the flip is reclaimed on the first push, and the negative-gamma window lasted a single session. The tell is the 1:00 PM stop against the when-issued yield, not the 2:00 PM text.
THE AUCTION TAILS AND THE MINUTES READ HAWKISH
The same sequence with the other outcomes compounds rather than offsets. A tail at 1:00 sets a higher long-end level going into a 2:00 document whose only surprise direction is hawkish, because all three July dissents were votes to raise. Below the flip, hedging adds to whatever the tape does with that. Equal-weight and small caps carry the downside here, and the put wall in Section 04 is the first level with a book behind it.
Descriptive only. This maps how desks and the options surface frame the two outcomes; it is not a recommendation.
04 — LEVELS & STRUCTURE
The flip came up to meet the tape, and both walls came in
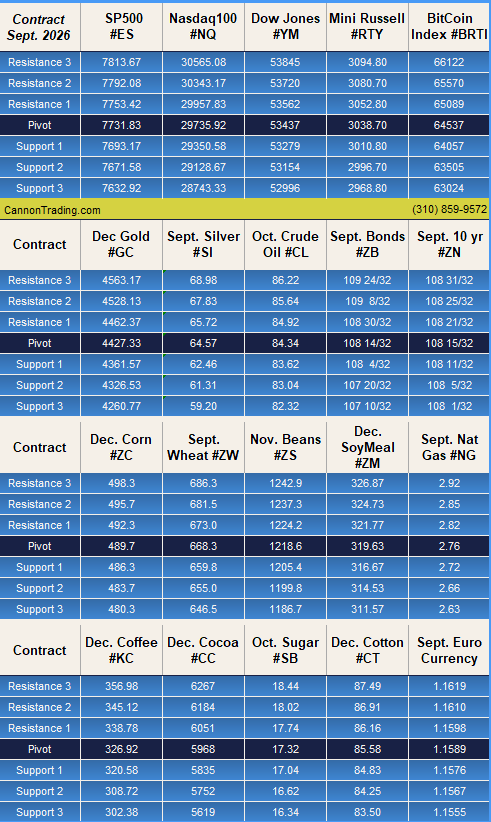
Cannon Daily Levels — August 19, 2026 · September contracts
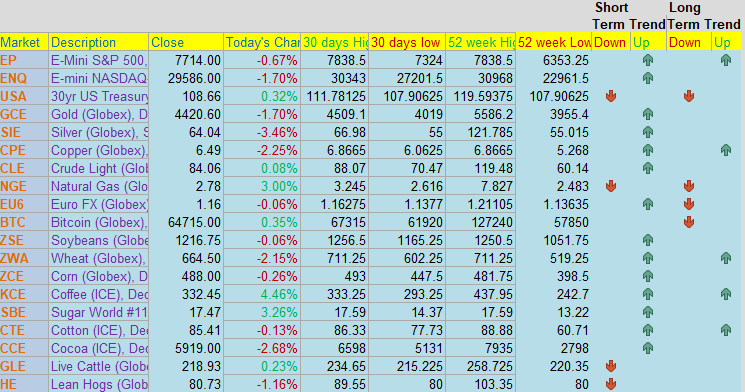
Cannon Edge — daily futures snapshot · short- and long-term trend reads
Dealer gamma map — SPX
Level | SPX | ES Sep | Distance from cash |
|---|---|---|---|
Call wall | 7,800.00 | 7,822.24 | +1.41% above |
Gamma flip | 7,703.01 | 7,725.25 | +0.15% above |
Cash close, Tue | 7,691.76 | 7,714.00settle | The basis itself. |
Put wall | 7,600.00 | 7,622.24 | −1.19% below |
Read the table by what moved rather than where things sit. The flip rose 50.17 points while cash fell 53.30, and the two crossed. The call wall came down 200 points and the put wall came up 100. That is not a model drifting on a thin implied-vol rank — that is a dealer book repositioning its whole distribution around a much tighter range in one session.
Above 7,703.01, hedging leans against the day — rallies sold into, dips bought. Below it the same desks do the opposite, which turns a move into a bigger move. Eleven points is nothing and this can change hands twice before lunch; what it removes is the assumption that has held all month, that structure absorbs whatever the calendar throws at the tape.
The basis re-derives to +22.24 on a settle basis and +24.24 live. Translate any SPX level in the table with it and re-derive it tomorrow rather than carrying it forward — it was negative on a live basis yesterday and has swung more than thirty points in three sessions.
Cannon pivots — September contracts
ES: pivot 7,731.83, resistance 7,753.42 / 7,792.08 / 7,813.67, support 7,693.17 / 7,671.58 / 7,632.92. Two convergences are worth more than any single line. The gamma flip in September terms is 7,725.25, six and a half points under the Cannon pivot — so pivot and regime boundary are the same zone this morning, which makes the 7,725–7,732 band the day’s first real decision. And S1 at 7,693.17 is within a point and a half of yesterday’s cash close. Futures at 7,716 sit between the two.
NQ: pivot 29,735.92, resistance 29,957.83 / 30,343.17, support 29,350.58 / 29,128.67 / 28,743.33. Futures sit 210 points under that pivot with a 175-point gap down to S1 — the widest structural air pocket in the complex again this morning, which is what it had yesterday and what it used.
September bonds are the line to watch outside equities: pivot 108-14, resistance 108-30, support 108-00. The contract settled 108-21 on Cannon’s own board, above its pivot for the first time in days — but its thirty-day low and its fifty-two-week low are the same number, 107-29, and both trend reads are still down. It is the only major line on the board reading down on both horizons alongside natural gas. Elsewhere: crude October pivot 84.34, resistance 84.92 / 85.64 / 86.22, with front-month trading through the second; gold December pivot 4,427.33; silver September pivot 64.57, first support 62.46, and silver is between them; bitcoin pivot 64,537.
ACT IIThe Read
Who moved, and what they actually said.
05 — INSTITUTIONAL POSITIONING
New and moved voices
Ed Yardeni· President, Yardeni ResearchBULL · PUBLISHED HIS OWN CEILING
The most useful thing a bull can publish is the level at which he stops being one, and he published it five separate ways on Tuesday. The frame is the Fed’s old stock valuation model — forward earnings yield against the ten-year — which he argues is working again after two decades. At last week’s 4.68% ten-year it puts fair value at 8,300, roughly 6.6% above the index on the day he ran it. At a 5% ten-year the fair-value multiple falls to 20 times, which is what the index already trades at. Above 5%, the cushion is not thin. It is zero.
His own summary of the driver, posted late Tuesday: “Bond yields are rising globally, but in the US it’s being driven by record corporate debt issuance to fund AI infrastructure. The economy looks strong enough to handle it.” On air the same morning, more bluntly: “the bond market is finally working the way it should work.” He keeps 80% odds on his “Roaring 2020s” scenario and a 4–5% ten-year range. The position is narrower than the label — bullish inside a band with a hard upper edge, and the index sits thirty-one basis points of ten-year yield from it.
Kevin Gordon· Charles SchwabNEW TO THIS LETTER
He supplies the mechanism the rest of the tape is describing without naming. From Tuesday’s written note: “Inflation remains in the driver’s seat for stocks” — and the evidence is a correlation reading rather than an opinion. Yields and equities are running at their most negative correlation since 1997. That is the technical definition of a market keying off inflation data rather than growth data: when bonds sell off on growth, stocks can rally with them; when bonds sell off on inflation, stocks cannot. On CNBC the same afternoon he was deliberately unexcitable about the size of the move — it “has been modest.” Both things fit. The move is small; the sign of the relationship is what changed.
Anshul Pradhan· Head of US Rates Research, BarclaysNEW TO THIS LETTER
The cleanest statement anyone has made about why the long end is not listening to the data: “What is notable today is not the existence of these pressures, but that they appear strong enough to overwhelm individual soft-data releases. Three independent releases argued for lower yields this month; long end yields moved higher anyway.”
Barclays attributes the move to the deficit, to AI-related corporate issuance competing with Treasuries for the same duration, and to a rising term premium — explicitly not inflation. If that is right, a hawkish set of minutes moves the front end and leaves the thirty-year where it is, and a dovish set does not rescue it either. On this desk’s reading the 2:00 PM document is not the instrument that prices the long bond. The 1:00 PM auction is.
Michael Hartnett· Chief Investment Strategist, BofASURVEY MOVED · MOST BULLISH SINCE 2021
The August Global Fund Manager Survey — 203 investors running $581bn — was taken in the same week the long end made a nineteen-year high, and it is the most bullish positioning print since November 2021. Cash fell to 3.5% of assets, through the 4.0% level his own cash rule treats as a sell trigger; net 56% are overweight global equities. His instruction: “retreat or rotate within risk assets rather than reload.”
Two answers matter more than the headline. The most-crowded trade is long global semiconductors at 53%, down from a record 82% a month ago — a very large unwind in four weeks, and part of why memory and optics carried Tuesday’s damage rather than the index. And 38% of the panel names hyperscaler capital expenditure as the likeliest cause of a systemic credit event, with the AI bubble the top tail risk at 32%. The same managers who put cash through a sell trigger to buy equities have already named the financing chain they think breaks first. On the Fed, 72% expect no hike before the midterms and 53% expect Warsh to strike a neutral tone at Jackson Hole.
George Saravelos· Global Head of FX Research, Deutsche BankNEW TO THIS LETTER
Published at 5:32 this morning, and the only fresh desk view on the dollar that engages with the new chair directly. Ambiguity is itself a currency variable: “the Fed has been ambivalent on its reaction function to inflation,” with “mixed signals” from Warsh on the inflation target and the toolkit. A central bank that will not say what it responds to cannot hold its currency on rate differentials alone. His sharper point is about plumbing: the Fed’s standing FIMA repo facility, used in the recent yen intervention, “ultimately has the same economic impact as quantitative easing.” A Fed that has not eased on paper may have been easing in practice through a facility nobody scores as policy.
06 — DESK SHIFT TRACKER
The full roster
Voice | Firm | Stance | Where they stand |
|---|---|---|---|
Ed Yardeni | Yardeni Research | BULL | Bullish below a 5% ten-year, zero cushion above it. Card above. |
Michael Hartnett | BofA | CAUT | Survey most bullish since 2021; cash through his own sell trigger. Card above. |
Anshul Pradhan | Barclays | CAUT | Long end is trading supply and term premium, not data. Card above. |
Kevin Gordon | Charles Schwab | NEUT | Inflation, not growth, is setting the equity-bond correlation. Card above. |
George Saravelos | Deutsche Bank | NEUT | Fed ambiguity is dollar-negative; FIMA repo is easing by another name. Card above. |
Jonathan Krinsky | BTIG | CAUT | Day two of the Aug 18–Oct 11 window he named. Index down 0.69% on day one. Full treatment Tuesday. |
Goldman Delta One desk | Goldman Sachs | HAWK | “Fed May Be Forced To Hike” — against its own house economist. Section 09. |
Jan Hatzius | Goldman Sachs | NEUT | September hike “very unlikely”; market pricing “too hawkish.” Section 09. |
Mark Newton | Fundstrat | CAUT | Long-end yields to 5.60–5.70% on a three-year triangle resolution. Section 07. |
Jeff Gundlach | DoubleLine | CAUT | Called the “mid-5s before the September presser” in July. The call is now live. Section 07. |
Priya Misra | J.P. Morgan Asset Mgmt | BULL | “We’re nearing a peak in Treasury rates” — the cleanest opposite of Newton and Gundlach. |
Adam Parker | Trivariate Research | BULL | The equity reaction to yields is “fleeting”; the economy is strong enough to power through. |
Collin Martin | Charles Schwab | BULL | Corporate new issue “generally well received”; spreads back to where they started the year. Section 07. |
Tom Lee | Fundstrat | BULL | 8,000 by month-end. Section 02. |
Ordered by weight on today’s setup. Voices that moved carry a full card in Section 05; everyone else is a name-reference to where their number lives.
07 — MACRO PRESSURE MAP
The long end is the whole argument, and it is not about the Fed
The thirty-year printed 5.33% on Tuesday, its highest yield since 2007, and settled at 5.285%. The ten-year touched 4.75% intraday, the highest since January 2025. Note what the front end did while that happened: almost nothing. This is a bear-steepening driven entirely from the back, and the desks that have published on it this week — Barclays in Section 05, Bank of America — land on the same three causes and excludes the same fourth. Deficit, supply, term premium. Not inflation.
The supply side now has a measurable name. Amazon, Alphabet, Meta and Oracle sold roughly $194bn of bonds in 2026 through early July against about $108bn for all of 2025 — up 79%. Goldman Sachs projects those four plus Microsoft at $250bn this year and $400bn in 2027, and puts global AI-related debt supply at $489bn year to date; Barclays counts AI paper at roughly 15% of all investment-grade issuance. Apollo’s Torsten Slok asks what nobody on the sell side wants to answer — who is the marginal buyer as that supply climbs? A combined $75bn of recent deals from Nvidia, SpaceX and Amazon struggled to clear and traded down after pricing.
Not everyone reads that as indigestion. Schwab’s Collin Martin notes that corporate new issue “has generally been well received” and that investment-grade spreads are back to where they started the year. Both can be true: the paper is clearing, and it is clearing by paying up in yield rather than in spread. That is how a corporate financing boom becomes a Treasury market problem without becoming a credit event. It is why Fundstrat’s Mark Newton has long-end yields going to 5.60–5.70% on a three-year triangle resolution, and why DoubleLine’s Jeff Gundlach — who called the “mid-5s before the September presser” in July — is watching that call trade. Against them, J.P. Morgan Asset Management’s Priya Misra says we are nearing a peak in rates. This afternoon is the first vote on it.
Crude is up for a fourth straight session and the reason has not softened. Washington told its envoys to stop talking to Tehran, the negotiating window agreed in June expired Monday, and the Financial Times reported that Iran has assessed strikes on US military assets in south-eastern Europe and on subsea cables in the Strait of Hormuz. The UAE has halted all trade with Iran. The refined-product tape is where the shortage is visible — the US diesel crack printed a record $102.20 a barrel on Monday. Meanwhile the German ten-year bund is at 3.22%, its highest since May 2011, with a September ECB hike close to fully priced, and the ten-year JGB is at 2.95%, the highest since 1996. Three of the four largest government bond markets are repricing duration at once — which is why Mohamed El-Erian flagged this month’s thirty-year auction stopping at 5.216%, the highest since 2001, as the number to watch rather than any secondary-market print.
08 — PORTFOLIO POSITIONING
The single names, told once
Target beat by nearly two dollars and fell four percent, which tells you the market read the print rather than the headline. Earnings of $4.11 against roughly $2.31–2.35 expected, revenue of $26.54bn against $26.15bn, and a raised full-year range of $9.90–10.90 — padded by a tariff refund. Strip it out and the guide is $8.25–9.25 against $7.50–8.50 previously: still a genuine raise, much smaller, into a stock that has run roughly 50% this year.
Lowe’s is the cleaner signal, because there is nothing to strip out. Adjusted earnings of $4.40, comparable sales up 0.2%, and a full-year outlook cut to the low end — sales around $92bn, comps flat, adjusted earnings of $12.25. The stock is down 2%. Read the week in sequence: Home Depot beat on both lines Tuesday, revenue $47.86bn and up 5.7%, guidance reaffirmed, stock +1%. One beat-and-reaffirm, one padded beat sold off, one guidance cut — a consumer that is fine in aggregate and deteriorating at the margin. Walmart Thursday is the tiebreaker.
The AI complex is where the actual damage was, and its cause was a revenue number, not a rate. Anthropic’s preliminary second-quarter revenue came in above $11.5bn against $787m a year earlier, with an exit run-rate near $65bn — extraordinary growth, and below a buy-side whisper north of $80bn. Everything downstream of that gap sold: Fabrinet −20% despite record fourth-quarter revenue, AXT −12%, Lumentum −10%, Corning −8%, Micron −7%. The names most people watch barely moved — Nvidia −2.3%, Broadcom −3.2%. Seoul took the full weight of it overnight.
One counterexample is worth more than the list. SK Hynix announced a 40 trillion won buyback and cancellation — roughly $28.6bn — plus at least half of 2025–27 free cash flow to shareholder returns. Its Seoul line still fell almost 8% while the ADR trades up 3–4% pre-market. Same company, same news, opposite prices in two time zones — the cleanest available measure of how much of this move is reassessment and how much is one region liquidating.
Two threads for the board. The twenty-nine-state child-safety case against Meta opened Tuesday in federal court in Northern California before Judge Yvonne Gonzalez Rogers — roughly six weeks, an eight-person advisory jury, judge deciding liability, with Meta having said exposure could reach $1.4tn. There is no verdict yet. And WYFI fell 18.7% pre-market on a $250m convertible raised to fund AI infrastructure. When the equity market charges eighteen percent to finance a data centre, the cost-of-capital story in Section 07 has reached the small-cap end.
09 — FED WATCH
The only direction the minutes can surprise in is hawkish
Start with the vote, because it constrains the document. The July 28–29 meeting held the target range at 3.50–3.75% with three dissents — Logan, Hammack and Kashkari — all voting to raise. No one dissented toward easing. That asymmetry is the whole reason this afternoon matters: a set of minutes that reveals more hawkish sentiment than the vote implied is a live outcome, and a set that reveals dovish sentiment nobody expressed at the meeting is not. Chair Warsh continues to refuse forward guidance, so there is no published path for the minutes to contradict. There are no Fed speakers on the calendar this week to soften whatever lands at 2:00 PM.
The market has been moving the other way, and fast. September hike odds have fallen from roughly half to roughly a third in six sessions, as the Scoreboard shows, and no cut is priced at any horizon. The first fully-priced twenty-five basis point hike has slipped to January 2027, having been fully priced for December a week earlier. That is a market positioned for a committee that stays put — a committee whose last recorded action was three people voting to tighten.
The most interesting disagreement on the Street this week is inside one firm. Goldman Sachs’ chief economist Jan Hatzius published on Sunday that a September hike is “very unlikely” and that “we still think market pricing for the funds rate is too hawkish”; the house baseline is on hold through 2026. On Tuesday afternoon the firm’s own Delta One desk circulated a note titled “Fed May Be Forced To Hike,” which names that view and rejects it, pointing at the long end, at crude, and at a Hormuz disruption the economics team has not repriced. Two desks, one building, forty-eight hours apart, opposite signs. The honest answer to what this afternoon means is that the house with the most resources on the question does not agree with itself.
The clock that matters is not today’s. Warsh delivers his first keynote as chair at Jackson Hole on Friday the 28th, and the BofA panel in Section 05 is majority-positioned for a neutral tone. If the minutes are this committee’s last word before the chair speaks in Wyoming, a hawkish reading has nine days to compound before anyone can walk it back.
ACT IIIThe Edge
Three things the tape has not worked out yet.
10 — WHAT THE CONSENSUS IS MISSING
The edge
Everyone is watching the distance to the flip. The number that changed is the width of the corridor, and it halved in a session
For four weeks this letter has treated the dealer gamma flip as a regime switch and warned it is a poor distance measure. That warning was correct and insufficient. Yesterday we named a cash level that would end positive gamma; cash never reached it and positive gamma ended anyway, because the flip is not a line the tape crosses — it is a number that walks toward the tape. Anyone tracking “how far are we from the flip” was measuring one side of a two-sided convergence. What almost nobody is looking at is the second thing that happened on the same close: the corridor between the two walls went from five hundred points wide to two hundred. In a five-hundred-point corridor neither boundary constrains a day’s trade. In a two-hundred-point corridor, with cash almost exactly in the middle, both are inside a plausible two-day range. The regime tells you the sign of dealer hedging; the corridor width tells you how far they can run before hedging meets a wall of open interest and changes character again. It is now the tightest structure of the month, on the morning of an auction and a set of minutes.
The Anthropic number was priced as an equity disappointment. It is a credit input, and the people who know that already said so
A sixty-five billion dollar run-rate against an eighty-billion whisper cost Fabrinet a fifth of its market value and took the Kospi down almost six percent. That is the market treating a revenue miss as a demand signal for hardware — a reasonable first reaction and the wrong second one. The AI buildout is not primarily equity-financed any more. It is bond-financed, on the scale laid out in Section 07, and bonds are not valued on growth surprises but on coverage. A revenue curve below the whisper does not change a hyperscaler’s multiple very much. It changes the forward coverage arithmetic on paper underwritten by people who modelled a steeper curve of revenue, and which has to be refinanced into the long end where it now sits. Here is what makes it an edge rather than a worry. Tuesday produced the first hard number against which that arithmetic can be run, and the two markets did completely different things with it: equities repriced the suppliers by up to a fifth of their value in a session, and credit repriced nothing at all — investment-grade spreads are where they started the year. One of those markets has processed the information and one has not, and the price action does not tell you which.
Every gauge that measures fear is sitting at neutral, and it is measuring the wrong thing
Run the list of what happened to this market in one session. Third consecutive down day. A crossing into negative gamma, the first on our record. The share of index members above their fifty-day average down nearly four percent, with new lows beating new highs across all US exchanges. Now the list of what the volatility complex did about it. The CNN Fear & Greed Index sits at dead neutral, having been 62 a week ago and 37 a month ago. The VIX is a fraction above the 2026 low it set five sessions back. Implied volatility rank is in the low teens, near the bottom of its own annual range. None of these are wrong. They are measuring the index — and the index is fine. It moved less than three-quarters of a percent, it is still comfortably above every moving average that matters, and on trend nothing has broken. That is the point. The damage this week has been under the index rather than in it, in breadth and in structure, and there is no widely-followed gauge that prices either. A market whose fear instruments track the one variable that has held up, on the morning that variable loses its structural support, is not a complacent market. It is a mismeasured one.



Comments
Log in or sign up to join the conversation.