

Much of what happens to the British Pound in 2017 will depend on implementation of the outcome of the Brexit referendum. Markets will have ample fodder for speculation, from the formal initiation of the process pulling the UK out of the European Union and the subsequent negotiation to the indirect influence of uncertainty on the economy.
Prime Minister Theresa May wants to trigger Article 50 of the Lisbon Treaty that starts the clock on an EU withdrawal by the end of the first quarter. Before that happens, the UK Supreme Court will issue a ruling – due by the end of January – determining whether Parliament has to rubber-stamp the move.
This step is a major inflection point. If formal legislation has to be drawn up and passed, the process may become delayed well past Ms May’s deadline. In fact, it is conceivable that if Brexit gets stuck in the mostly pro-Remain legislature, the matter will have to be sorted with a new election (though this seems remote).
The markets will probably spend the first three months of the year trying to divine what all of this will look like. Against this backdrop, the UK economy will likely start to show the impact of post-referendum uncertainty. This will overlay the political aspects of the situation with speculation about the direction of Bank of England policy.
The UK has fared better than most expected after the referendum delivered victory to the Leave campaign. A deep slump in economic activity immediately after the vote swiftly gave way to recovery. PMI survey data suggests growth was churning at the fastest pace in 10 months heading into December 2016.
It was always going to take time to see the impact of the vote however. Businesses cannot adjust output and staffing levels instantly. Contract obligations take time to work through and renegotiate so it makes sense that it takes months for firms’ concerns about Brexit-inspired changes to filter into on-the-ground economic behavior.
Early evidence seems to suggest the negativity is starting to emerge. UK economic news-flow has steadily deteriorated relative to consensus forecasts since early October (according to data from Citigroup), suggesting analysts’ models are proving to be rosier than actual conditions are warranting.
At this stage, investors seem to be trying to game how much inflation has to overshoot the BOE’s target for the central bank to dial down stimulus. If recent UK data proves to have foreshadowed a slump, speculation will instead be focused on how likely it is that Mark Carney and company will have to ease conditions further.
A messier path toward formally activating Brexit – especially one that prolongs the process beyond the Prime Minister’s deadline – is likely to amplify the cooling effects of uncertainty on the economy. This bodes decidedly ill for the British Pound against currencies with a more forgiving policy backdrop, most notably the US Dollar.
Sterling may fare better in instances where Brexit’s negative knock-on effects are at least as pronounced as in the UK but still underrepresented in asset prices. This is most obviously evident in EUR/GBP, which soared after the referendum despite the likelihood that its chilling effect will apply on both sides of the English Channel.
Performance against the Yen may be decided outside UK borders. If US fiscal policy is as expansionary as markets have suspected after the presidential election, rising US yields will echo into funding costs worldwide, stoking carry trade demand. This weigh on the Japanese unit against all of the G10 FX majors, including the Pound.
Technicals: GBPUSD Pushing Extremes
GBPUSD Quarterly
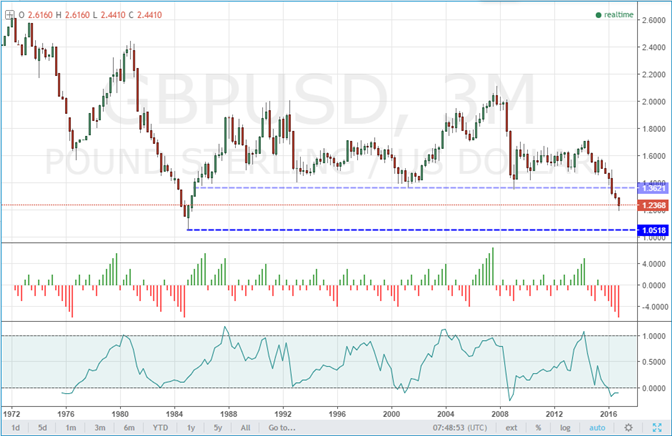
GBPUSDQuarterly (3M) Chart - Created by John Kicklighter, Chief Strategist with Trading View Charts on DailyFX.com
Heading into the fourth quarter, I had highlighted the GBP/USD range between 1.2800 and 1.3600. The prevailing trend was certainly bearish, but further extending the already-extreme move would require increasingly exceptional conviction. An unexpected Pound flash crash in early October and a renewed Dollar rally after US Presidential election however, struck the correct cord. The question heading into 2017 is whether we can keep stretching the Cable further and further. Looking at the quarterly chart of the pair, we can see how statistically difficult that would be. We need to look at a chart with this scale of historical context to appreciate the fact that we are at a three-decade low. Beyond that, we find that GBP/USD has dropped for six consecutive quarters – only the third time this has occurred and each previous instance marked a significant turning point. Furthermore, this drive represents a decline that is more than two-standard deviations below the 20-quarter (5-year) average.
GBPUSD Daily

GBPUSDDaily Chart - Created by John Kicklighter, Chief Strategist with Trading View Charts on DailyFX.com
On a more manageable scale, the Daily chart of the last three quarters show the more immediate technical levels that will act as milestones through the opening three months of the new year. To the downside, the ‘flash crash’ low around 1.1900 is the absolute stretch before fresh multi-decade lows will transition the importance to momentum rather than specific levels. The upside is far better framed. The 1.2800 low through the third quarter of 2016 is the first barrier with the 1.3500 post-Brexit break representing the far more substantial resistance.
Equal-Weighted Pound IndexDaily
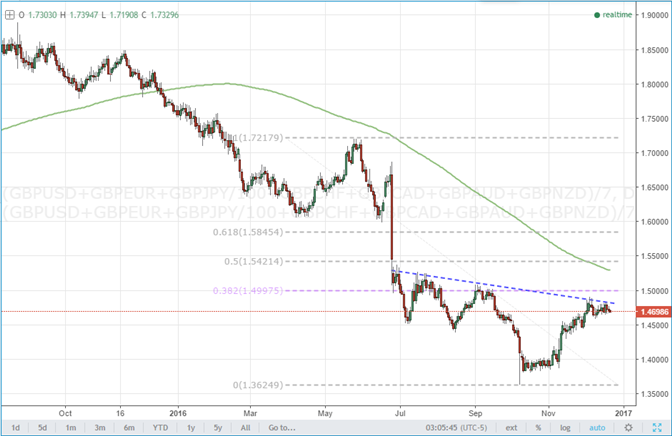
Pound Equal Weight IndexDaily Chart - Created by John Kicklighter, Chief Strategist with Trading View Charts on DailyFX.com
When looking to the GBP/USD, it is important to account for the fact that the Dollar will play a distorting roll as to where the market is heading. However, it is worth looking at the Pound in relief to get a technical bearing. Above is an equal-weighted index of the seven most liquid Sterling-based crosses (including GBP/USD). This drive has afforded equivalently extreme lows, but the drive has been surprisingly more consistent. After an extended, tight consolidation in October and November of this past year, an effort to turn the tide was made. Breaking 1.5000 on this synthetic would be an important milestone with the 100-day moving average as a second cue to a more robust reversal.



Comments
Log in or sign up to join the conversation.