
What a difference a week can make, eh? One minute traders are freaking out (as in the 603 point dive registered by the DJIA on Friday, January 31st) over the potential impact of the Coronavirus on the global economy. And the next week, the major stock market indices are hitting new highs. Makes perfect sense, right?
No, the spread of the Coronavirus did not suddenly slow. Yes, it appears the virus will indeed impact China's economy. But there were several other developments this past week that caused folks to look on the bright side. Whether or not the good news will be enough to generate a sustainable leg higher from here is anybody's guess. However, I believe it is important to understand why Ms. Market is acting the way she is.
Global Green Shoots
The first part of the rally formula appears to be confirmation that the global economy is improving (or, at the very least, has stopped declining). Exhibit A in this argument comes from Ned Davis Research, who informed us last week that the Global Manufacturing PMI rose again in January, which represented a third straight monthly increase. NDR's Alejandra Grindal says their work, "found that the global manufacturing PMI tends to bottom a median of four months before the end of global economic slowdowns. Now that we're six months away from the low, history suggests a confirmed recovery."
Ms. Grindal also reported, "the share of individual-country PMIs in expansion territory (i.e., above 50) rose to 53%, an eight-month high. Our calculation of monthly breadth jumped to 65%, indicating that nearly two-thirds of countries saw their PMIs rise month to month, the most since November 2016."
So, while the Coronavirus will likely impact on China's economy, the reports I've read suggest that (a) the downturn will be temporary and (b) economic activity will rebound once the virus is contained. And with the global economy showing improvement, I can understand while macro-oriented investors may be looking on the bright side.
Don't Fight The Central Bankers
If traders learned anything since the US Financial Crisis in 2008 and ensuing European Banking Crises in the early 2010s, it was that when central bankers are trying to stimulate their economies, you buy risk assets. So, when news hit that China is talking about stimulative measures, well, traders knew which buttons to push.
U.S. Data B.T.E.
By now everybody on the planet knows that the U.S. manufacturing sector is hurting. While the administration's tax cuts helped the economy reach escape velocity, my view is the nearly 2-year trade war and the accompanying uncertainty had the opposite effect. The net result has been a weak manufacturing sector and a meaningful slowdown in GDP. In other words, I feel the administration shot itself in the economic foot.
However, the U.S. consumer never faltered through the trade spats and as such, the U.S. economy has been able to keep on keepin' on. We got some good news on this front last week as the ISM Non-Manufacturing (i.e. the Services sector) report came in better than expected. The composite was reported at 55.5 which was above expectations and a five-month high.
Then Came The Job Numbers
Sticking with the theme of strong U.S. data, you are likely aware that both the ADP and BLS Jobs reports beat the pants off consensus expectations.
First up, ADP reported that private-sector jobs surged by 291,000 in January. This was nearly double the expectations for 150,000 and the biggest gain seen since May 2015.
Next up, the BLS reported that Nonfarm Payrolls in the U.S. grew by 225,000 in January, which was well above the expectations for 158,000. In addition, the totals for the prior two months were also revised higher. A big part of the jobs story here is that the labor force swelled by 574,000, which pushed the participation rate to the highest rate since June 2013 and the Prime-age participation rate to the best reading since September 2008.
Wait, Tariffs Can Go Down?
Another contributing factor to last week's surprise joyride to the upside was Thursday's report that China will cut retaliatory tariffs on $75 billion of U.S. goods in half. This gave investors hope that the negativity from the trade war with China might be behind us for good, sending the S&P 500 to new all-time highs in the process.
Then The News Went The Other Way
However, the happy vibe on Wall Street took a hit on Friday as the news flow went the other way. First, we got disappointing economic data out of Europe. Next, there was word that JPMorgan had dropped their numbers on China's GDP. There were more negative headlines on the virus. And finally, there was the idea that Friday's strong jobs report would put the kibosh on the potential for further Fed rate cuts.
From my seat, that last item seems kinda silly. In a report released Friday, the Fed suggested that things were looking up. The report stated, "Downside risks to the U.S. outlook seem to have receded in the latter part of the year, as the conflicts over trade policy diminished somewhat, economic growth abroad showed signs of stabilizing, and financial conditions eased."
The Fed also wrote that the U.S. job market and consumer spending remained strong, and "the likelihood of a recession occurring over the next year has fallen noticeably in recent months."
In sum, the Fed said that risks to the U.S. recovery seemed to be easing following the recent rate cuts and evidence that a worldwide dip in trade and manufacturing "appears to be at an end."
Sifting through the Fedspeak here, Friday's report seems to indicate that the Fed has no intention - nor any justification - for cutting rates any further.
Where To From Here?
So, let's review. A week ago, stocks were oversold, and some fear was starting to creep in. The question at the end of January was, how low would the market go during the current pullback/correction/sloppy phase? One week later, stocks are now overbought again and the major indices are one day removed from fresh all-time highs. Thus, from my perch, the question now appears to be, will the bulls be able to break on through to the other side and begin a new leg higher? Or will investors get a reality check and be stuck with a range-bound market for a spell?
While I don't manage money based on my views, predictions, or gut hunches, my gun-to-the-head take is the appropriate trading strategy here is to "ride the range." In other words, unless/until the bulls can produce a confirmed breakout, selling the rips and buying the dips would seem to be the best way to play here.
However, this approach is for traders only. For longer-term investors looking to stay in tune with the market's primary trend, the game plan hasn't changed. In short, our indicators suggest that investors should stay seated on the bull train and use corrections/pullbacks/sloppy periods to add to positions.
Weekly Market Model Review
Since it's the start of a new week, it's now time to put aside my subjective view of the action and to review the "state" of our indicator boards. Each week we do a disciplined, deep dive into our key market indicators and models. The overall goal of this exercise is to (a) remove emotion from the investment process, (b) stay "in tune" with the primary market cycles, and (c) remain cognizant of the risk/reward environment.
The Major Market Models
We start with six of our favorite long-term market models. These models are designed to help determine the "state" of the overall market.
There are a couple of changes to report on the Primary Cycle board this week. Both the Leading Indicators and Desert Island Model downticked to neutral from positive, albeit by slim margins. As such, it is important to note that conditions are not as strong as they were at the beginning of the year. The good news is that we are starting to see some improvement in the economic indicators, which would go a long way in restoring the market's overall health. At this stage, I believe the board continues to suggest that the bulls should be given the benefit of the doubt.

* Source: Ned Davis Research (NDR) as of the date of publication. Historical returns are hypothetical average annual performances calculated by NDR. Past performances do not guarantee future results or profitability - NOT INDIVIDUAL INVESTMENT ADVICE.
The State of the Fundamental Backdrop
Next, we review the market's fundamental factors in the areas of interest rates, the economy, inflation, and valuations.
The Fundamental Factors board is unchanged again this week. With only one negative component - valuation, which historically has been a simply awful timing indicator - I continue to believe the board remains moderately positive. And since the hypothetical average return of the S&P given the current readings of the board remains higher than the historical mean, the bulls remain in charge of the game.

* Source: Ned Davis Research (NDR) as of the date of publication. Historical returns are hypothetical average annual performances calculated by NDR. Past performances do not guarantee future results or profitability - NOT INDIVIDUAL INVESTMENT ADVICE.
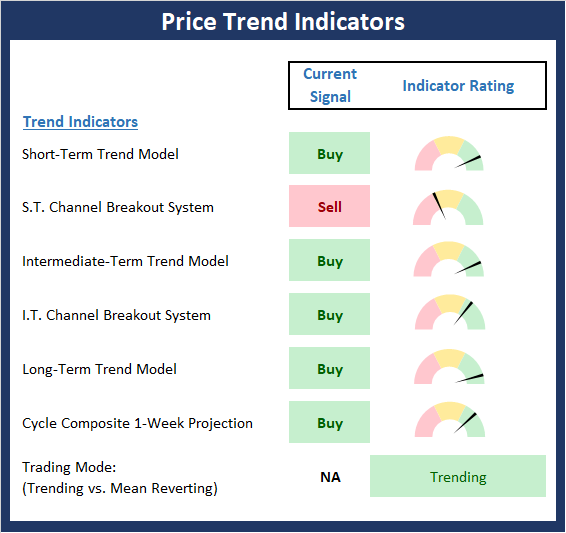
The State of the Trend
After looking at the big-picture models and the fundamental backdrop, I like to look at the state of the trend. This board of indicators is designed to tell us about the overall technical health of the current trend.
At this time last week, it looked like stocks were entrenched in a pullback/corrective phase. What a difference a week can make though as additional stimulus in places like China appears to overwhelm the fears of the Coronavirus negatively impacting global economic growth. However, with stocks once again overbought from a near-term perspective, I can't help but think that we may not have heard the end of the growth concerns. We shall see.
* Source: Ned Davis Research (NDR) as of the date of publication. Historical returns are hypothetical average annual performances calculated by NDR. Past performances do not guarantee future results or profitability - NOT INDIVIDUAL INVESTMENT ADVICE.
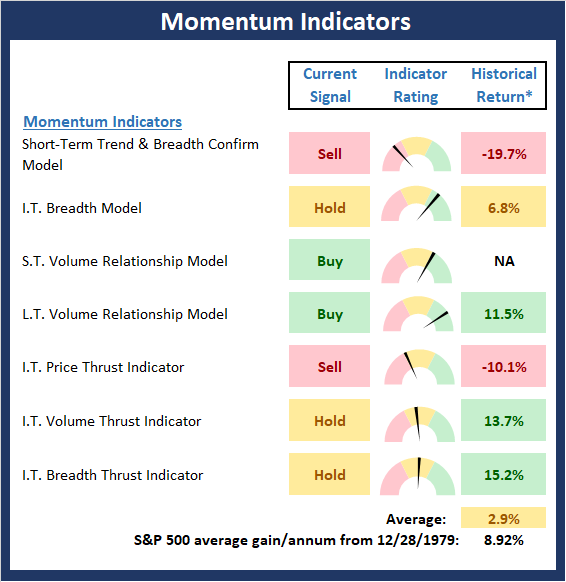
The State of Internal Momentum
Next, we analyze the "oomph" behind the current trend via our group of market momentum indicators/models.
The Momentum board improved a bit this week as both our volume and breadth thrust indicators managed to move up and out of the red zone. However, with a breakout looking a bit iffy and the status of the Momentum board not exactly strong, I think the jury is still out on whether the bulls will be able to power higher from here. I'm not saying it can't happen, I'm simply stating that there isn't a lot of "mo" at this point in time.
* Source: Ned Davis Research (NDR) as of the date of publication. Historical returns are hypothetical average annual performances calculated by NDR. Past performances do not guarantee future results or profitability - NOT INDIVIDUAL INVESTMENT ADVICE.
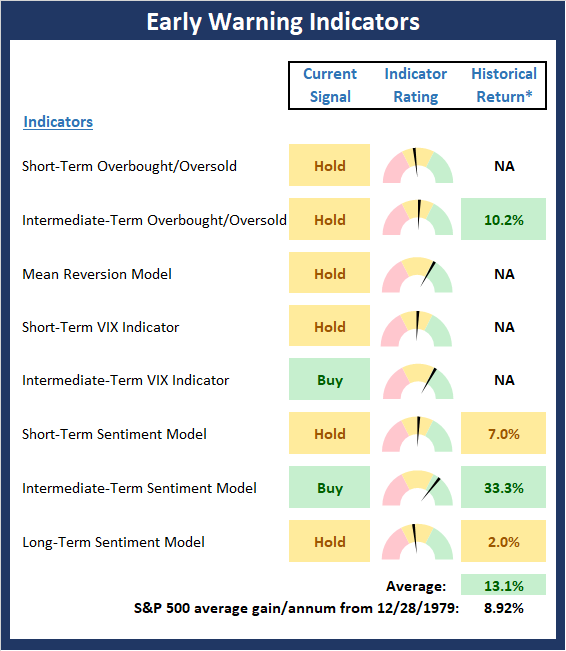
Early Warning Signals
Once we have identified the current environment, the state of the trend, and the degree of momentum behind the move, we then review the potential for a counter-trend move to begin. This batch of indicators is designed to suggest when the table is set for the trend to "go the other way".
Last week, I opined that the Early Warning board told traders to get ready to buy. While I didn't really expect for stocks to turn on a dime, I can say that the Early Warning board once again did a nice job of alerting us of the potential for traders to "go the other way." Currently, the board is largely neutral. However, I will note that some of our shorter-term indicators are very close to flashing sell signals. The bottom line is neither team has the Early Warning wind at their back here. As such, it's "game on" for control of the game here.
* Source: Ned Davis Research (NDR) as of the date of publication. Historical returns are hypothetical average annual performances calculated by NDR. Past performances do not guarantee future results or profitability - NOT INDIVIDUAL INVESTMENT ADVICE.


Comments
Log in or sign up to join the conversation.