

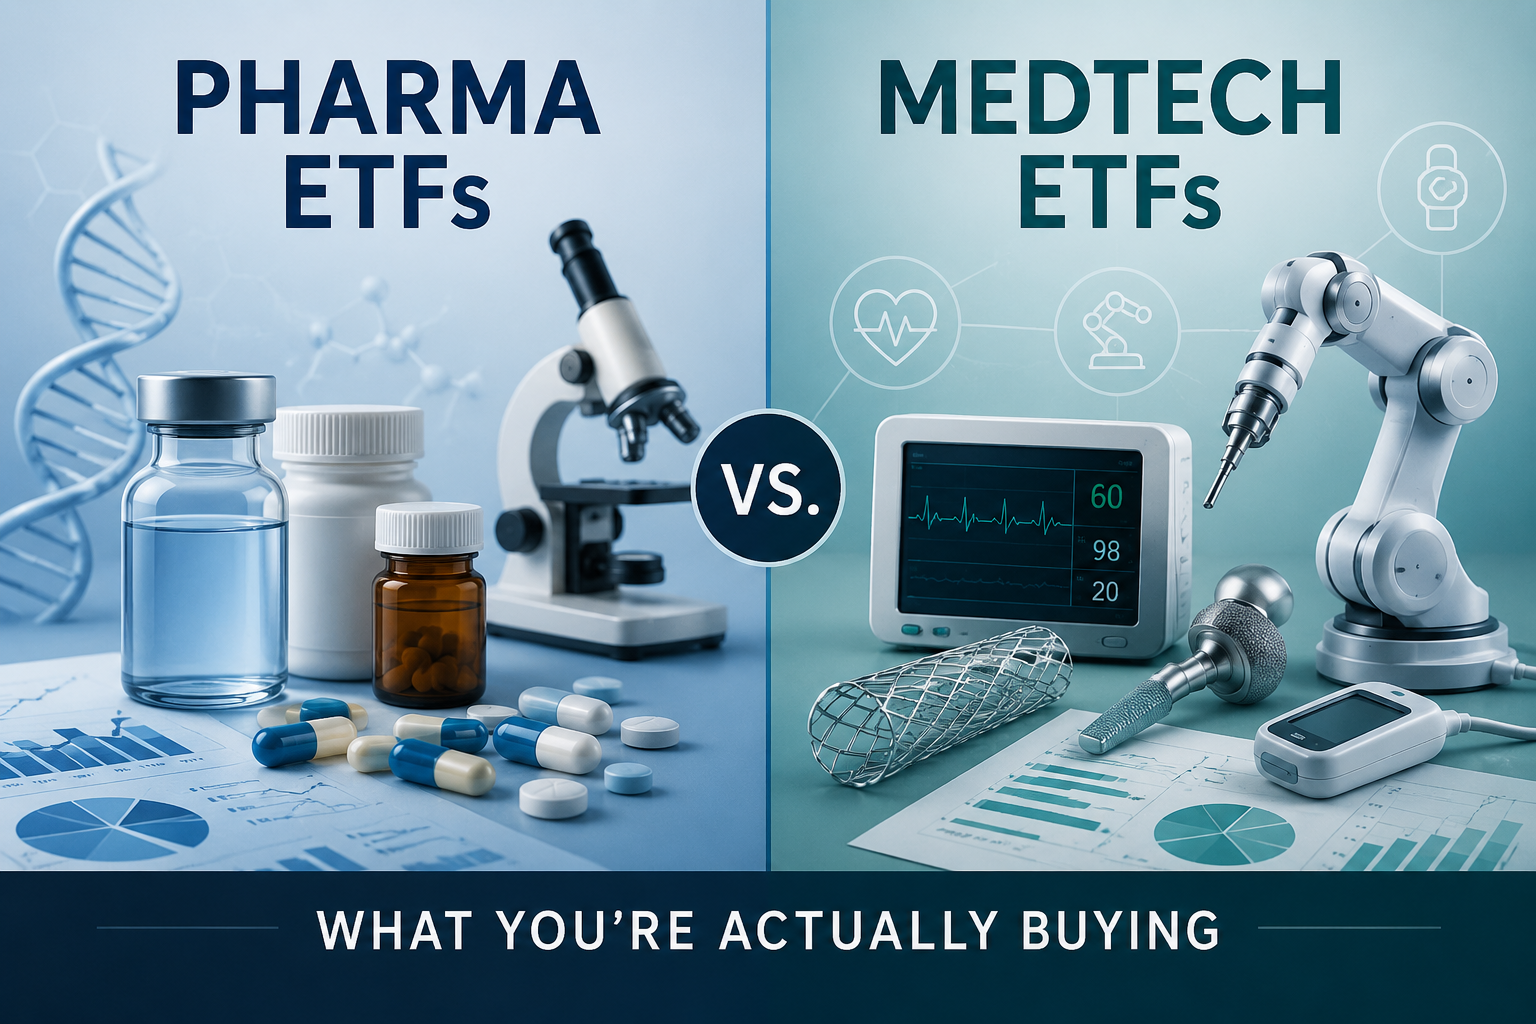
The medtech ETF beat the pharma ETF over the last decade — not because medtech won, but because two stocks inside it did
Key Takeaways
● The S&P 500 beat both IHI and IHE at every single time horizon measured — 1, 3, 5, and 10 years — with no exception.
● IHI (medtech) beat IHE (pharma) over 10 years — 12.58% vs. 4.18% annualized — despite medtech's structurally lower margins across the industry.
● That result comes almost entirely from two holdings: Abbott and Intuitive Surgical are roughly a third of IHI's assets, and both are the moat exceptions this series has already identified.
● Over 1, 3, and 5 years, pharma (IHE) has actually outperformed medtech (IHI) — the 10-year number is the outlier.
● For most retail investors, a broad total market fund beat every option in this article's tables — a sector ETF is a concentrated bet on healthcare outperforming, holding far fewer companies than the S&P 500.
The Options
Five funds cover the ground between pure pharma and pure medtech exposure, and they differ a lot more than their category labels suggest.
ETF | Focus | Expense Ratio | Concentration |
IHI | Pure-play U.S. medical devices | 0.38% | 51 holdings; top 10 = 74% of assets |
IHE | U.S. pharmaceuticals, cap-weighted | ~0.39% | Concentrated in mega-caps |
U.S. pharmaceuticals, equal-weighted | 0.35% | 65 holdings, more mid/small-cap exposure | |
Broad healthcare (S&P 500 healthcare) | ~0.09-0.10% | Includes insurers and providers alongside pharma/medtech | |
Broad healthcare, Vanguard | ~0.10% | 400+ holdings, cheapest broad option |
The Performance Numbers
Here's how each fund actually performed, checked against every time horizon that matters, not just whichever one tells the best story.
Period | IHI (Medtech) | IHE (Pharma) | S&P 500 (benchmark) |
1-year | -4.35% | +2.39% | +17.14% |
3-year (annualized) | 4.07% | 7.38% | 24.73% |
5-year (annualized) | 1.95% | 6.71% | 15.60% |
10-year (annualized) | 12.58% | 4.18% | 14.58% |
15-year (annualized) | 12.90% | 10.80% | 14.31% |
Table: IHI vs. IHE total returns across time horizons.
Notice the pattern: pharma wins every window except the 10-year one. That reversal is worth understanding before treating either number as "the" answer. But look at the benchmark column too — the S&P 500 beat both IHI and IHE at every single horizon measured, 1 through 15 years, with no exception. Neither healthcare sub-sector actually won over any of these periods; the broad market did. And the IHI-vs-IHE gap itself is fragile: at 10 years medtech leads by 8.4 points, but stretch to 15 years and that gap shrinks to just 2.1 points — the "medtech wins long-term" story mostly depends on which decade you pick.
Why IHI Actually Won the 10-Year Number
IHI looks diversified on paper — 51 holdings. Look at where the actual weight sits, and a very different picture shows up.
Holding | % of IHI | What It Is |
Abbott Laboratories | ~17% | The cardiovascular/switching-cost moat exception from this series — 33.7% device-segment margin vs. 18.2% company average |
Intuitive Surgical | ~15-16% | The surgeon-training-lock-in moat exception — roughly 475% total return over 10 years (19.11% annualized) |
~20% | Rounding out just over half the fund in four names |
Table: Just four holdings make up more than half of IHI.
Put side by side, the gap between the story this fund tells and what's actually driving its return is stark.
| The Headline | The Reality |
IHI's 10-year win | "Medtech beat pharma over 10 years" | Two stocks — Abbott and Intuitive Surgical — are precisely the moat exceptions this series identified |
The rest of the fund | Diversified medtech exposure | Boston Scientific down ~30% since March 2026 on guidance cuts, GE HealthCare (GEHC) struggling, Medtronic (MDT) growing single digits — the commodity-economics story this series has told all along |
The clearest way to prove the concentration point is to compare the fund directly against the two stocks actually driving it.
Period | Intuitive Surgical (ISRG) | Abbott (ABT) | IHI (the fund) | S&P 500 |
1-year | -21.95% | +8.12% | -4.35% | +17.14% |
3-year (annualized) | 9.42% | 4.87% | 4.07% | 24.73% |
5-year (annualized) | 8.03% | 3.85% | 1.95% | 15.60% |
10-year (annualized) | 19.11% | 13.72% | 12.58% | 14.58% |
15-year (annualized) | 17.12% | 14.66% | 12.90% | 14.31% |
This is the concentration point made concrete. At every horizon, ISRG alone beats the IHI fund it's part of — 19.11% vs. 12.58% at 10 years, 17.12% vs. 12.90% at 15 years. The fund's other 49 holdings dilute the return of the one stock actually driving it. An investor who bought Intuitive Surgical directly, understanding why its moat was real, would have beaten the "diversified" medtech ETF built partly around owning it.
What This Means for an Actual Decision
None of the options above is universally right — it depends on what exposure you're actually trying to get.
If you want... | Consider | Why |
Pure medtech exposure, understanding what you're really buying | IHI | Real exposure, but closer to a bet on Abbott and Intuitive Surgical's moats than a diversified sector position |
Pure pharma exposure, mega-cap and steady | IHE | Cap-weighted means you're mostly buying the largest, most patent-protected names |
Pure pharma exposure, broader and more volatile | XPH | Equal-weighting picks up more mid/small-cap upside and downside |
Not to choose between the two sectors at all | XLV or VHT | Broad healthcare avoids betting on which sector's moats hold up, at a fraction of the expense ratio |
Why Medtech Won This Decade — An Honest Accounting
Before accepting any explanation for the 10-year gap, here's what actually checks out against real data, and what each finding does or doesn't prove.
What We Verified | What It Rules Out or Confirms |
Abbott and Intuitive Surgical individually compounded strongly for over a decade | Real, confirmed, and company-specific |
IHE is at least as concentrated as IHI (top 2 holdings ~44% vs. ~32%) | Rules out "pharma's moat is diluted across many holdings" as the explanation |
Pfizer (PFE) fell 50-60% from its 2021 peak as COVID vaccine revenue collapsed, sitting at real weight inside IHE | A real, verified, partial drag on IHE's return |
A pharma-focused, more growth-tilted fund (XPH) still returned only 10.49% over 5 years, similar to IHI | Rules out "just tilt toward growth-style construction" as a repeatable fix |
Table: Several individually-verified factors, no single explanation that ties them together.
The honest answer is that this decade's result doesn't reduce to one clean, generalizable reason. Multiple real, separately-verified factors contributed — two exceptional individual companies, one large pharma holding's pandemic-driven decline, a concentration structure that wasn't actually more diluted for pharma than for medtech — but no single story explains the full gap, and none of them predicts what the next decade will look like. Markets don't always resolve into a tidy narrative, and forcing one here would be less honest than saying plainly: the mechanism is unclear.
The Bottom Line
Reduced to the questions that actually matter for a decision:
Question | Answer |
Should I pick individual healthcare stocks? | Requires domain knowledge most retail investors don't have — pharma's risk is binary trial/patent-cliff outcomes; medtech's risk is quietly picking a commodity player |
Do sector ETFs solve that? | Partially — they solve the picking problem, but IHI shows they don't solve the concentration problem. A 51-holding fund can still be a bet on two companies |
Did any healthcare option beat the market? | No — a plain S&P 500 fund beat both IHI and IHE at every horizon measured, 1 through 15 years |
So why buy a sector ETF at all? | It's a concentrated bet — the S&P 500 has more holdings and less correlation risk. Only buy the sector fund if you have a specific view healthcare will outperform, or want to offset a portfolio already heavy in other sectors |
Table: Before buying a sector ETF for its trailing return, check what's actually inside it, and check what it actually beat.


Comments
Log in or sign up to join the conversation.