

...Those who are ignorant of financial history are doomed again to suffer its dreadful and costly consequences...and today’s death crosses...[as seen] in 7 major U.S. stock market indices...are stock market sell signals.
Guest post by I.M. Vronsky (Gold-Eagle.com)
A recent insightful and timely article by internationally known analyst Graham Summers galvanized my attention. Graham’s focus was using Weekly Charts to demonstrate the accurate forecasts of Bear Markets in the US. His stock sell signal is based upon the Death Cross definition where the 50-week moving average falls below the 100-week moving average. Summers’s astute analysis Stocks Were Just Staged A Dreaded Death Cross speaks for itself...;when he says "this Death Cross formation has only hit TWICE before. Both times were when major bubbles burst and stocks Crashed.”
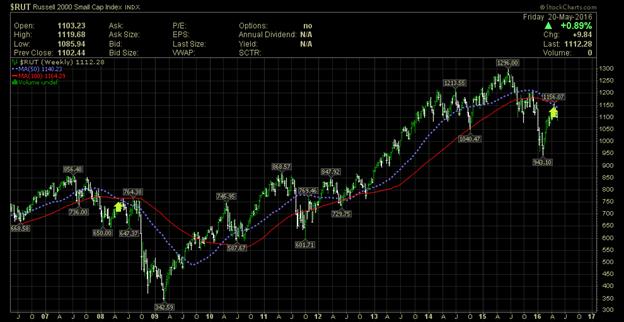
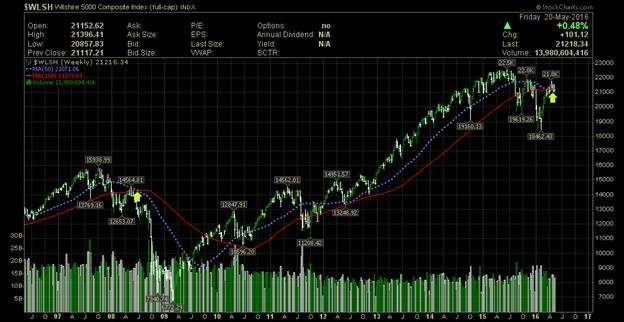
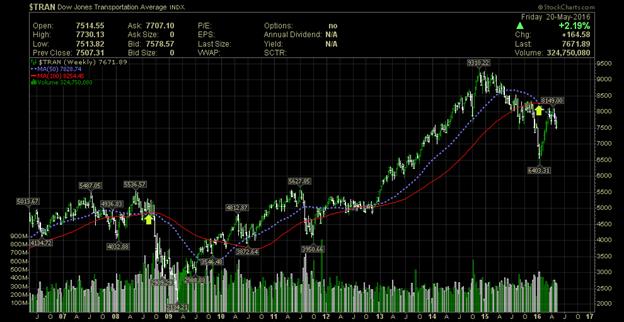
The following charts of the 7 major stock market indices show the 2008 and current death crosses as noted by the yellow arrows  . The former heralded the protracted bear market of 2007-8 when the bubble burst and stocks crashed -50%.
1. S&P500 Index

...
2. Dow Jones Index

...
3. Russell 2000 Index
...
4. Wilshire 5000 Index
...
5. Transportation Index
...
6. NYSE Index

...
7. NASDAQ Composite Index (As of 05/20/16 Death Cross still not consummated but soon will be.)

...
Stock Market Forecast For Currently Developing Bear Market
We make the assumption that US stocks will be hammered down an average of the two previous bear markets (2000-2001 and 2007-2008) subsequent to their death cross sell signals. During those periods, the S&P500 fell about –44% in the first bear market & approximately –54% in the second. Therefore, subsequent to the most recent death cross, one might see the S&P500 Index decline to about 1200 by early 2017 which would be a Fibonacci 0.61.8% retracement.
BUT THERE’S MORE!
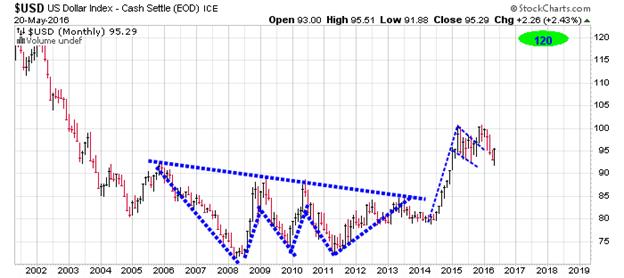
During the stock market bear markets of 2000-2002 and 2007-2008, the US dollar steadily rose in value vis-à-vis most other major currencies. Consequently, the price of gold slowing slipped lower. During the two aforementioned bear stock markets, the US$ rose an average of about +18%. Consequently, applying this increase to current conditions projects the US$ Index rising to about 120 in the next several months & perhaps even higher going forward.
...
To be sure, if history is testament, gold...could (temporarily) move lower reflecting a stronger greenback but, indubitably, this will be the last opportunity for investors to take positions in the shiny yellow at reasonable prices.


.webp)
Comments
Log in or sign up to join the conversation.