

Pepsi co Inc., Elliott Wave Technical Analysis
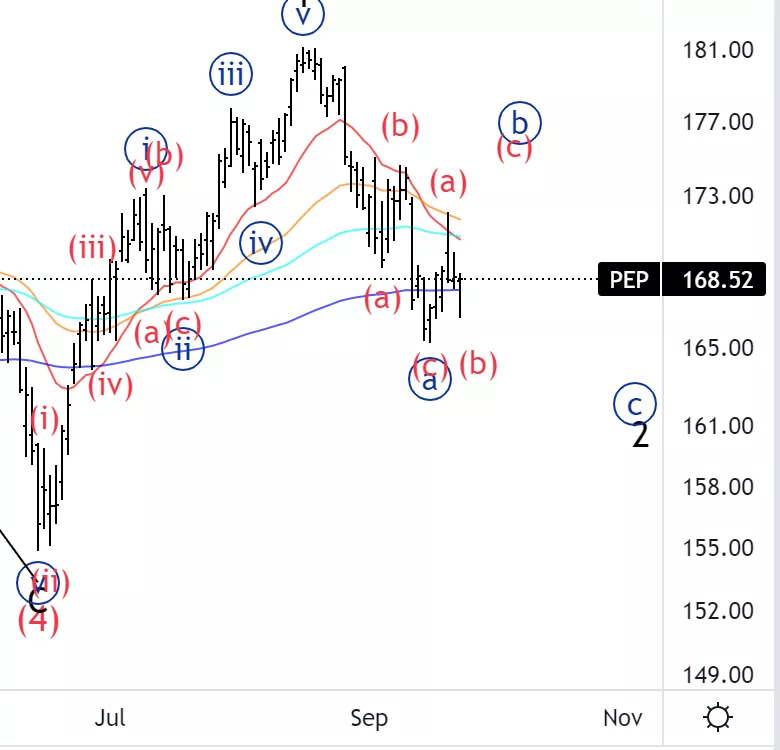
Pepsi co Inc., (PEP): Daily Chart, September 26 2022,
PEP Stock Market Analysis: It has moved as predicted from the last forecast. However as I cannot see five waves from the last move to the upside, I have reasons to believe we will get another corrective leg.
PEP Elliott Wave count: {b} of 2.
PEP Trading Strategy: Looking for short off the end of wave (c) of {b}.
PEP Technical Indicators:200EMA acting as support.
Trading Lounge Analyst: Alessio Barretta
Source: Tradinglounge.com Get Trial Here!
(Click on image to enlarge)
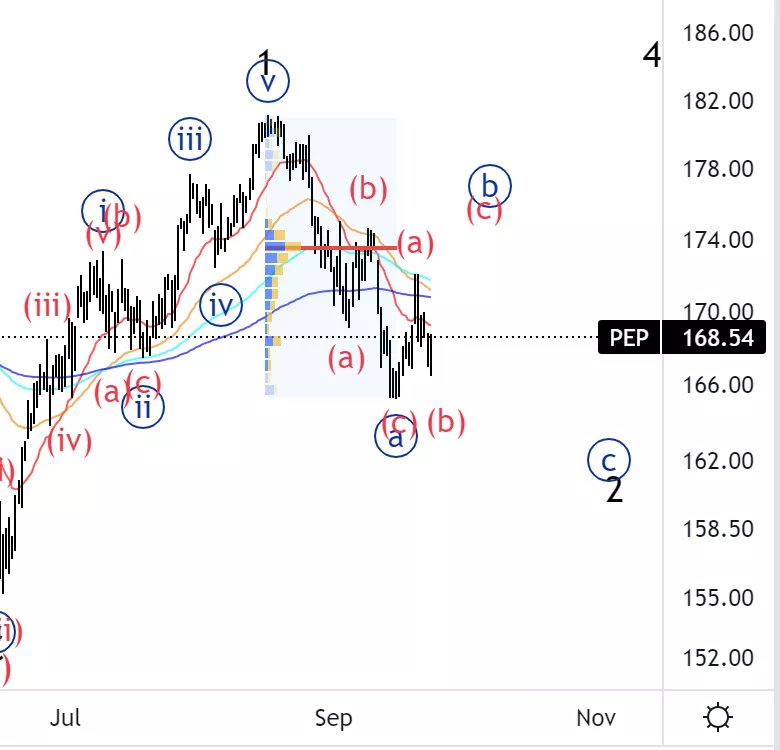
Pepsi co Inc., PEP: 4-hour Chart, September 26 2022
Pepsi co Inc., Elliott Wave Technical Analysis
PEP Stock Market Analysis: Looking for wave (c) to reach the point of control up where wave (b) of {a} is.
PEP Elliott Wave count: (b) of {b}
PEP Technical Indicators: The EMAs are crossing, which is often times a sign of reversal.
PEP Trading Strategy: Looking for a short term long to trade wave (c) of {b}.
(Click on image to enlarge)
More By This Author:
Technical Report: Elliott Wave Analysis, US Stocks
Shopify Inc.(SHOP:NYSE) Elliott Wave Technical Analysis September 23 2022
Ethereum ETHUSD Elliott Wave Technical Analysis 23 September 2022



Comments
Log in or sign up to join the conversation.