

Pepsico Inc., Elliott Wave Technical Analysis
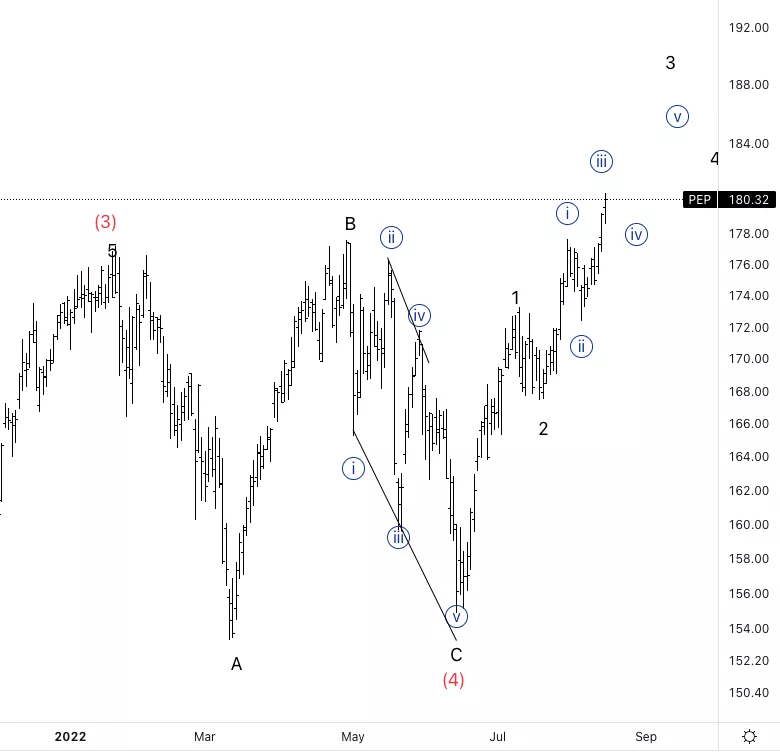
Pepsico Inc., (PEP): Daily Chart, August 17, 2022,
PEP Stock Market Analysis: Moving as expected, we are looking for extension higher as expected. We should be in wave (iii) of {iii} of 3 as expected, which should give us a vertical incline.
PEP Elliott Wave count: (iii) of {iii} of 3
PEP Trading Strategy: Build long positions on every bullish pullback with stop on the last significant low. Short term we strongly favor the upside.
PEP Technical Indicators: We are above all EMAs and there’s more room for further RSI upside.
TradingLounge Analyst: Alessio Barretta
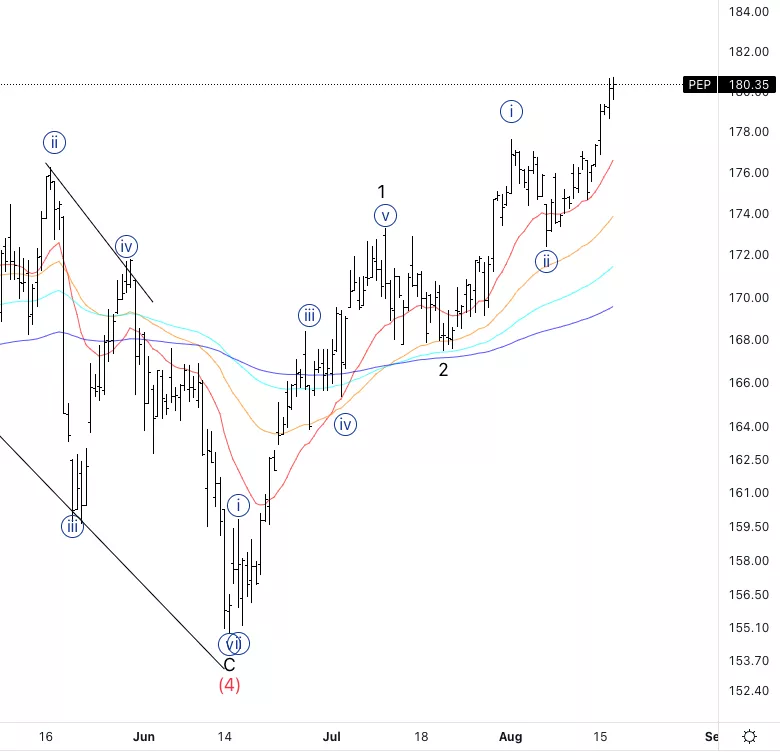
Pepsico Inc., PEP: 4-hour Chart, August 17 2022,
Pepsico Inc., Elliott Wave Technical Analysis
PEP Stock Market Analysis: Looking for wave (iv) of {iii} for a potential entry.
PEP Elliott Wave count: Wave (iii) of {iii}
PEP Technical Indicators: All technical indicators suggest bullish momentum.
PEP Trading Strategy: Looking for bounces off the 20 EMA(red line) as support.
More By This Author:
Polkadot Elliott Wave Technical Analysis - August 17, 2022
Elliott Wave Stock Market Trading: S&P 500, AAPL,AMZN, NVDA, TSLA, GOOGL
Shopify Inc. Elliott Wave Technical Analysis August 16, 2022



Comments
Log in or sign up to join the conversation.