

This morning the National Association of Realtors released the October data for their Pending Home Sales Index. Here is an excerpt from the latest press release:
Lawrence Yun, NAR chief economist, said that ten straight months of decline certainly isn’t favorable news for the housing sector. “The recent rise in mortgage rates have reduced the pool of eligible homebuyers,” he said.
Yun notes that a similar period of decline occurred during the 2013 Taper Tantrum when interest rates jumped from 3.5 percent to 4.5 percent. After 11 months – November 2013 to September 2014 – sales finally rebounded when rates decreased. “But this time, interests rates are not going down, in fact, they are probably going to increase even further,” Yun noted. (more here).
The chart below gives us a snapshot of the index since 2001. The MoM came in at -2.6%, down from a 0.7% increase last month. Investing.com had a forecast of 0.8%.
(Click on image to enlarge)
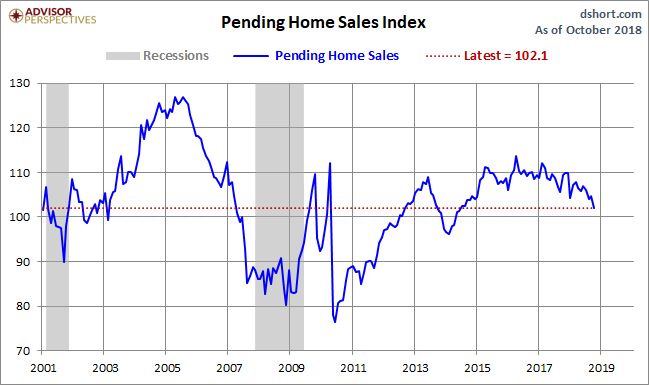
Over this time frame, the US population has grown by 15.9%. For a better look at the underlying trend, here is an overlay with the nominal index and the population-adjusted variant. The focus is pending home sales growth since 2001.
(Click on image to enlarge)
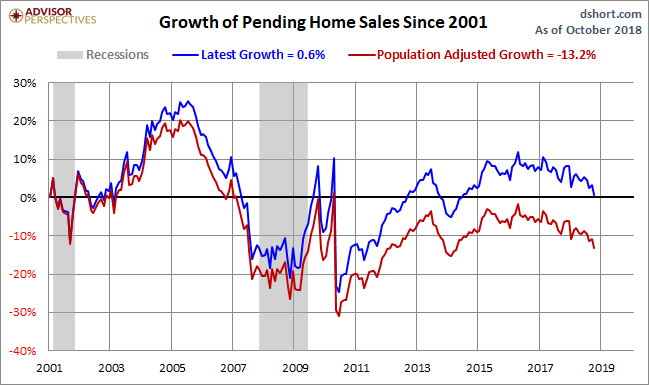
The index for the most recent month is 20% below its all-time high in 2005. The population-adjusted index is 28% off its 2005 high.
Pending versus Existing Home Sales
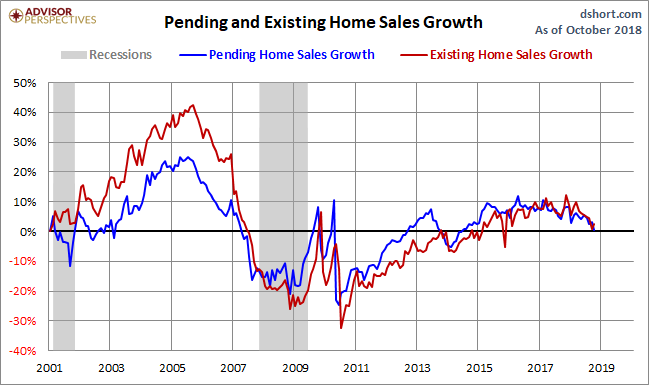
The NAR explains that "because a home goes under contract a month or two before it is sold, the Pending Home Sales Index generally leads Existing Home Sales by a month or two." Here is a growth overlay of the two series. The general correlation, as expected, is close. And a close look at the numbers supports the NAR's assessment that their pending sales series is a leading index.
(Click on image to enlarge)



Comments
Log in or sign up to join the conversation.