

Wednesday morning the National Association of Realtors released the September data for their Pending Home Sales Index. Here is an excerpt from the latest press release:
“In addition to boosting traditional home building, we should explore a greater utilization of modular factory constructed homes, converting old shopping malls or vacant office space into condominiums, permitting more accessory dwelling units, and other supply-increasing actions, in order to meet the rising demand for new housing,” Yun said. (more here)
The chart below gives us a snapshot of the index since 2001. The MoM came in at 1.3%, up from a 1.6% increase last month. Investing.com had forecast an increase of 0.9%.
(Click on image to enlarge)
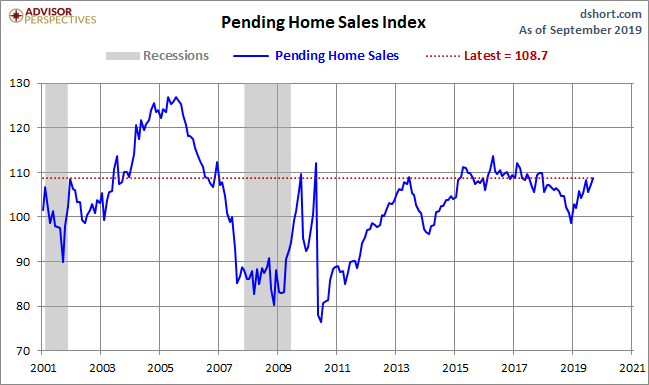
Over this time frame, the US population has grown by 16.2%. For a better look at the underlying trend, here is an overlay with the nominal index and the population-adjusted variant. The focus is pending home sales growth since 2001.
(Click on image to enlarge)
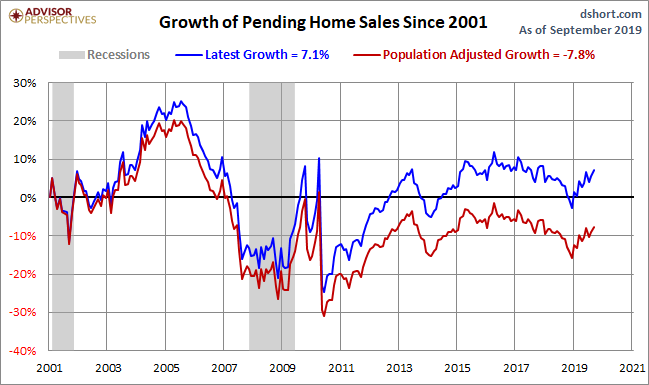
The index for the most recent month is 14% below its all-time high in 2005. The population-adjusted index is 23% off its 2005 high.
Pending versus Existing Home Sales
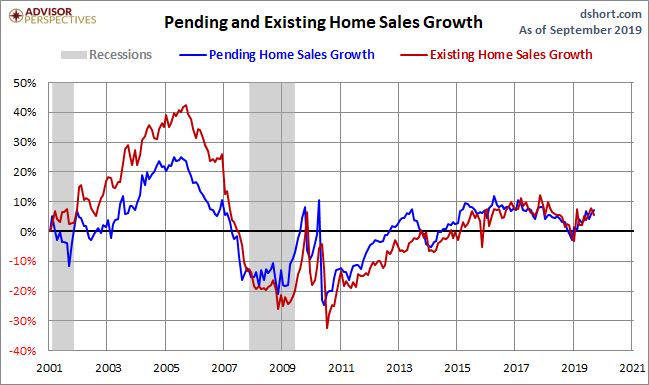
The NAR explains that "because a home goes under contract a month or two before it is sold, the Pending Home Sales Index generally leads Existing Home Sales by a month or two." Here is a growth overlay of the two series. The general correlation, as expected, is close. And a close look at the numbers supports the NAR's assessment that their pending sales series is a leading index.
(Click on image to enlarge)



Comments
Log in or sign up to join the conversation.