

This morning the National Association of Realtors released the December data for their Pending Home Sales Index. Here is an excerpt from the latest press release:
Lawrence Yun, NAR chief economist, cited several reasons for the decline in pending sales. “The stock market correction hurt consumer confidence, record high home prices cut into affordability and mortgage rates were higher in October and November for consumers signing contracts in December,” he said (more here).
The chart below gives us a snapshot of the index since 2001. The MoM came in at -2.2%, down from a 0.9% decrease last month. Investing.com had forecast an increase of 0.8%.

Over this time frame, the US population has grown by 15.9%. For a better look at the underlying trend, here is an overlay with the nominal index and the population-adjusted variant. The focus is pending home sales growth since 2001.
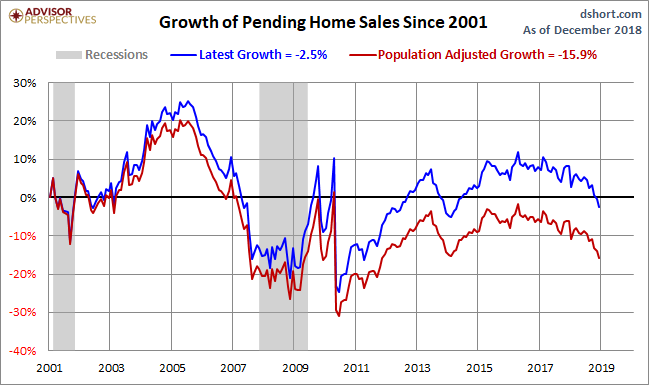
The index for the most recent month is 22% below its all-time high in 2005. The population-adjusted index is 30% off its 2005 high.
Pending versus Existing Home Sales
The NAR explains that "because a home goes under contract a month or two before it is sold, the Pending Home Sales Index generally leads Existing Home Sales by a month or two." Here is a growth overlay of the two series. The general correlation, as expected, is close. And a close look at the numbers supports the NAR's assessment that their pending sales series is a leading index.




Comments
Log in or sign up to join the conversation.