

The National Association of Realtors released the March data for their Pending Home Sales Index. According to the National Association of Realtors®, "Pending home sales dropped in March, signifying five straight months that contract activity has declined."
WASHINGTON (April 27, 2022) – Pending home sales dropped in March, signifying five straight months that contract activity has declined, according to the National Association of Realtors®. Month-over-month, only the Northeast saw an increase in contract signings, while the three other major U.S. regions experienced declines in transactions. All four regions reported decreases in year-over-year contract activity.
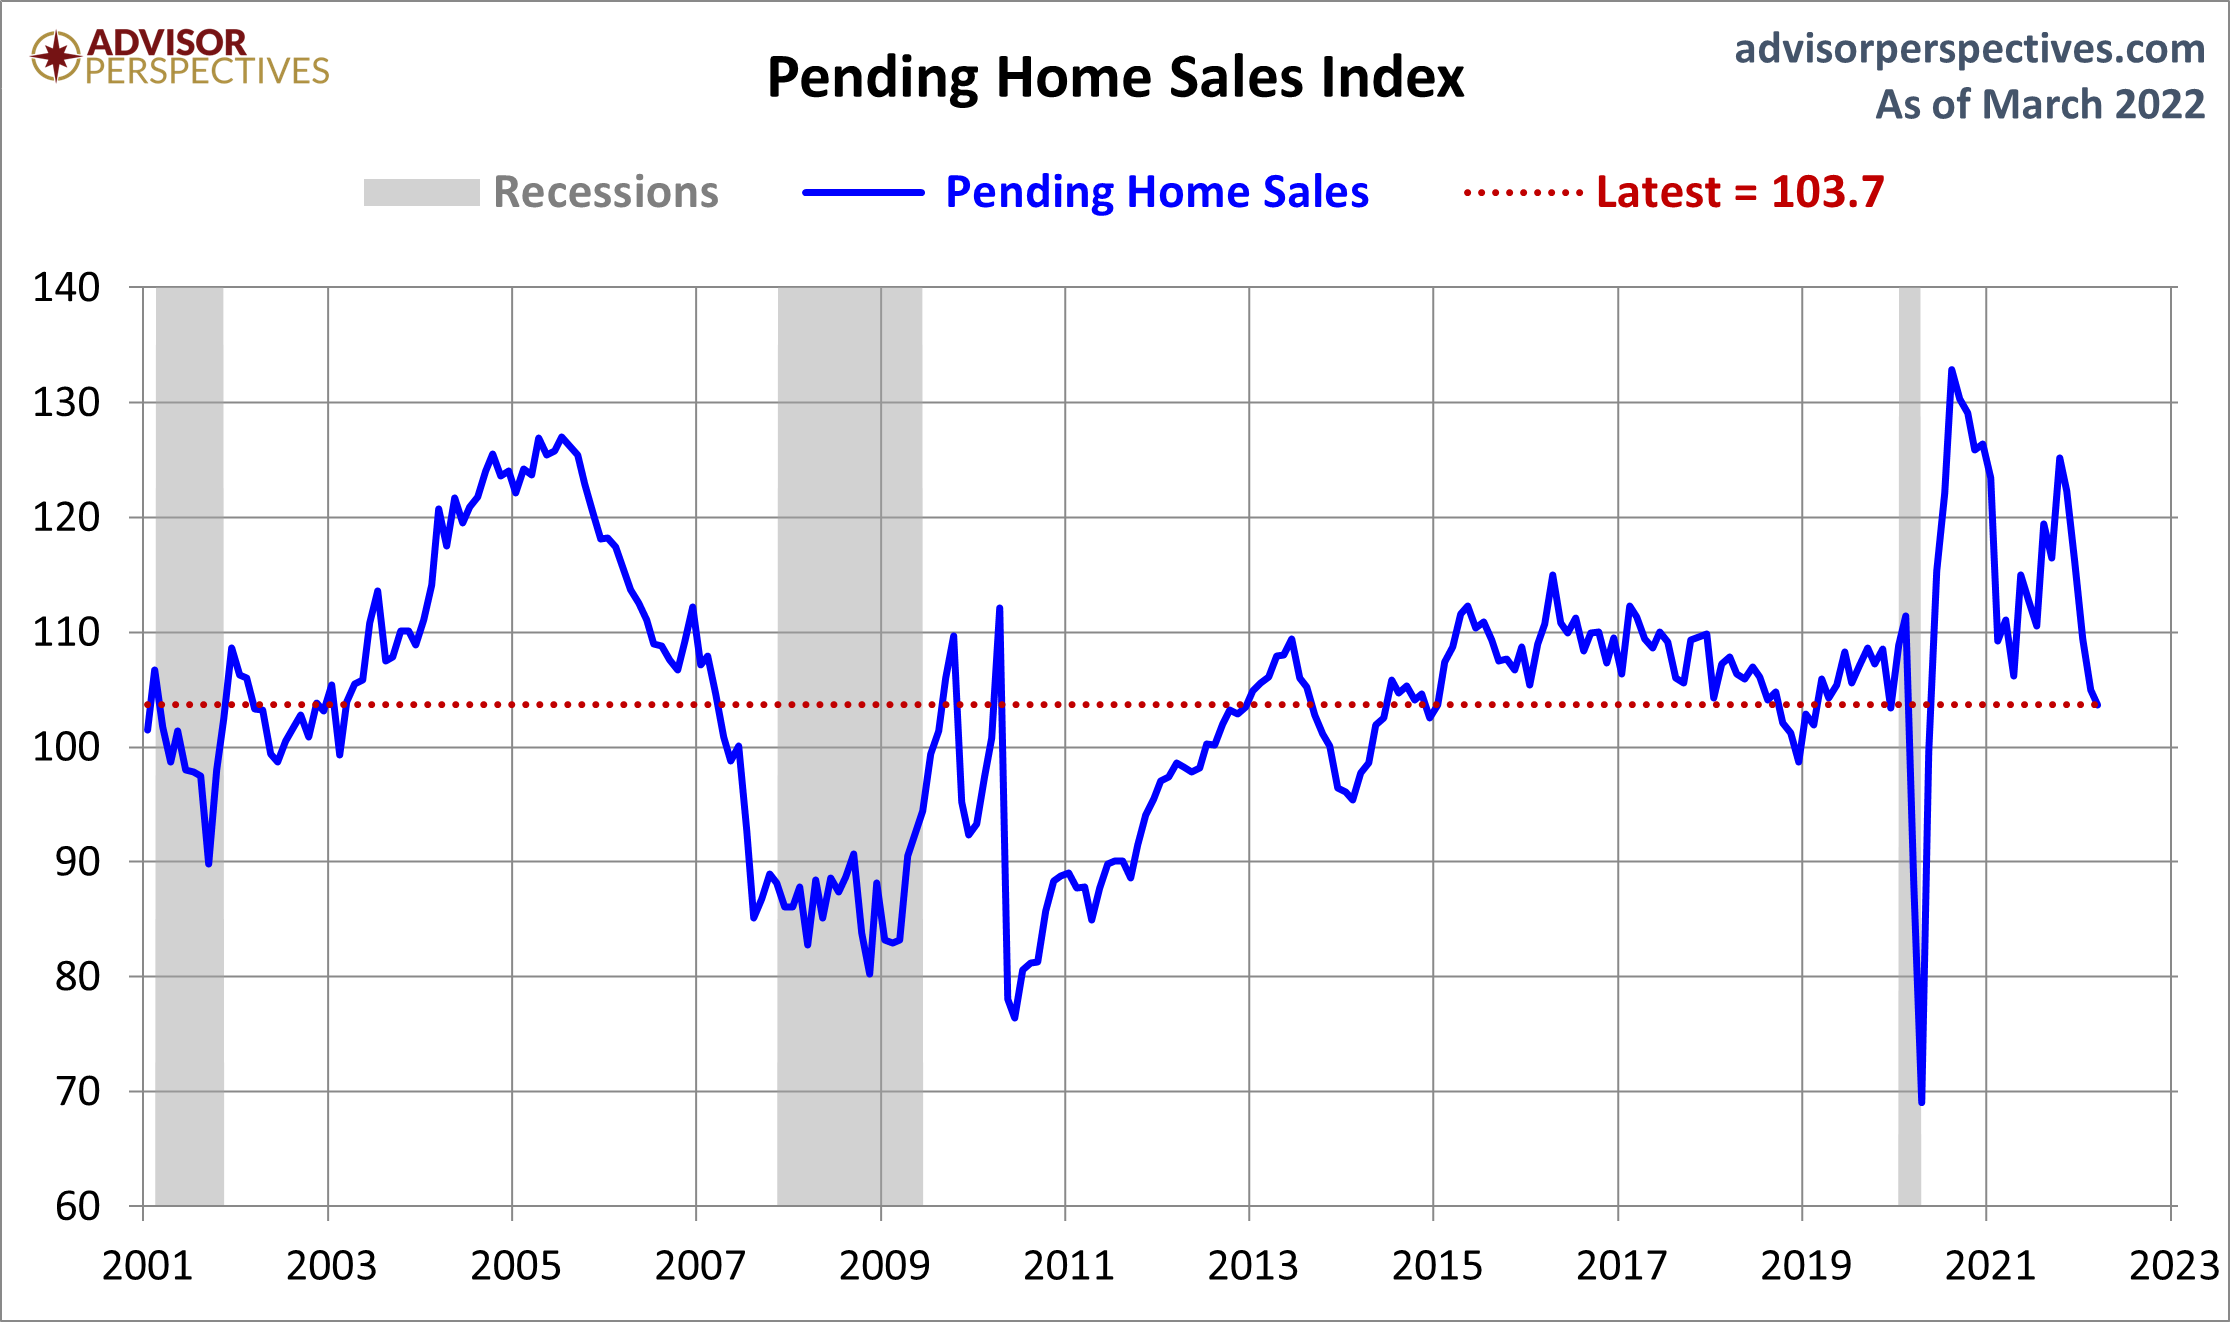
The Pending Home Sales Index (PHSI),* www.nar.realtor/pending-home-sales, a forward-looking indicator of home sales based on contract signings, fell 1.2% to 103.7 in March. Year-over-year, transactions sank 8.2%. An index of 100 is equal to the level of contract activity in 2001.
"The falling contract signings are implying that multiple offers will soon dissipate and be replaced by much calmer and normalized market conditions," said Lawrence Yun, NAR's chief economist. "As it stands, the sudden large gains in mortgage rates have reduced the pool of eligible homebuyers, and that has consequently lowered buying activity.
"The aspiration to purchase a home remains, but the financial capacity has become a major limiting factor." (more here)
The chart below gives us a snapshot of the index since 2001. The MoM came in at -1.2%, up from a 4.0% decrease last month. Investing.com had forecast a decrease of 1.6%.
(Click on image to enlarge)
Over this time frame, the US population has grown by 17.2%. For a better look at the underlying trend, here is an overlay with the nominal index and the population-adjusted variant. The focus is pending home sales growth since 2001.
(Click on image to enlarge)
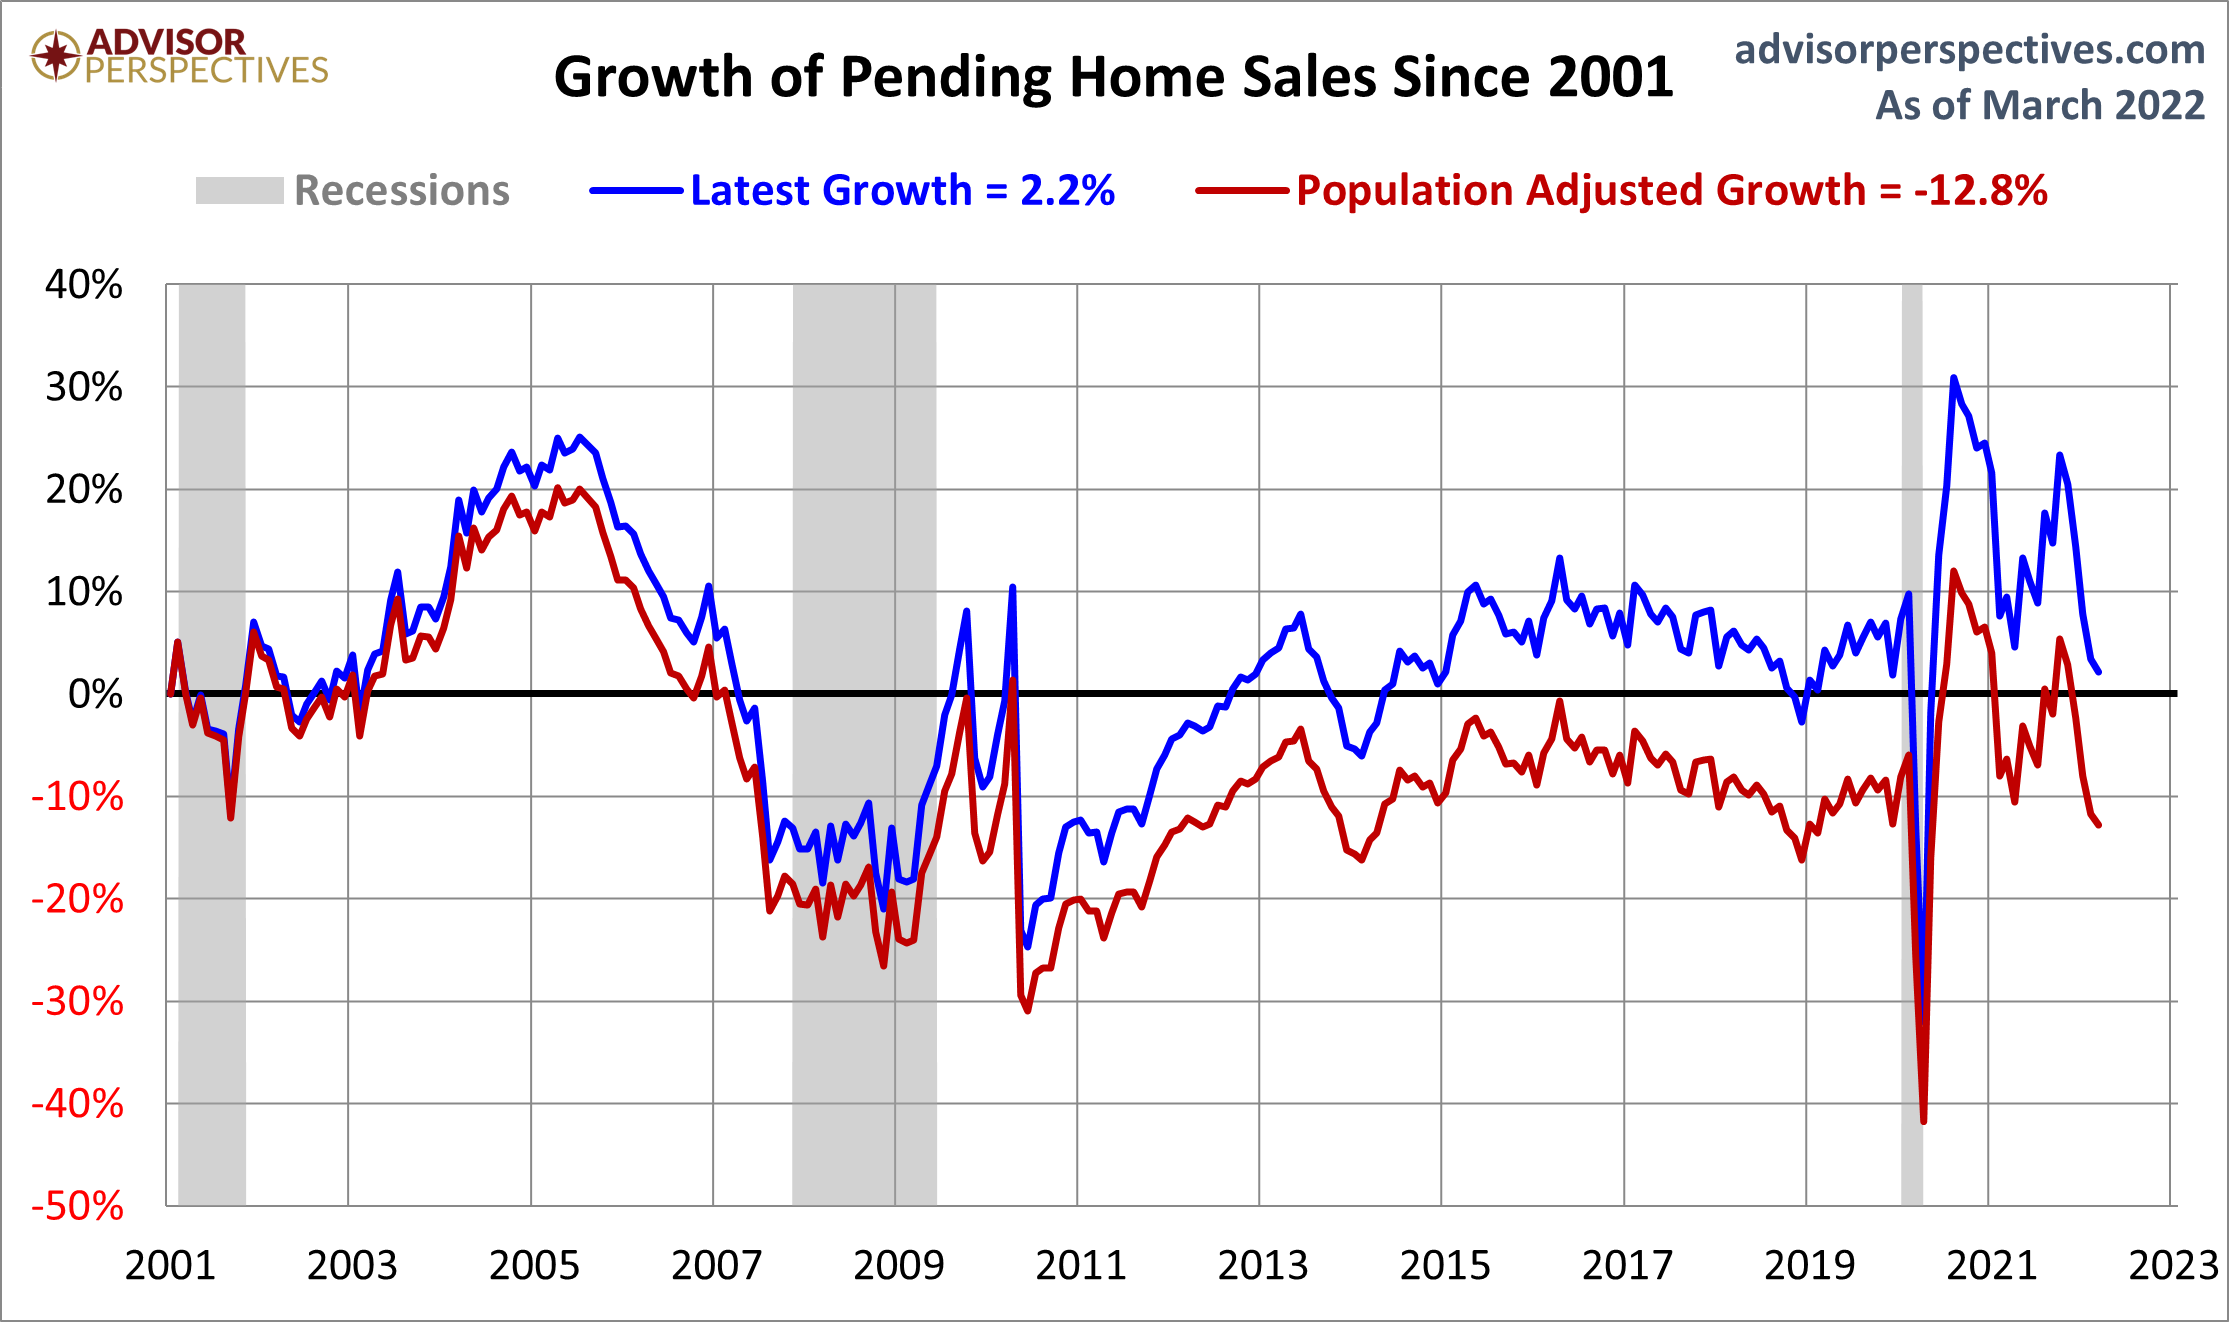
The index for the most recent month is currently 22% below its all-time high. The population-adjusted index is 27% off its high.
Pending versus Existing Home Sales
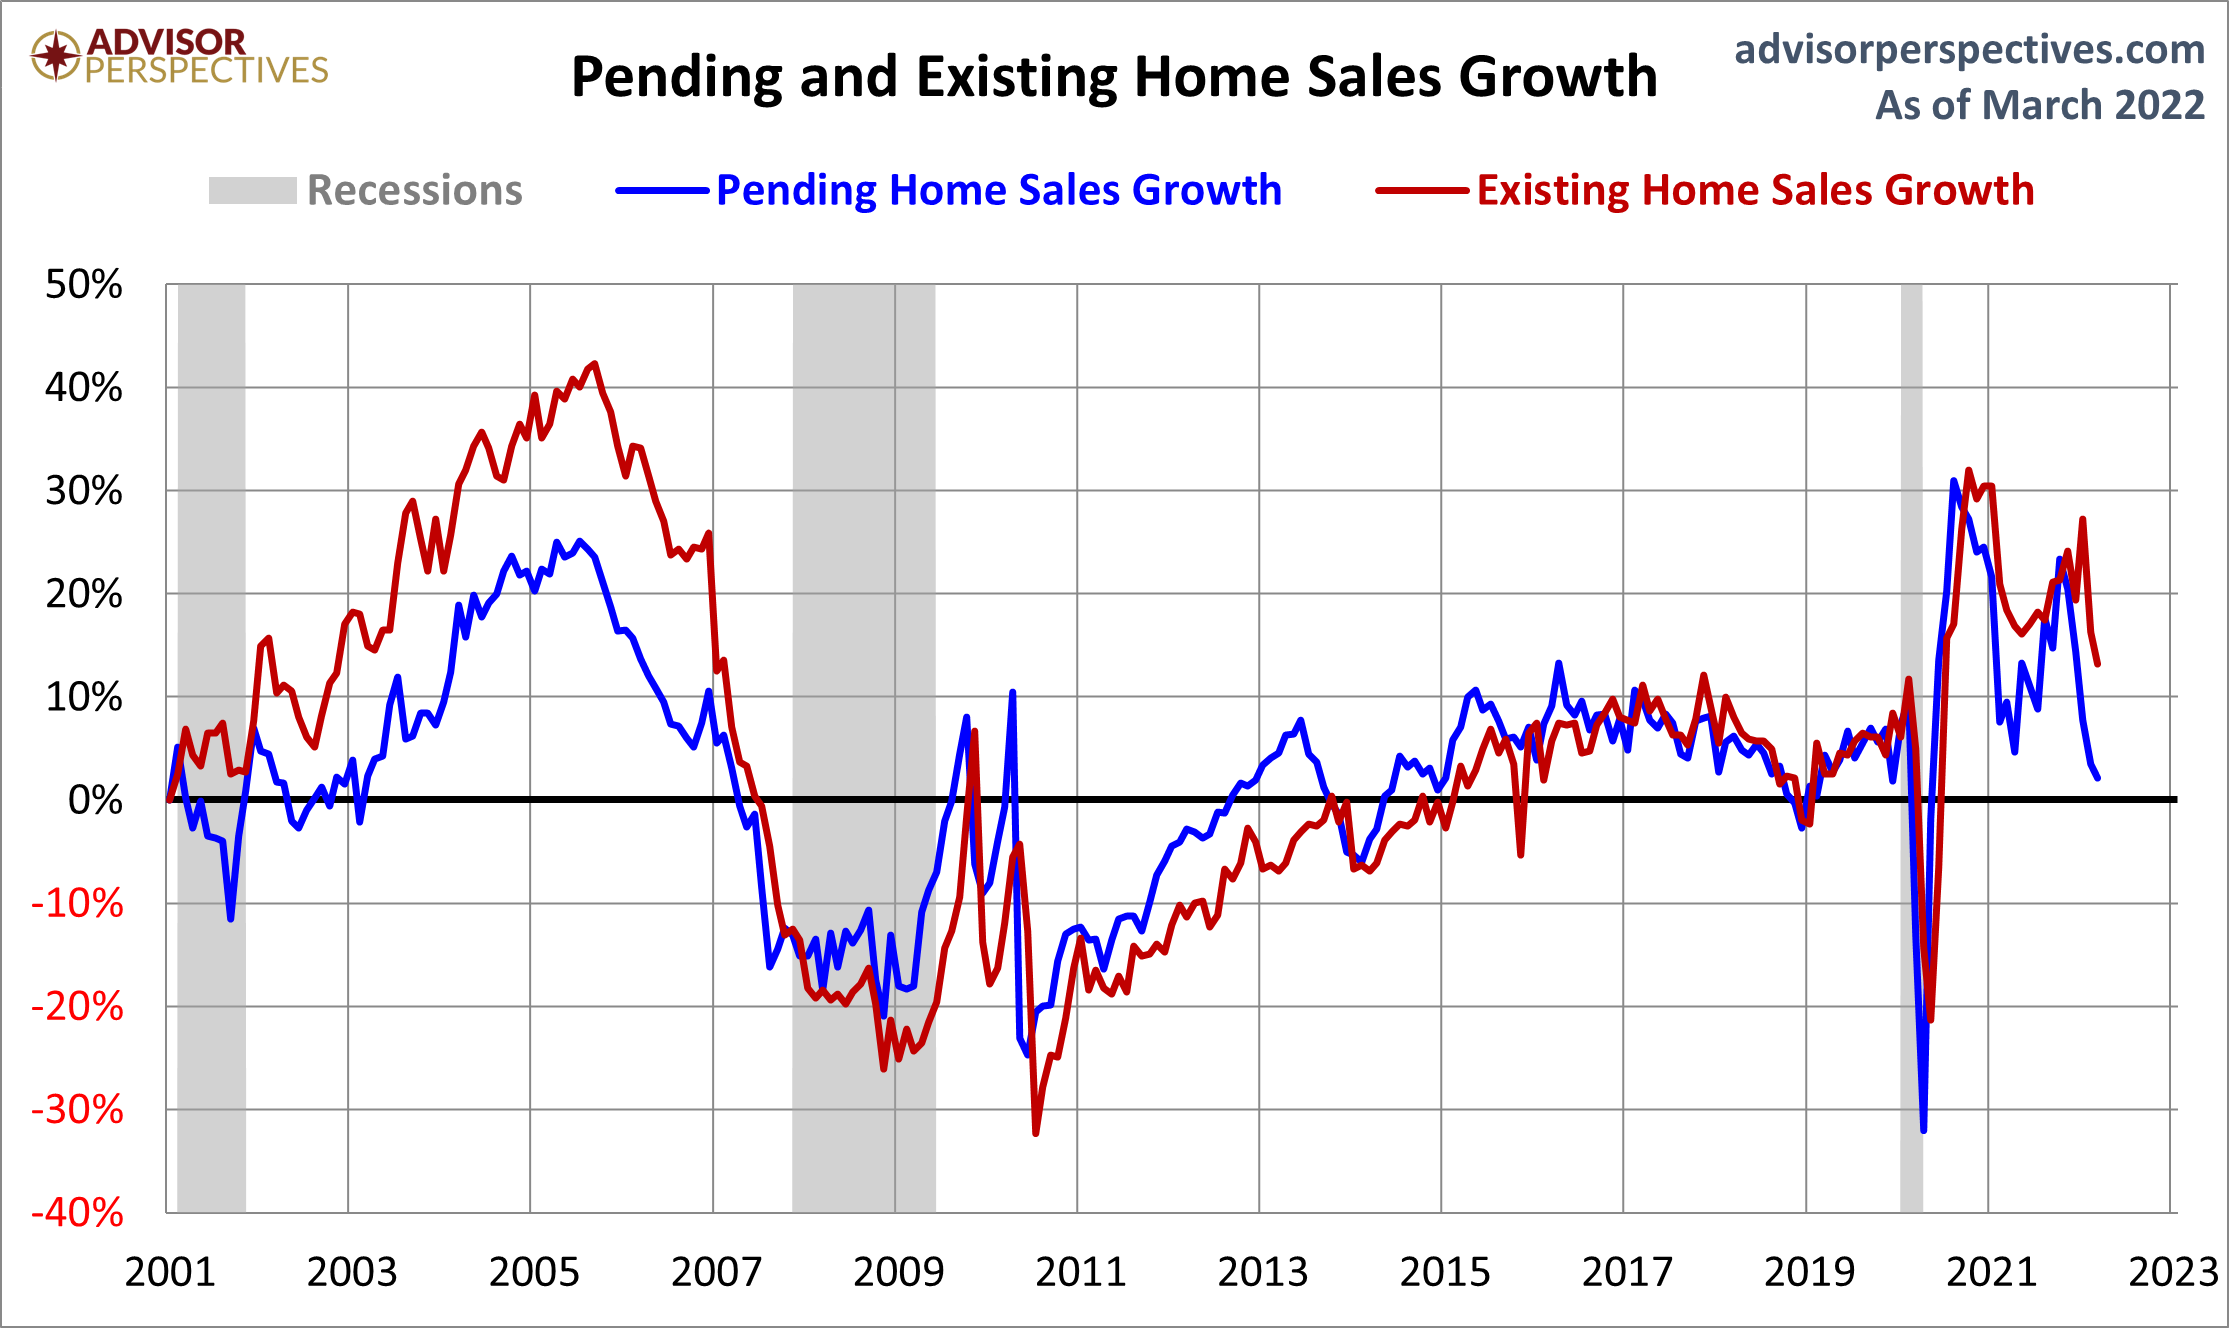
The NAR explains that "because a home goes under contract a month or two before it is sold, the Pending Home Sales Index generally leads Existing-Home Sales by a month or two." Here is a growth overlay of the two series. The general correlation, as expected, is close. And a close look at the numbers supports the NAR's assessment that their pending sales series is a leading index.
The index for the most recent month is currently 22% below its all-time high. The population-adjusted index is 27% off its high.
Pending versus Existing Home Sales
The NAR explains that "because a home goes under contract a month or two before it is sold, the Pending Home Sales Index generally leads Existing-Home Sales by a month or two." Here is a growth overlay of the two series. The general correlation, as expected, is close. And a close look at the numbers supports the NAR's assessment that their pending sales series is a leading index.
(Click on image to enlarge)



Comments
Log in or sign up to join the conversation.