

This morning the National Association of Realtors released the May data for their Pending Home Sales Index. Here is an excerpt from the latest press release:
The Pending Home Sales Index (PHSI),* www.nar.realtor/pending-home-sales, a forward-looking indicator of home sales based on contract signings, rose 8.0% to 114.7 in May. Year-over-year, signings increased 13.1%. An index of 100 is equal to the level of contract activity in 2001.
"May's strong increase in transactions – following April's decline, as well as a sudden erosion in home affordability – was indeed a surprise," said Lawrence Yun, NAR's chief economist. "The housing market is attracting buyers due to the decline in mortgage rates, which fell below 3%, and from an uptick in listings." (more here)
The chart below gives us a snapshot of the index since 2001. The MoM came in at 8.0%, up from a 4.4% decrease last month. Investing.com had forecast a decrease of 0.8%.

Over this time frame, the US population has grown by 16.6%. For a better look at the underlying trend, here is an overlay with the nominal index and the population-adjusted variant. The focus is pending home sales growth since 2001.
The index for the most recent month is currently 12% below its all-time high. The population-adjusted index is 19% off its high.
Pending versus Existing Home Sales
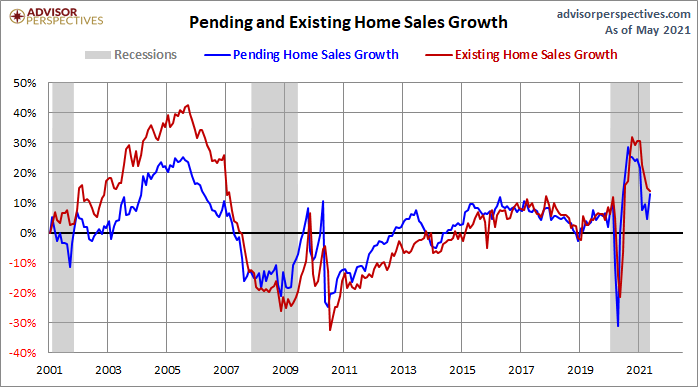
The NAR explains that "because a home goes under contract a month or two before it is sold, the Pending Home Sales Index generally leads Existing Home Sales by a month or two." Here is a growth overlay of the two series. The general correlation, as expected, is close. And a close look at the numbers supports the NAR's assessment that their pending sales series is a leading index.




Comments
Log in or sign up to join the conversation.