

Peabody Energy (BTU) is the largest private-sector coal company in the world. They offer a broad portfolio of coal supplies including coal produced from operations that Peabody Energy manages or owns majority interests in along with brokered coal secured by Peabody Coal trade.
We have spoken a lot lately of carnage in the oil markets, but for today we note that oil isn't the only fossil fuel suffering from bad times right now. Coal is fading in the United States as climate change, cheap natural gas and oil, and a more stringent regulatory environment, make the old standby by less attractive to users, regulators, and--by extension, investors.
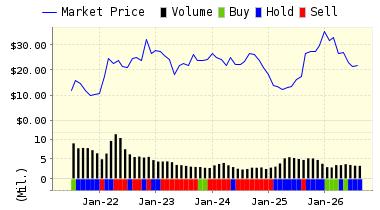
Peabody energy shares have been battered over the past year, losing @95% of their value. We have had a SELL or STRONG SELL on those shares for much of the past two years. Today, the shares have been battered again as the company filed paperwork indicated that it may seek bankruptcy protections if it cannot work out a deal with its creditors. Peabody faces an impending default due to a possible failure to pay interest on two loans and failing to achieve profit levels in accordance with some requirements imposed by their revolving credit facility.
In a required regulatory finding detailing these problems, the company noted that ""as a result of these factors, as well as the continued uncertainty around global coal fundamentals, the stagnated economic growth of certain major coal-importing nations, and the potential for significant additional regulatory requirements imposed on coal producers, among other matters, there exists substantial doubt whether we will be able to continue as a going concern."
That doesn't sound like "good" news!
We continue the STRONG SELL recommendation on PEABODY ENERGY for 2016-03-15. Based on the information we have gathered and our resulting research, we feel that PEABODY ENERGY has the probability to UNDERPERFORM average market performance for the next year. The company exhibits UNATTRACTIVE Momentum and P/E Ratio.
|
ValuEngine Forecast |
||
|
Target |
Expected |
|
|---|---|---|
|
1-Month |
3.96 | -1.26% |
|
3-Month |
3.82 | -4.73% |
|
6-Month |
3.62 | -9.78% |
|
1-Year |
3.41 | -14.97% |
|
2-Year |
2.15 | -46.46% |
|
3-Year |
1.81 | -54.84% |
|
Valuation & Rankings |
|||
|
Valuation |
75.00% undervalued |
Valuation Rank |
 100 100 |
|
1-M Forecast Return |
-1.26% |
1-M Forecast Return Rank |
1 |
|
12-M Return |
-95.12% |
Momentum Rank |
1 |
|
Sharpe Ratio |
-1.43 |
Sharpe Ratio Rank |
5 |
|
5-Y Avg Annual Return |
-119.95% |
5-Y Avg Annual Rtn Rank |
5 |
|
Volatility |
83.97% |
Volatility Rank |
18 |
|
Expected EPS Growth |
-4.13% |
EPS Growth Rank |
21 |
|
Market Cap (billions) |
1.09 |
Size Rank |
68 |
|
Trailing P/E Ratio |
n/a |
Trailing P/E Rank |
1 |
|
Forward P/E Ratio |
n/a |
Forward P/E Ratio Rank |
n/a |
|
PEG Ratio |
n/a |
PEG Ratio Rank |
n/a |
|
Price/Sales |
0.19 |
Price/Sales Rank |
93 |
|
Market/Book |
1.25 |
Market/Book Rank |
65 |
|
Beta |
1.61 |
Beta Rank |
19 |
|
Alpha |
n/a |
Alpha Rank |
n/a |
Market Overview
|
Summary of VE Stock Universe |
|
|
Stocks Undervalued |
61.83% |
|
Stocks Overvalued |
38.17% |
|
Stocks Undervalued by 20% |
27.62% |
|
Stocks Overvalued by 20% |
11.58% |
Sector Overview
|
Sector |
Change |
MTD |
YTD |
Valuation |
Last 12-MReturn |
P/E Ratio |
|
Utilities |
-1.07% |
2.55% |
3.18% |
8.11% overvalued |
-2.90% |
22.92 |
|
Consumer Staples |
-0.95% |
3.03% |
1.35% |
6.49% overvalued |
-0.83% |
23.82 |
|
Basic Materials |
-1.73% |
7.99% |
10.59% |
2.61% overvalued |
-6.80% |
25.58 |
|
Multi-Sector Conglomerates |
-0.68% |
6.21% |
0.18% |
0.12% overvalued |
-13.01% |
18.98 |
|
Industrial Products |
-1.60% |
5.40% |
0.39% |
0.07% overvalued |
-13.35% |
17.50 |
|
Computer and Technology |
-1.24% |
3.12% |
1.20% |
4.11% undervalued |
-10.32% |
26.10 |
|
Business Services |
-0.77% |
2.92% |
-2.69% |
4.66% undervalued |
-12.31% |
21.31 |
|
Aerospace |
-0.72% |
2.44% |
-5.13% |
5.12% undervalued |
-16.62% |
18.65 |
|
Finance |
-0.76% |
4.03% |
-3.66% |
5.77% undervalued |
-7.82% |
15.28 |
|
Consumer Discretionary |
-0.64% |
4.96% |
0.60% |
5.79% undervalued |
-9.73% |
24.48 |
|
Retail-Wholesale |
-1.28% |
2.51% |
-1.18% |
7.65% undervalued |
-12.72% |
22.02 |
|
Auto-Tires-Trucks |
-0.95% |
8.90% |
-2.28% |
9.80% undervalued |
-17.77% |
12.14 |
|
Oils-Energy |
-1.95% |
11.65% |
1.83% |
10.74% undervalued |
-34.35% |
21.55 |
|
Construction |
-0.95% |
4.50% |
-1.01% |
10.94% undervalued |
-7.85% |
18.97 |
|
Transportation |
-1.42% |
4.43% |
-1.63% |
12.80% undervalued |
-24.02% |
12.79 |
|
Medical |
-3.03% |
2.38% |
-11.64% |
15.53% undervalued |
-24.53% |
25.46 |
Valuation Watch: Overvalued stocks now make up 38.17% of our stocks assigned a valuation and 11.58% of those equities are calculated to be overvalued by 20% or more. Five sectors are calculated to be overvalued.
Comments
Log in or sign up to join the conversation.