
Popular overhyped growth stock favorites began the inevitable journey down to more reasonable valuation levels as markets began factoring in reduced liquidity and higher interest rates. Details follow in the Market Review along with another look at WTI Crude Oil from the perspective of the Commitment of Traders Report.
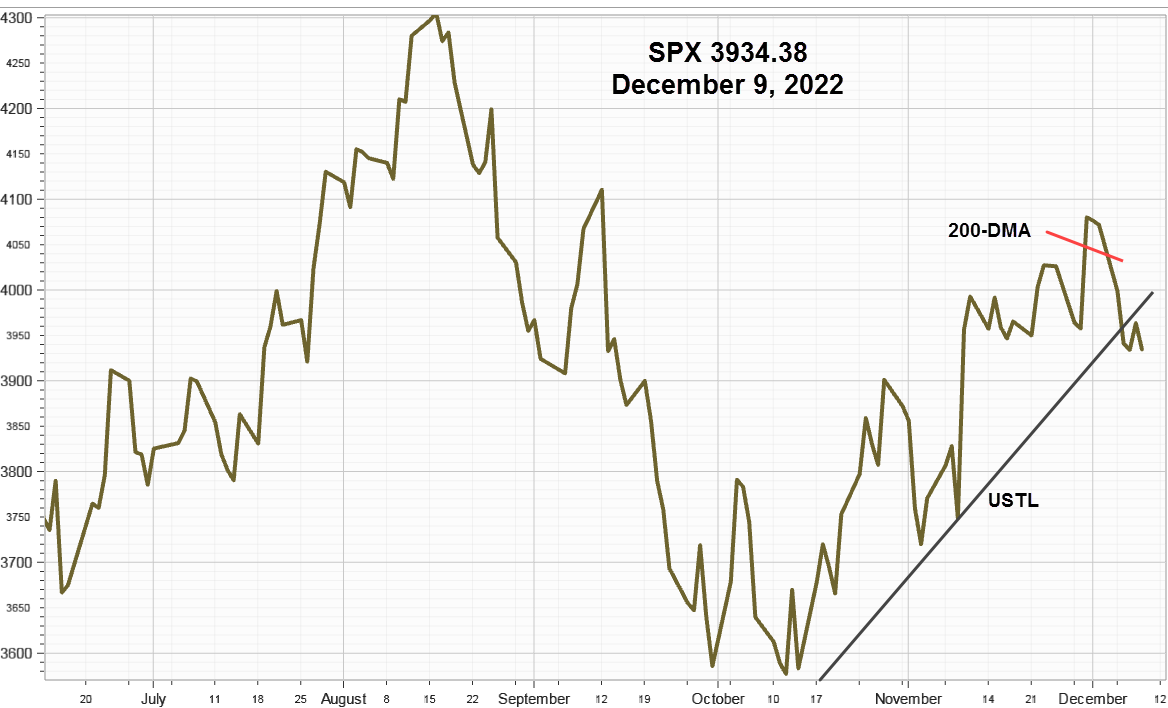
S&P 500 Index (SPX) 4538.43 declined 56.19 points or -1.22% last week. It's now below the upward sloping trendline from the October 4 low at 4278.74 and support from both the September 2, high at 4545.86 and the 50-day Moving Average at 4544.73. Friday's wide outside trading range suggests a price reversal on Monday. Using Tom De Mark's (1) range estimate methodology puts Monday's support low at 4460.32 with a resistance high of 4573.23.
Invesco QQQ Trust (QQQ) 383.13 dropped 8.07 points or -2.08% last week after trading down to support from the 50-day Moving Average on Friday then closing slightly better. Now looking oversold and further supported by the previous September 7 high at 382.35along with the 50-day Moving Average at 380.76 odds are it will attempt to hold this level although loaded with out-of-favor expensive growth stocks.
iShares Russell 2000 ETF (IWM) 214.71 sank 8.14 points or -3.65% after making a feeble attempt to close the gap below the 50-day Moving Average at 227.97 on Monday and then retreating back below the 200-day Moving Average at 223.71. Once again, it declined more in percentage terms than both the SPX and QQQ, for the third week. Although expectations for higher interest rates should eventually help small caps, high multiple P/E compression seems more important, and the yield on U.S 10-Year Treasury Note declined 9 basis points Friday to end at only 1.35%.
CBOE Volatility Index® (VIX) advanced 2.05 points or +7.16% last week ending at 30.67. Our similar IVolatility Implied Volatility Index Mean, IVXM using four at-the-money options for each expiration period along with our proprietary technique that includes the delta and vega of each option, added 1.48 points or +7.05% closing at 22.48% and higher than the September/October pullback.

VIX Futures Premium
VIX futures premium ended Friday at -7.19% still in the red bear zone vs. -5.04% on November 26 with 19 days to expiration for the front-month December contract.

The chart reflects the distance from the VIX to the futures curve computed from the two front month contracts. Since most of the volume and open interest are in the two closest futures contracts measuring the volume-weighted premium relative to the standard 30-day VIX provides a good real-time sentiment indicator based upon actual commitments of large Asset Managers and Leveraged Funds.
VIX-VXST Spread
This indicator can be useful to help decide when it's safe enough to "get back into the pool." The all-clear signal comes when it turns positive again. Until then, remain cautious or consider short strategies with defined risk.

Market Breadth as measured by our preferred gauge, the NYSE ratio adjusted Summation Index that considers the number of issues traded, and reported by McClellan Financial Publications. Last week the decline accelerated dropping 336.30 points or -198.38% to end Friday at -166.78. Now under the Sep - Oct lows of both this and last year. This suggests dip buyers and bottom fishers should remain on the sideline until breadth begins improving.

WTI Crude Oil (CL) 66.26 basis January futures declined 1.89 points or -2.77% last week after trading down as low as 62.43 on Thursday nearly reaching the August 23 intraday low at 60.77 before making a pivot and a higher trading range on Friday.
Now well below the 50-day Moving Average at 77.67, consolidation in the current range seems very likely since the inventory level reported by the EIA as of November 26 shows it below the 5-year range. However, any stability assumes Covid Omicron does not significantly reduce demand.
On November 30, the day of the last Disaggregated Commitments of Traders - Options and Futures Combined report (COT), cash closed at 66.18 down 12.32 points or -15.69%.
Our Open Interest vs.WTI Cash chart in Digest Issue 47 "WTI Crude Oil Seasonal [Charts]" as of November 16, shows open interest sending a good warning as it led the subsequent price decline.
The recent report as of November 30, shows them moving in sync again. Watch to see when open interest starts increasing again for a clue when the price may stabilize and attempt to turn higher.

Strategy
Continue hedging long-duration risk, such as equities with high price-to-earnings (P/E) multiples, especially those without earnings valued on price-to-sales basis, until crude oil, the S&P 500 Index and the Invesco QQQ Trust stabilize and turn higher.
Seasonally equities advance in December with most of the gains occurring in the second half of the month. Interestingly the Federal Open Market Committee (FOMC) meets on December 14-15, when Chairman Powell will make a statement and answer questions about revised taper plans and when to expect interest rate increases.
(1) The New Science of Technical Analysis, 1994, Thomas R. De Mark, pp. 193-195.
Summary
Call the equity market decline P/E Multiple Compression or a high P/E shake with most all sectors dragged lower by overhyped growth stock favorites. While the Covid Omicron variant remains a real concern it may have triggered profit-taking in stocks considered by some as "overvalued." An early sign of light and perhaps even a seasonal advance into year-end should come from improving market breadth, perhaps around December 15.
Comments
Log in or sign up to join the conversation.