

Executive Summary:
In looking at the potential for a countertrend move to develop, the best way to summarize the situation might be to say, see last week's report entitled, "The Song Remains The Same." The bottom line is stocks remain overbought, sentiment has reached extremely positive levels, and complacency appears to have set in. As such, one can easily argue that the table is set for the bears to enjoy some time in the sun. However, since investors are currently looking ahead to better days, the news on the virus front has been improving, and earnings have been largely better than expected, a negative trigger will likely be required to get any real downside action going. But... If/when that trigger materializes, the extreme overbought condition could easily lead to a "whoosh" lower. But until then the battle cry appears to be, "Party on Wayne!"
My Review Process: I believe one of the keys to longevity in the investing business is having a repeatable process. Thus, I start each week with a review of the state of the big-picture environment. I then look at the current trend and the degree of momentum behind the move. Next, I explore the potential for a countertrend move to develop via our Early Warning Indicator Board, which is designed to indicate when "the table might be set" for the trend to "go the other way" for a while.
The State of the "Early Warning" Indicators
There is one change to the Early Warning board this week as the Long-Term Sentiment Model flipped from buy to sell and is now negative. This causes the average hypothetical annualized return of the S&P 500 based on the current model readings to fall from last week's +6.6% to +1.7% this week. The takeaway here is that although the trend of the market is up, (1) the historical return given the current state of the Early Warning Indicators has not been robust and (2) the "table" is clearly set for some countertrend action - or at the very least, a period of consolidation.
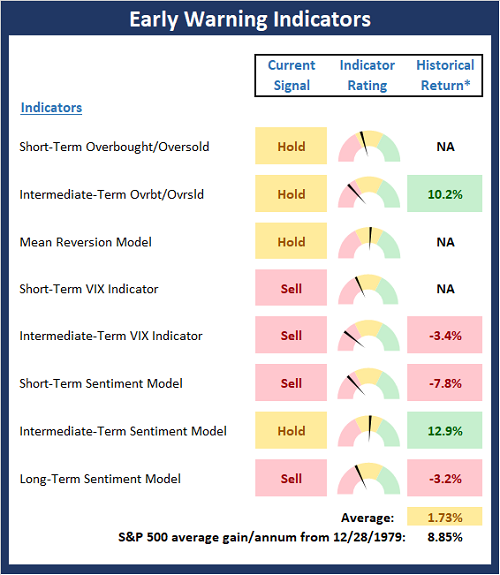
* Source: Ned Davis Research (NDR) as of the date of publication. Historical returns are hypothetical average annual performances calculated by NDR. Past performances do not guarantee future results or profitability - NOT INDIVIDUAL INVESTMENT ADVICE.
View Early Warning Indicator Board Online
Stochastic Review
I have found that reviewing the basic stochastics is a solid way to determine when an index or security may be ripe to "go the other way" for a while. I like to keep it simple here by using a 14 day %K (with 1-day smoothing) and a 3 day %D. It's not fancy, but it tends to be an effective tool for an oftentimes complex subject.
S&P 500 - Daily
(Click on image to enlarge)
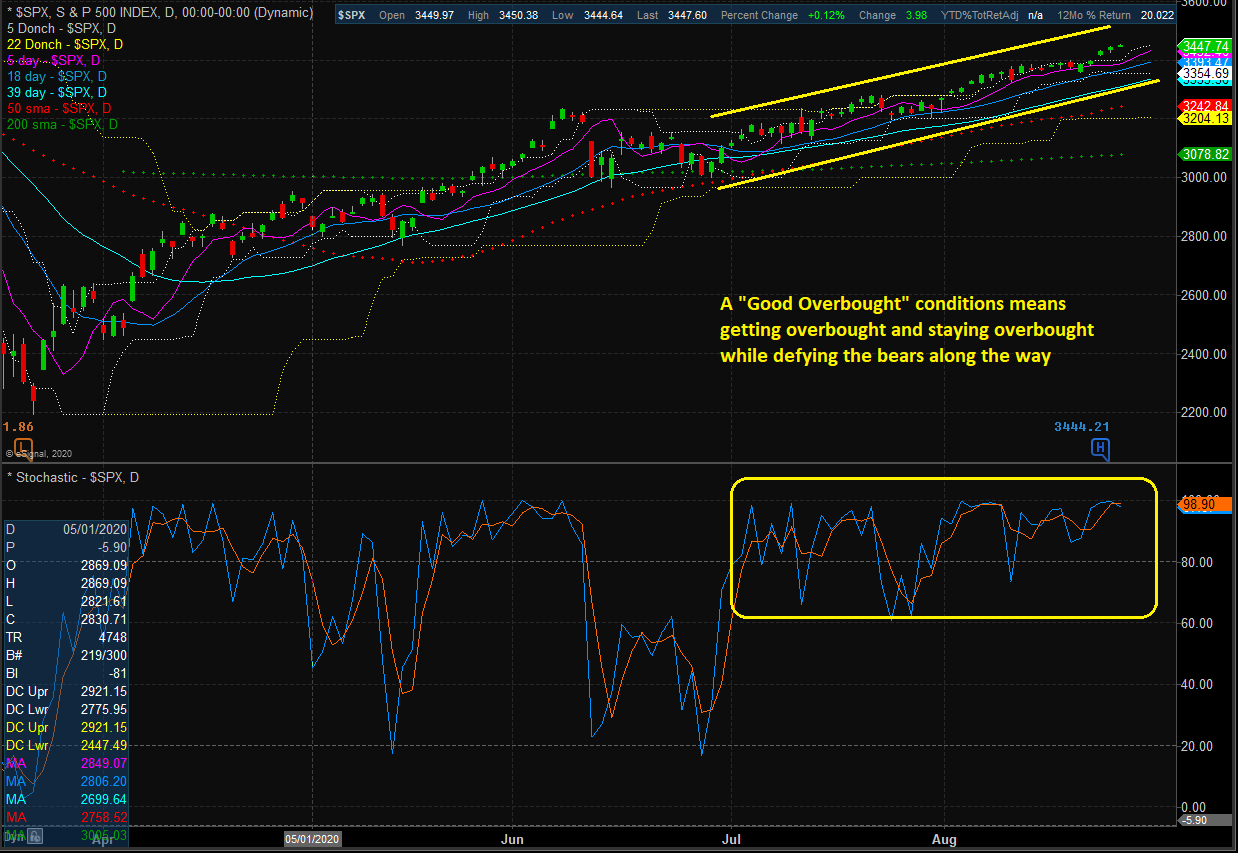
With the market seemingly inching higher on a daily basis with little downside action since the end of June, my take has been that we've got a "good overbought" condition on our hands - where stocks get overbought and stay overbought for an extended period of time.
What usually happens next is something comes along to give the bears a raison d'etre, which produces a violent decline in response. Typically, the dance to the downside that follows an overbought condition that is accompanied by extremely positive sentiment (check) is a move that tends to wipe out a healthy portion of the rally in a very short period of time.
In my experience, this is when it is best to put additional funds to work. However, the wait for such a pullback can be painful for those with cash on the sidelines!



Comments
Log in or sign up to join the conversation.