

Economic Events October 21 – 25, 2019
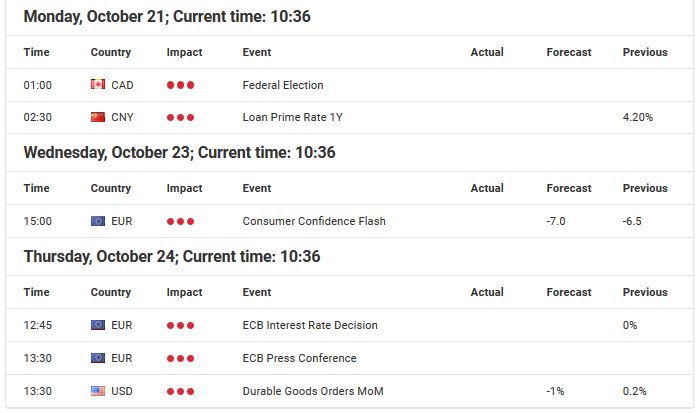
Source: Economic Events Calendar October 21 – 25, 2019 - Admiral Markets' Forex Calendar
DAX30 CFD
During the last week, the German DAX30 CFD finally marked new yearly highs. And in anticipation of a dovish ECB next Thursday, further gains up to 12,900 points are a serious option.
Still, bulls should remain a little careful in becoming overly optimistic, reason: the current US-Chinese truce, probably also after China said to want the US to remove tariffs so they can reach 50 USD billion in imports of US farm goods last Tuesday, chances remain elevated that US president Trump will probably react with a next wave of aggressive tweets, throw the latest approaches overboard and impose a next wave of tariffs instead, resulting in a rising risk-off mode and identifying the break to new yearly highs in the DAX30 CFD as a potential fake out.
Nevertheless, we see a higher probability of the DAX30 CFD continuing to trade higher and the thin market environment till Wednesday with market participants waiting for the ECB rate decision on Thursday could result in a squeeze higher and up to 12,900 points.
A short retracement finds a solid region of support around 12,470/500 – a potential long trigger while the technical picture would only darken with a drop below the SMA(200), currently being found around 11,800/850 points.
(Click on image to enlarge)
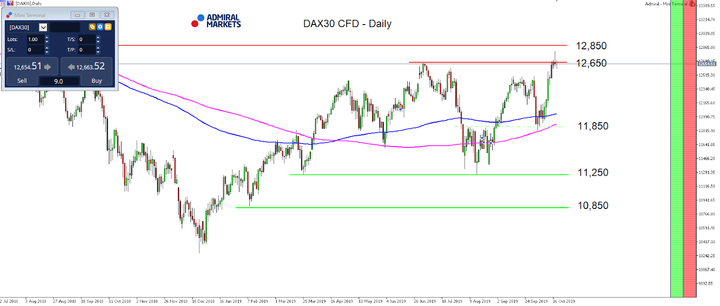
Source: Admiral Markets MT5 with MT5-SE Add-on DAX30 CFD Daily chart (between July 12, 2018, to October 18, 2019). Accessed: October 18, 2019, at 10:00pm GMT - Please note: Past performance is not a reliable indicator of future results, or future performance.
In 2014, the value of the DAX30 CFD increased by 2.65%, in 2015, it increased by 9.56%, in 2016, it increased by 6.87%, in 2017, it increased by 12.51%, in 2018, it fell by 18.26%, meaning that after five years, it was up by 10.5%.
Check out Admiral Markets' most competitive conditions on the DAX30 CFD and Dow Jones CFDs and start trading on the DAX30 CFD with a low 0.8 point spread offering during the main Xetra trading hours!
US Dollar
And again, the overall picture in the US dollar didn't significantly change over the last week and won't likely in the days to come, too, with the Fed rate decision next week on Wednesday on the agenda.
But, again, we'd like to re-emphasize our scepticism for the Greenback, we already pointed out in our last two weekly market outlooks.
Here, we wrote:
[…]Probably, the US dollar shortage in money markets is the current reason for the US dollar performance, especially against the Euro and once the repo markets normalises (if it does…), the Greenback could see some heavier selling pressure.[…]
This quote is especially noteworthy after a speech from Fed chairman Jay Powell in Denver on October 8, where he said that the Fed will resume their asset purchases to prevent a cash crunch in money markets (and announced on October 11).
The current plan is to buy US Treasuries for the next 8.5 months at a pace of 60 billion USD per month, but any hints at the meeting next week (or already over the next few days), that the Fed could consider extending that program if no improvement in regards to the "liquidity issue" is seen, the US dollar could see a next wave of selling.
Still, short-engagements in the USD Index Future should be taken with great caution since technically the USD Index Future stays bullish as long as it trades above 95.00:
(Click on image to enlarge)
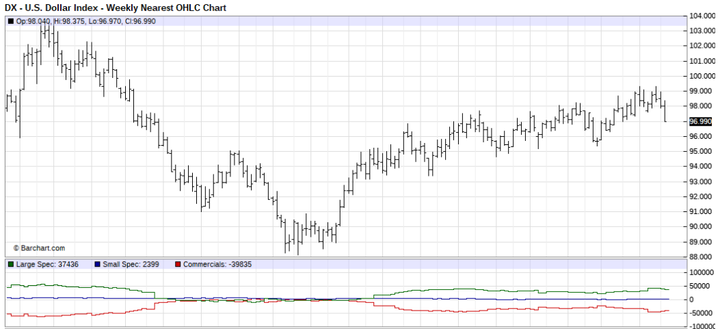
Source: Barchart - U.S. Dollar Index - Weekly Nearest OHLC Chart (between May 2016 to October 2019). Accessed: October 18, 2019, at 10:00pm GMT
Don't forget to register for the weekly "Trading Spotlight" webinar with presenters including Jens Klatt, every Monday, Wednesday and Friday at 3pm London time! It's your opportunity to follow Jens and others as they explore the weekly market outlook in detail, so don't miss out!
Euro
After the ECB announced QE-ternity at the meeting on September 12, announcing the re-start of the QE program at a pace of €20bn per month, saying that it would run as long as necessary, the ECB rate decision this week on Thursday will likely be unspectacular and the main focus will be on the fact that it will be the last press conference with Mario Draghi being the ECB president.
What will be interesting is nevertheless if some journalist probably pressure Draghi to give some details on the tensions which build in the Governing Council after the latest QE-decision.
As we now, the QE decision was opposed by at least seven top ECB officials and resulting in ECB's top German official, Sabine Lautenschläger, leaving the bank two years early after opposing the new round of fresh bond purchases.
An escalating conflict here surely risks harming the effectiveness of the ECB and could trigger rather sooner than later another sharp push lower.
But given the recent rising scepticism, US dollar weakness and rising chances on a Brexit deal, EUR/USD could certainly continue to trade higher, especially after recapturing 1.1100 with a first potential target being found around 1.1280/1300:
(Click on image to enlarge)
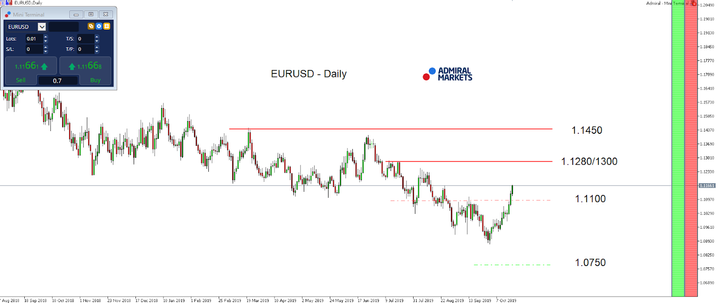
Source: Admiral Markets MT5 with MT5-SE Add-on EUR/USD Daily chart (between August 27, 2018, to October 18, 2019). Accessed: October 18, 2019, at 10:00pm GMT - Please note: Past performance is not a reliable indicator of future results, or future performance.
In 2014, the value of the EUR/USD fell by 11.9%, in 2015, it fell by 10.2%, in 2016, it fell by 3.2%, in 2017, it increased by 13.92%, 2018, it fell by 4.4%, meaning that after five years, it was down by 16.5%.
JPY
While the picture in USD/JPY hasn't again significantly change over the last week of trading, the latest Brexit developments and truce in the trade conflict between the US and China resulted in an obvious risk-on market environment, pushing USD/JPY into the region around 109.00.
With the economic calendar not looking very packed over the next days and USD/JPY traders likely waiting in excitement on the Fed and BoJ rate decision next week, volatility should stay subdued, even though with the advantage being on the long side.
Still, we'd be careful if the currency pair pushes above 109.00, would consider such a push not necessarily sustainable, the reason: after the Fed restarted their asset purchases to prevent a cash crunch in money markets and plans to buy US Treasuries for the next 8.5 months at a pace of 60 billion USD per month, any hints at the meeting next week, that the Fed could consider extending that program if no improvement in regards to the "liquidity issue" is seen, the US dollar could see a next wave of selling.
In addition to that, the current US-Chinese truce, probably also after China said to want the US to remove tariffs so they can reach 50 USD billion in imports of US farm goods, leaving chances elevated that US president Trump will probably react with a new wave of aggressive tweets, throw the latest approaches overboard and impose a next wave of tariffs instead, resulting in a rising risk-off mode, pushing USD/JPY lower again.
That said, another attempt to break back below 106.80/107.00 stays a serious possibility, even though USD/JPY stays technically neutral on a daily time-frame between 106.80/107.00 and 108.50/109.00:
(Click on image to enlarge)
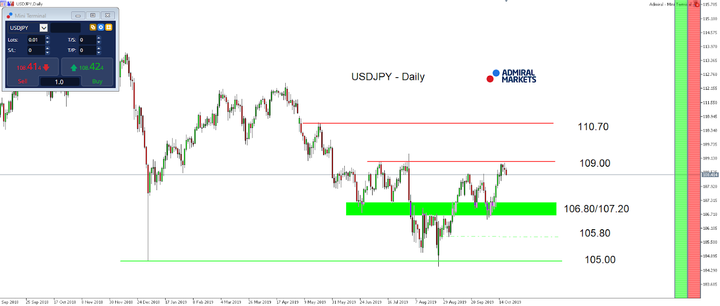
Source: Admiral Markets MT5 with MT5-SE Add-on USD/JPY Daily chart (between September 3, 2018, to October 18, 2019). Accessed: October 18, 2019, at 10:00pm GMT - Please note: Past performance is not a reliable indicator of future results, or future performance.
In 2014, the value of the USD/JPY increased by 13.7%, in 2015, it increased by 0.5%, in 2016 it fell by 2.8%, in 2017 it fell by 3.6%, in 2018 it fell by 2.7%, meaning that after five years, it was up by 4.1%.
Gold
The overall picture in Gold hasn't significantly changed for Gold – which may come as a surprise since the latest Brexit developments and truce in the trade conflict between the US and China resulted in an obvious risk-on market environment with the SP500 CFD focussing on 3,000 points again and the German DAX30 CFD for example marking new yearly highs.
The most likely reason seems that Gold traders are probably not buying this US-Chinese truce, probably also after China said to want the US to remove tariffs so they can reach 50 USD billion in imports of US farm goods, leaving chances elevated that US president Trump will probably react with the next wave of aggressive tweets, throw the latest approaches overboard and impose a next wave of tariffs instead, resulting in a rising risk-off mode.
With such thoughts in mind, the stabilization slightly below 1,500 USD can seriously be considered as a warning sign and leaves, also from a technical perspective, the advantage in Gold on the Long side and our mid-term target around 1,650/700 USD staying active.
And even a stint below the current October lows around 1,460 USD wouldn't darken the picture, but instead bring a potential mid-term long trigger around 1,440/450 USD into play:
(Click on image to enlarge)
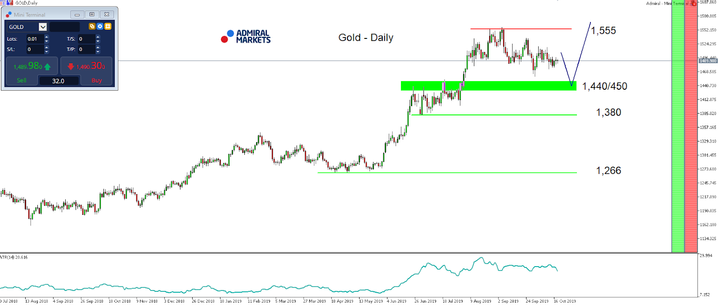
Source: Admiral Markets MT5 with MT5-SE Add-on Gold Daily chart (between July 20, 2018, to October 18, 2019). Accessed: October 18, 2019, at 10:00pm GMT - Please note: Past performance is not a reliable indicator of future results, or future performance.
In 2014, the value of Gold fell by 1.7%, in 2015, it fell by 10.4%, in 2016, it increased by 8.1%, in 2017, it increased by 13.1%, in 2018, it fell by 1.6%, meaning that after five years, it was up by 6.4%.



Comments
Log in or sign up to join the conversation.