

(This actual Market Report was written pre-NY market opening, on Thursday, June 20, 2019, and was updated until the NY market closed. Seeking Alpha has been encouraging SA service providers to become more transparent, and show actual reports and interaction between providers and subscribers. We are providing this report to showcase what PAM provides to the members of the community).
Why not take a free two-week trial subscription, have a look at us and see if this community of veteran investors is a good fit for you?
Please go here
Robert P. Balan @robert.p.balanLeaderJun 20, 2019 2:51 PM
GOOD MORNING
Here is the market Report At The Chat, June 20, 2019
Alan Longbon Alan.LongbonJun 20, 2019 2:40 PM
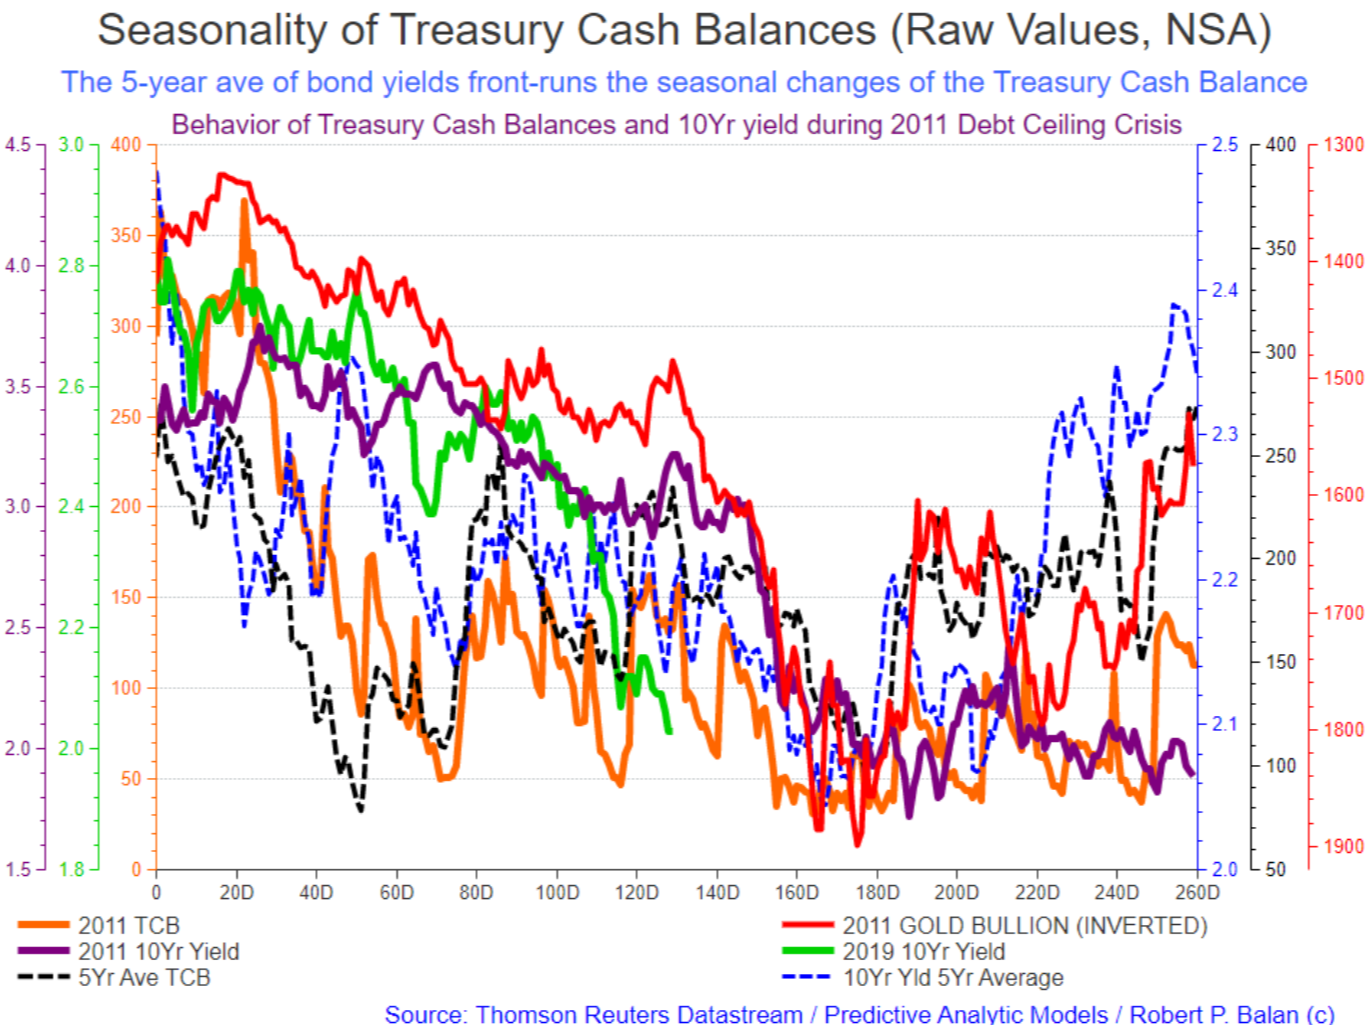
Going back to this 2011 scenario, what did gold do as a covariance with the other variables on the chart?
Robert P. Balan @robert.p.balanLeaderJun 20, 2019 2:55 PM
Gold outperformed as well during the 2011 Debt Ceiling Crisis, but gave back its gains in 4 months after the debt ceiling was lifted-
Next question: how did oil and the USD go?
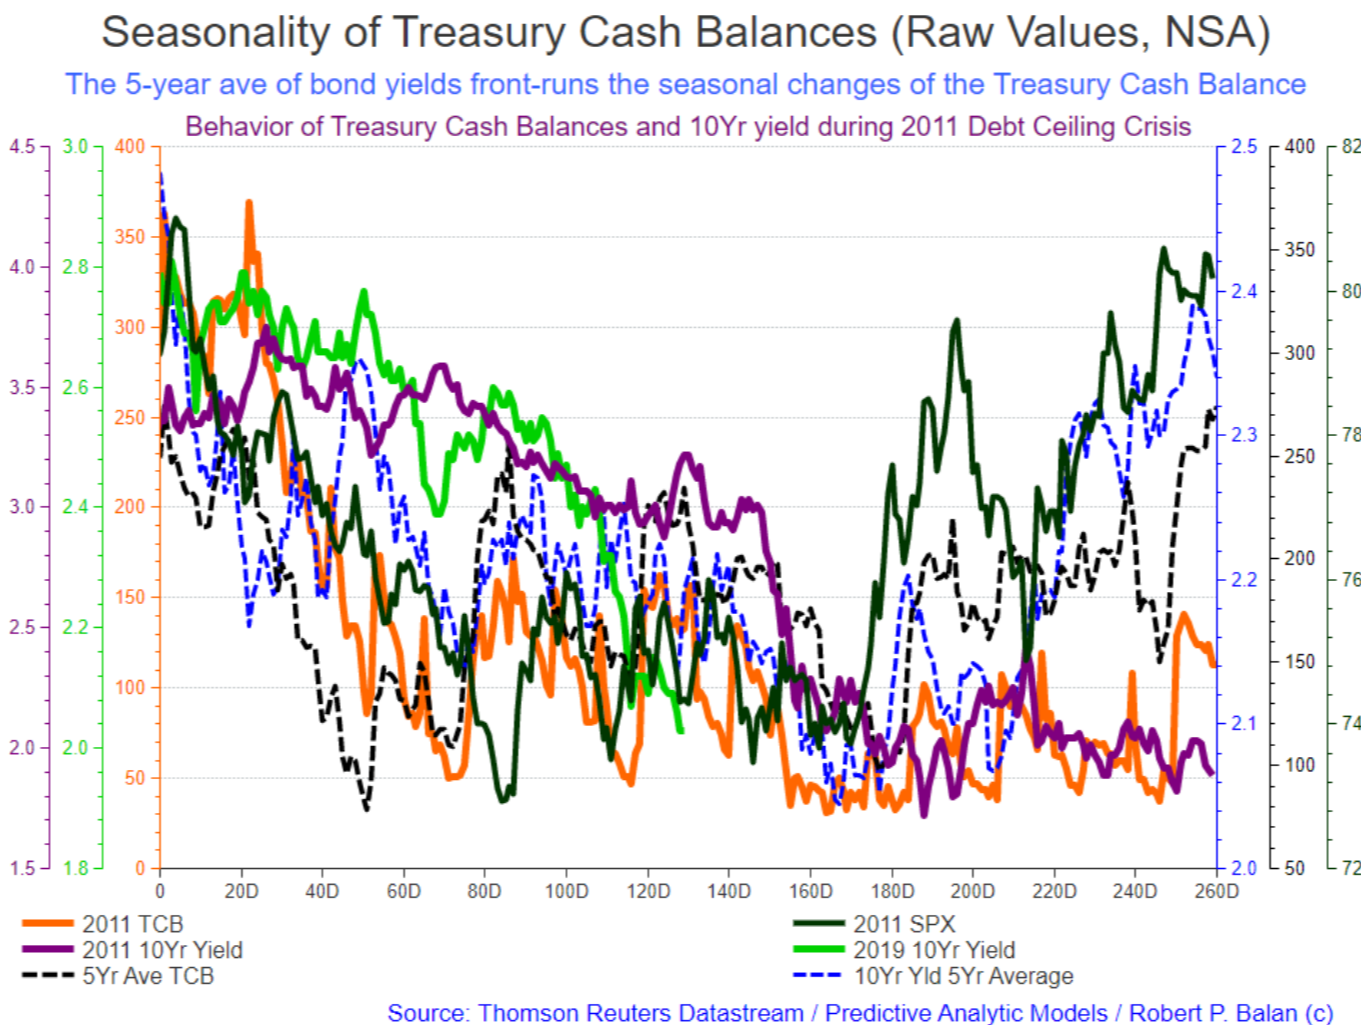
The Dollar posted highs for the year after the debt ceiling was lifted.
And so did WTI Oil (almost)
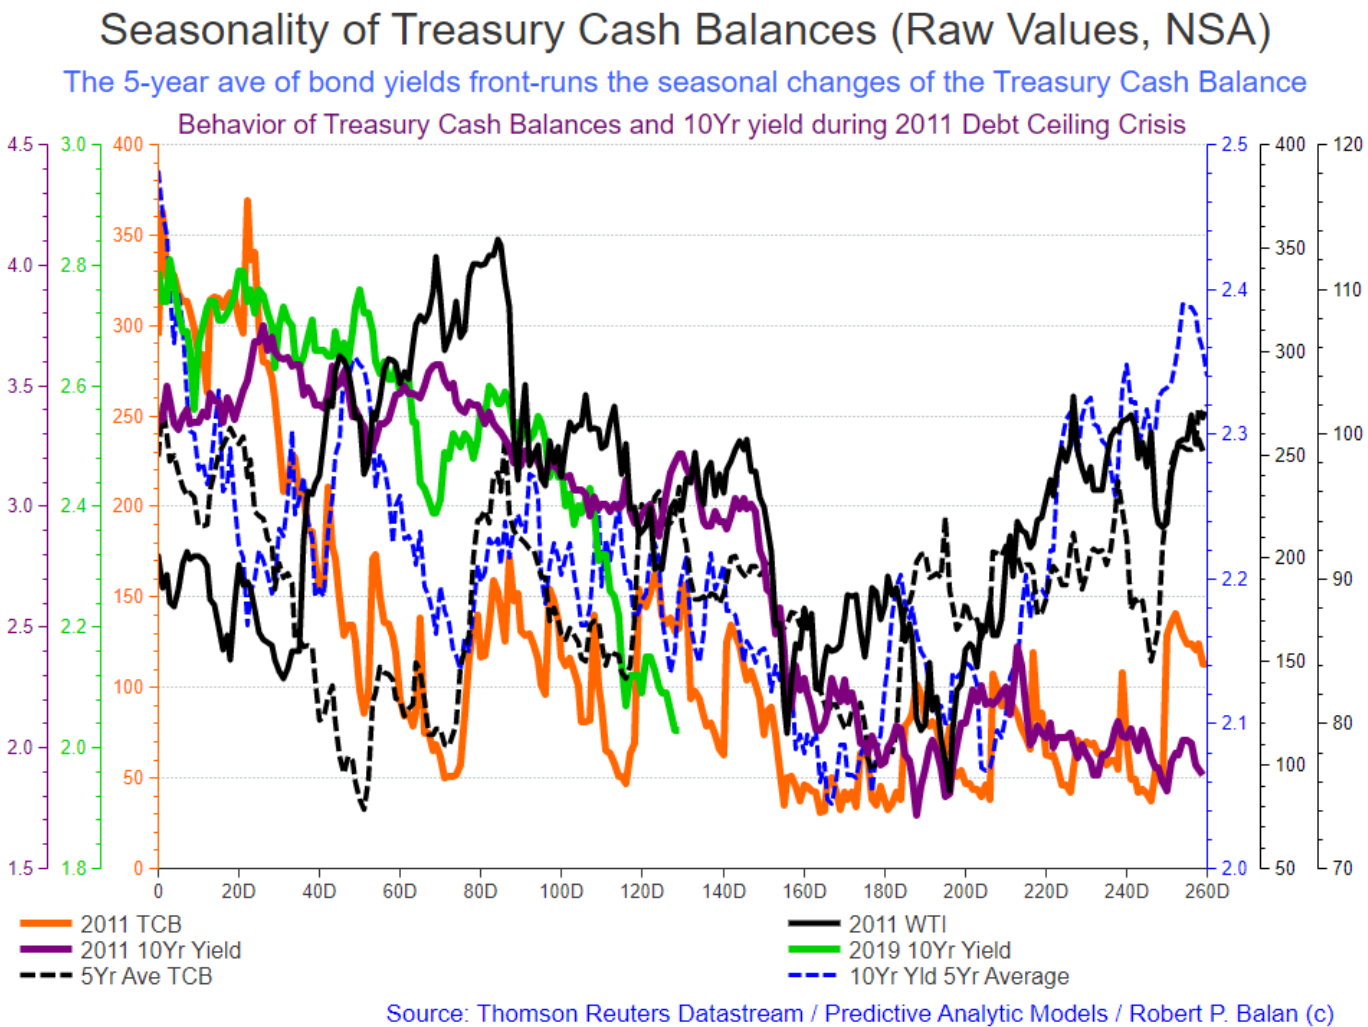
The facts are clear -- the debt ceiling crisis is fueling the extraordinary moves in risk assets -- but not long after the government can borrow again, the risk assets give back their gains (and sometimes, more).
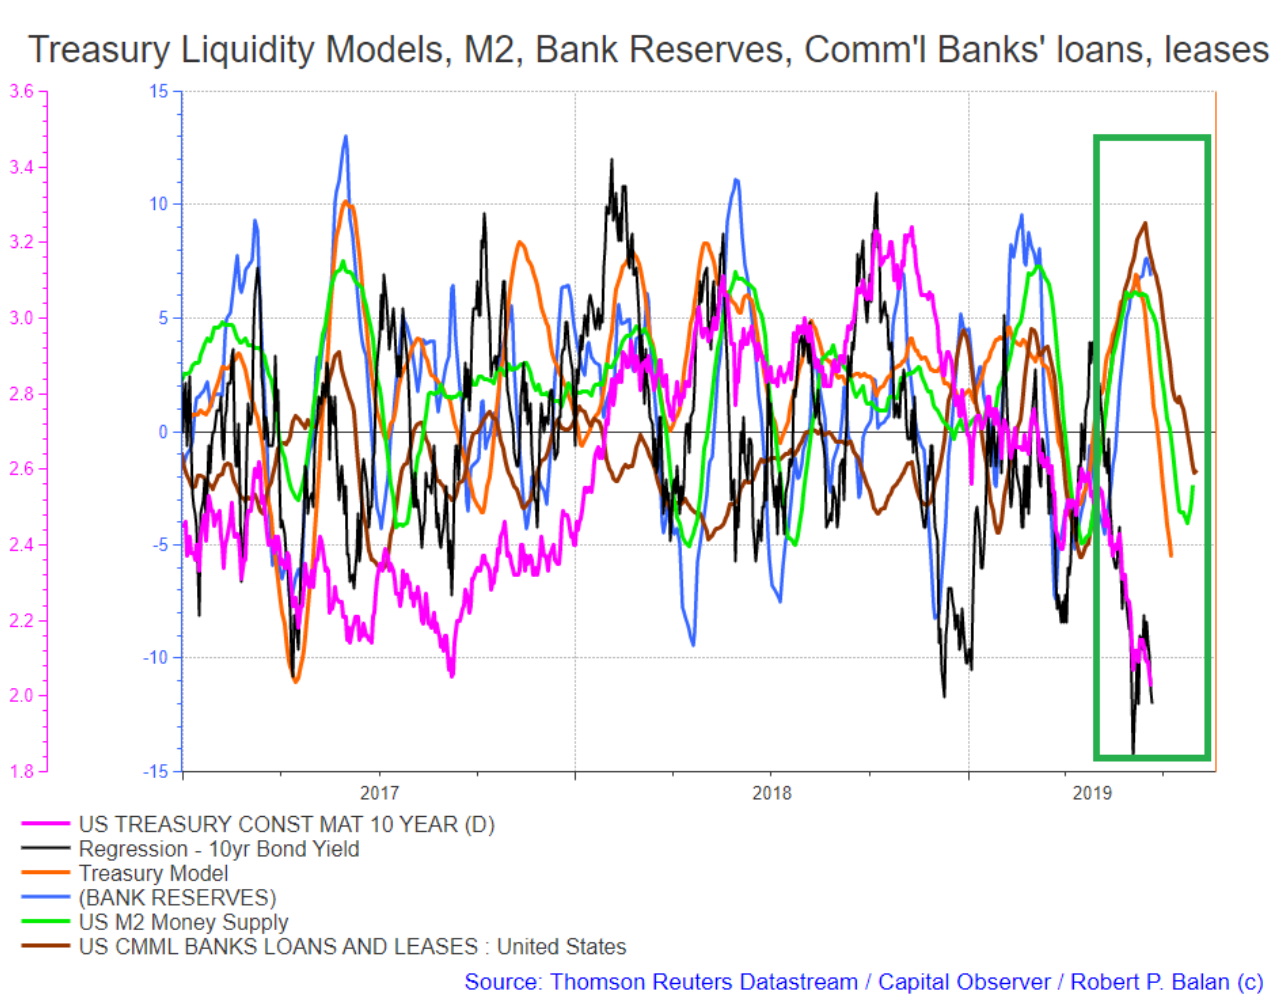
Yields should have been rising on rising bank reserves, Treasury Cash Balances, M2 Money Supply, and bank loans and leases -- but yields diverged lower.
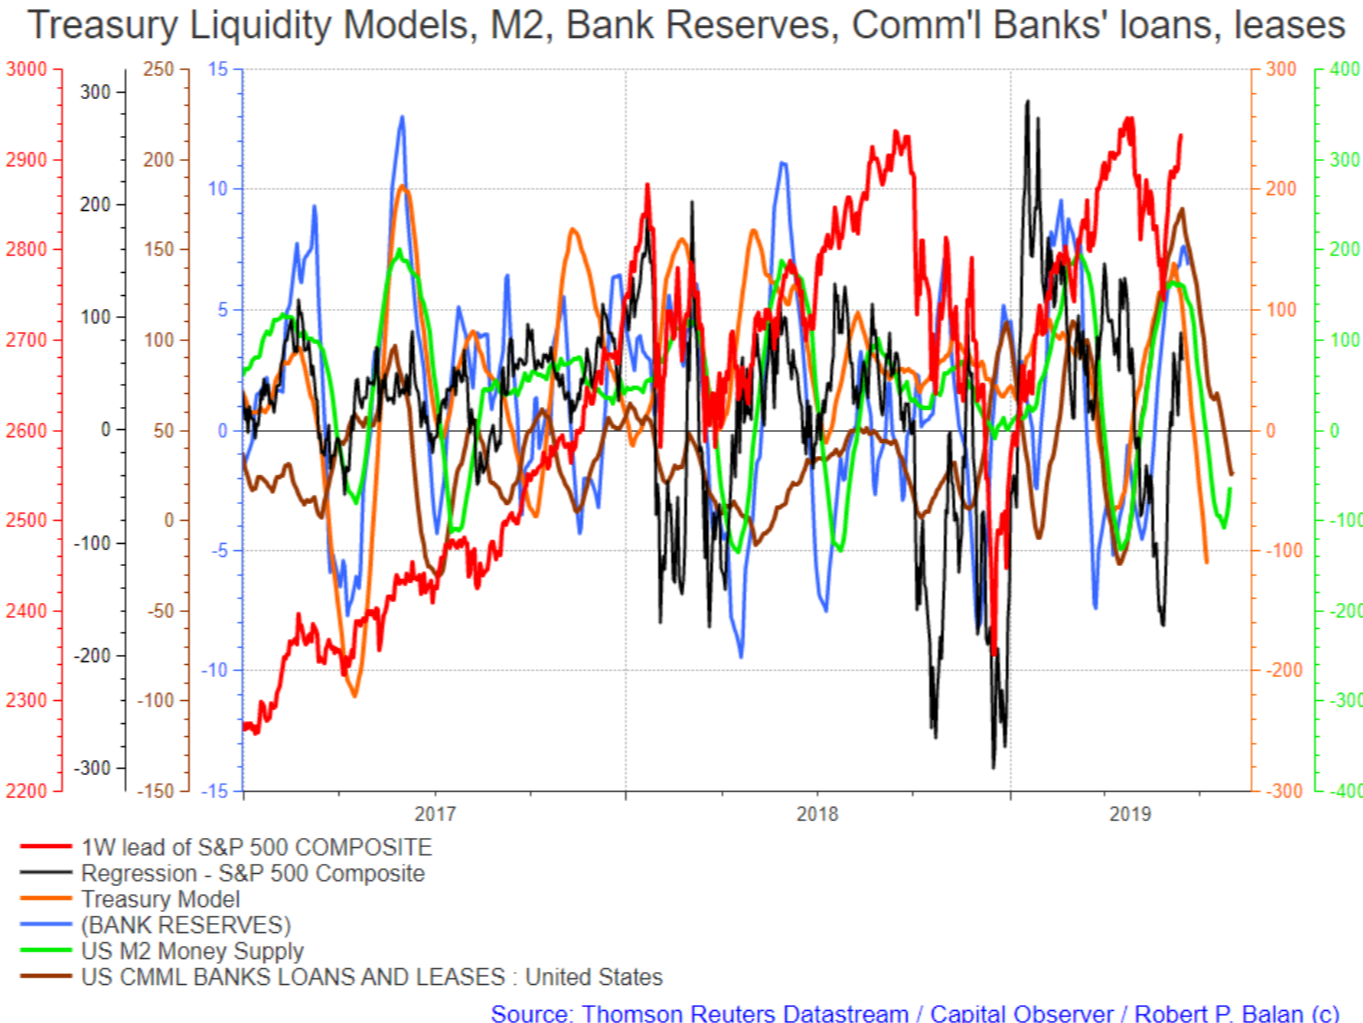
Equities also diverged for a while, but has gone back to the liquidity orbit, and SPX may be ready to respond to a new drought in monetary inflows.
One thing clear though -- bank reserves are function of systemic liquidity. Their inflows and outflows are dictated by money supply (M2) and Tresury Cash Balances, and especially positively correlated to Comm'l Bank Loans and Lease, which they trail by 4 to 6 weeks.A side comment -- the commercial banks loans and leases create deposits -- which is the source of new money created by the banking system -- something that is being pilloried by economists who still believe in the myths that are being exposed by Alan.Longbon almost everyday. And also decried by Austrian economists who believe that the government should be the sole creator of systemic money.
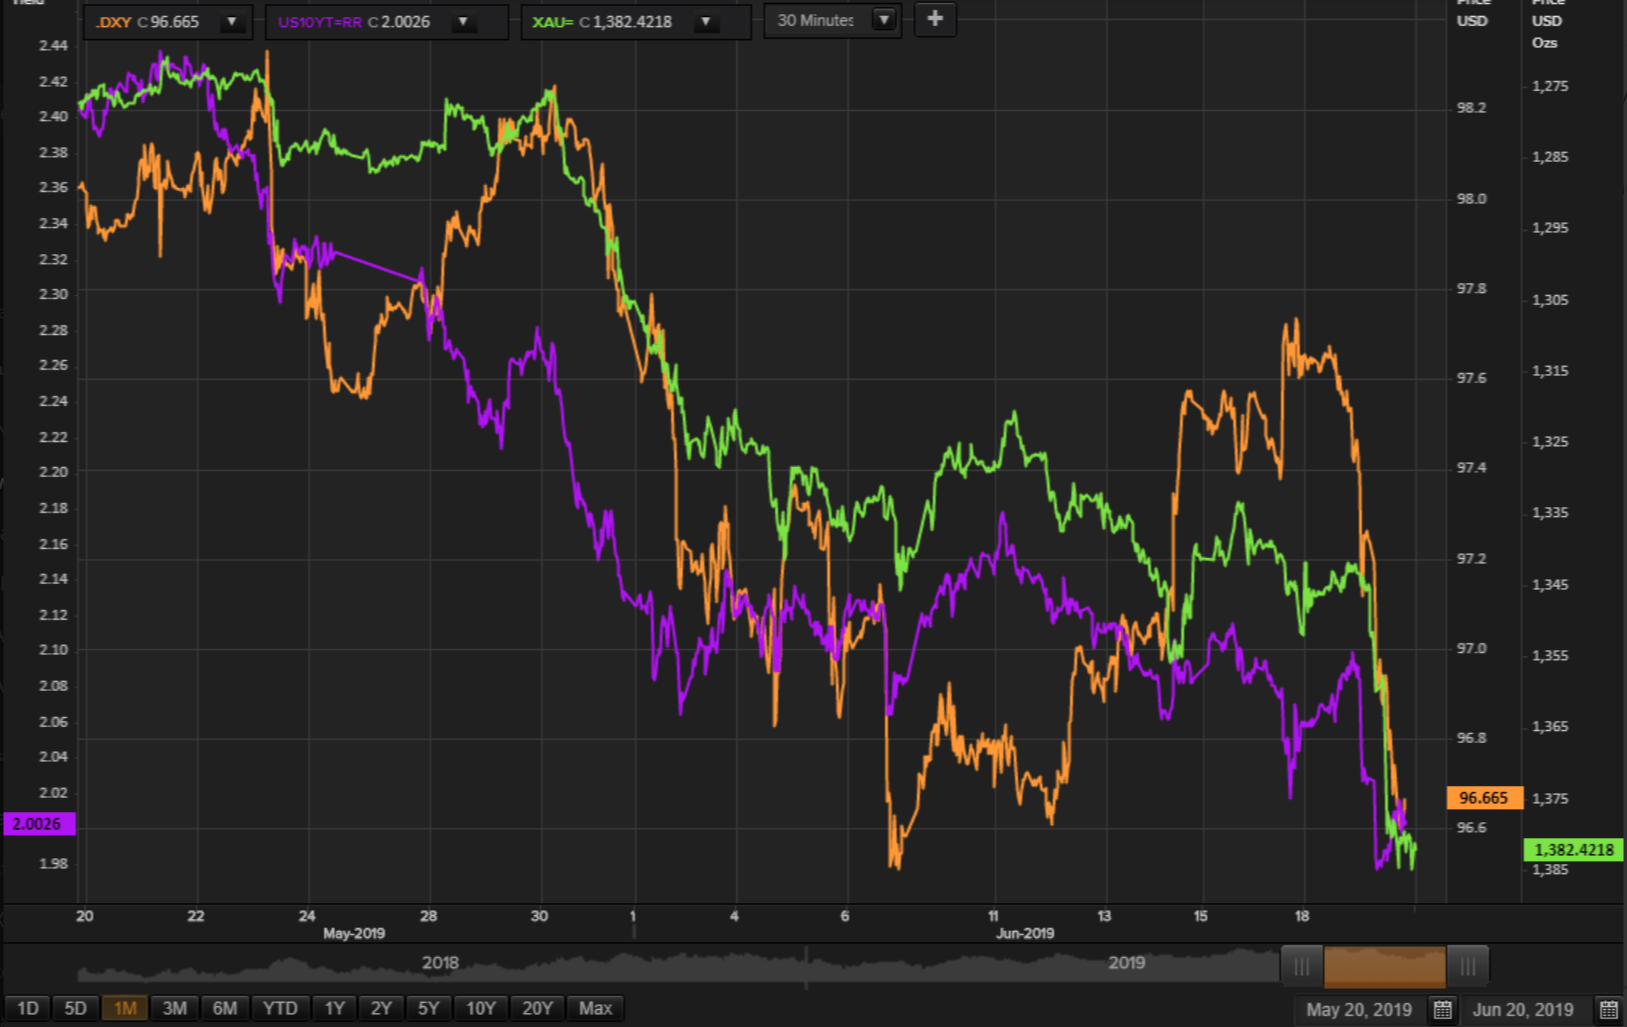
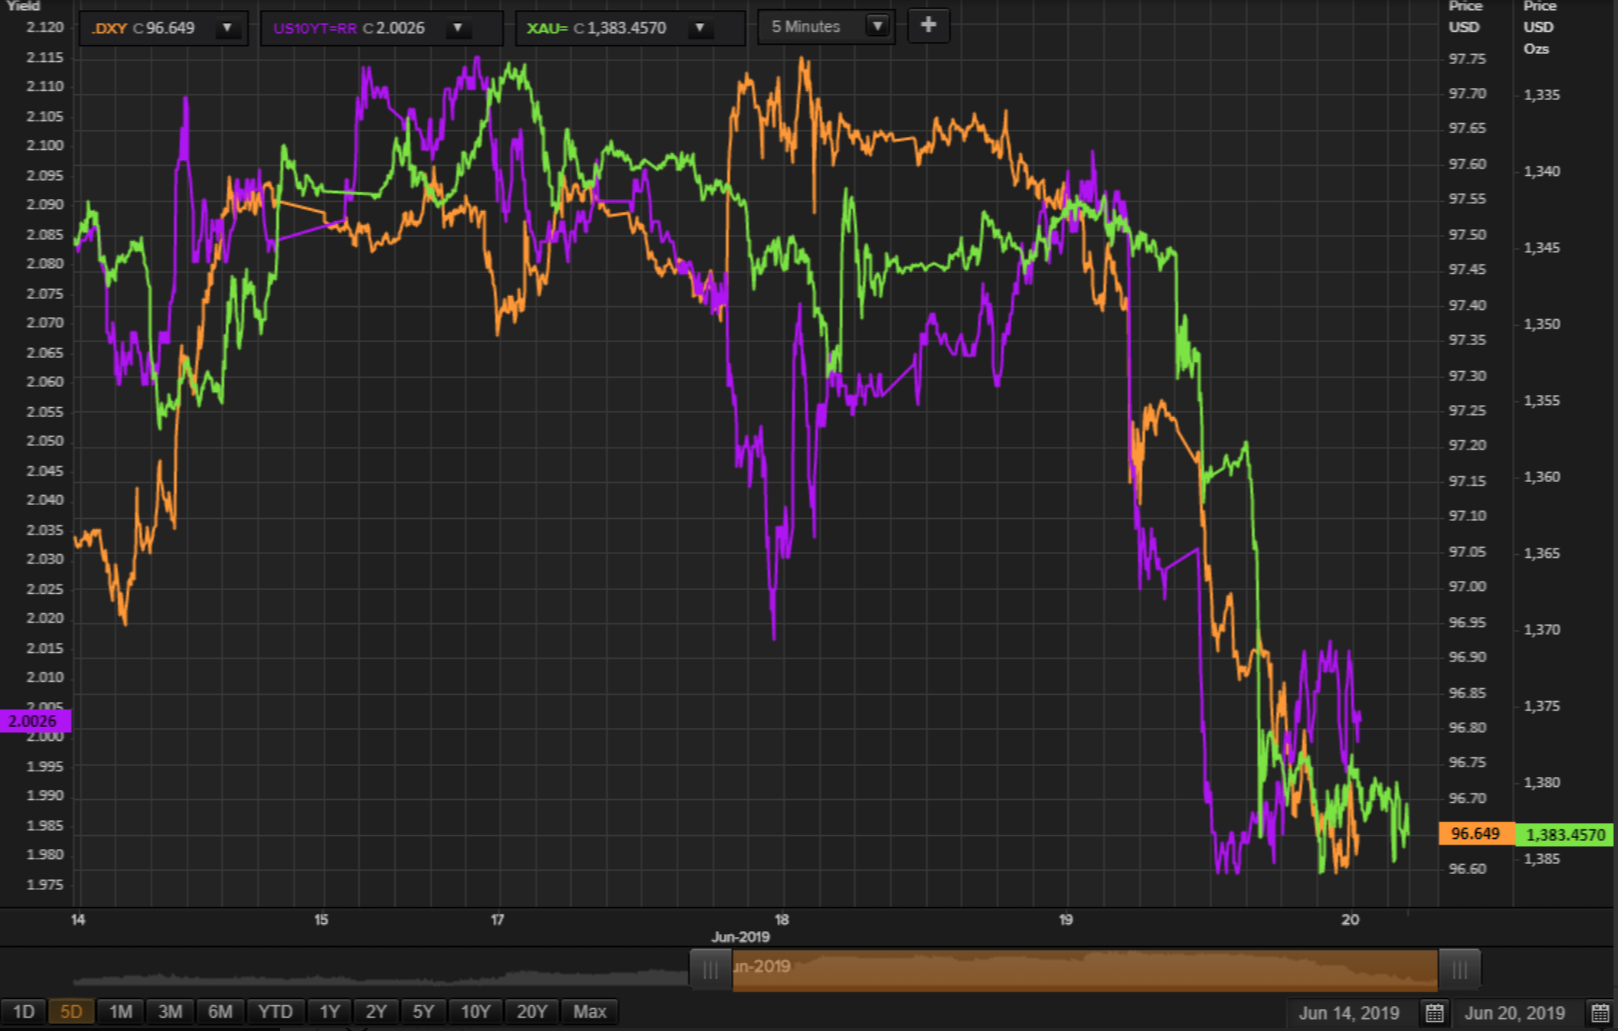
The Gold (XAU) outperformance seems more of a function of the weaker DXY than the fall in yields.
zoomed in
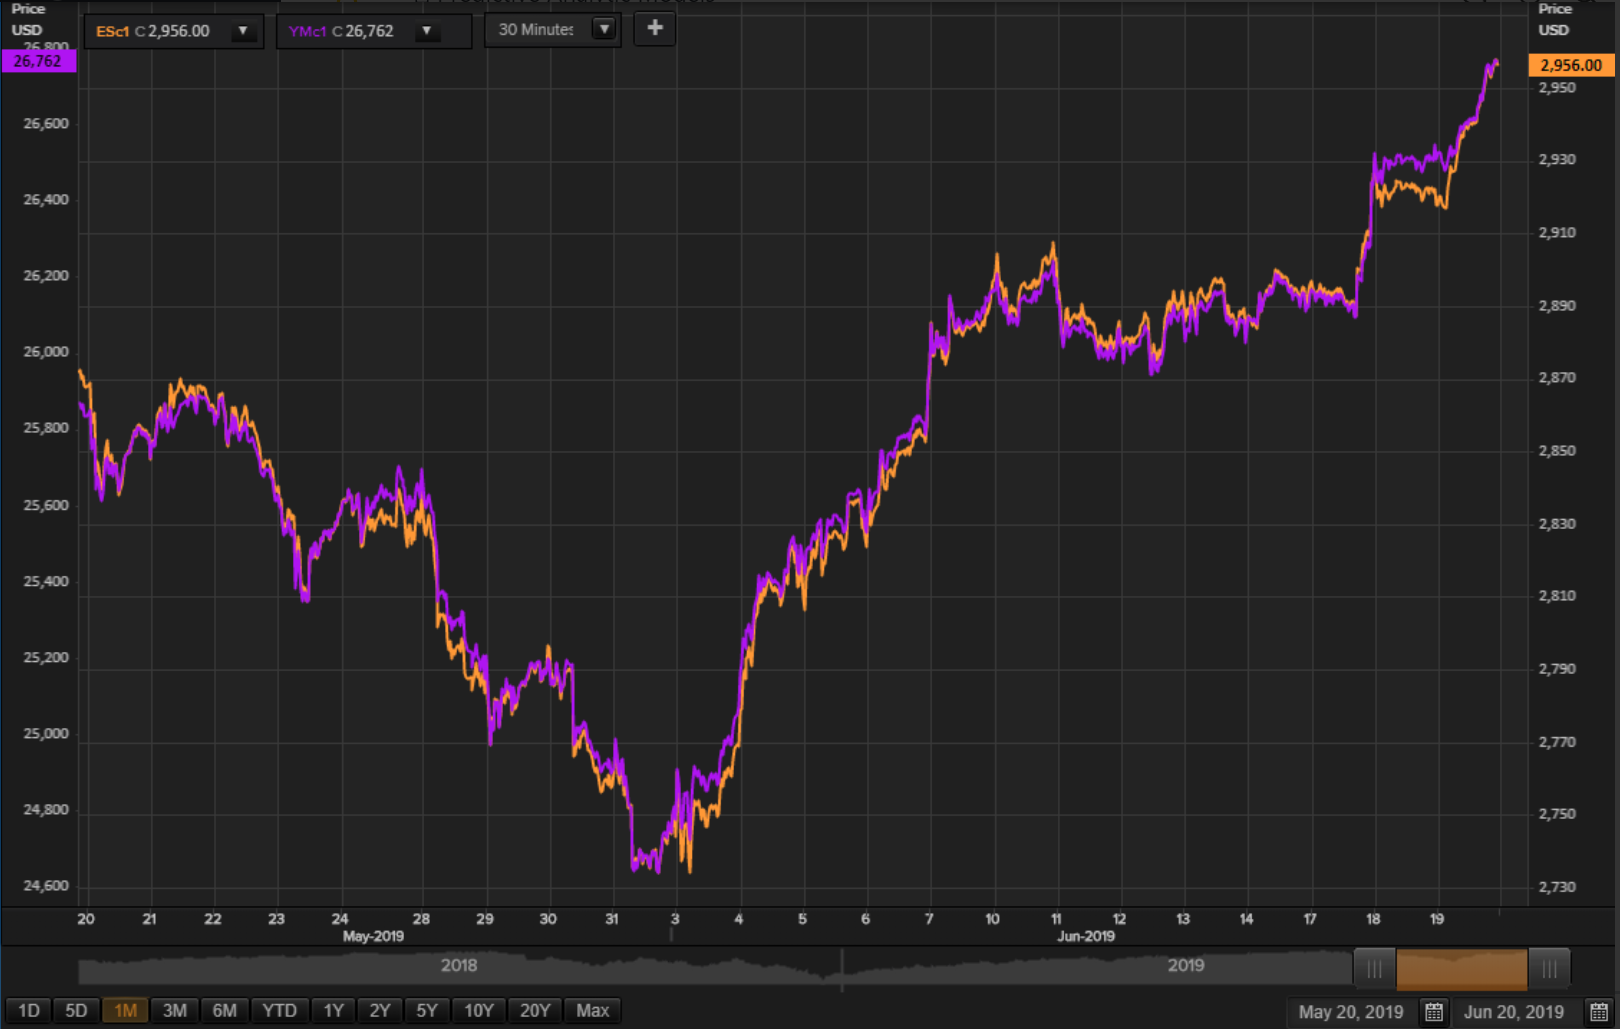
At the rate equities are going, we could see a test of previous highs in a few days.
Excuse me -- we already have eclipsed the previous May 3 highs today.
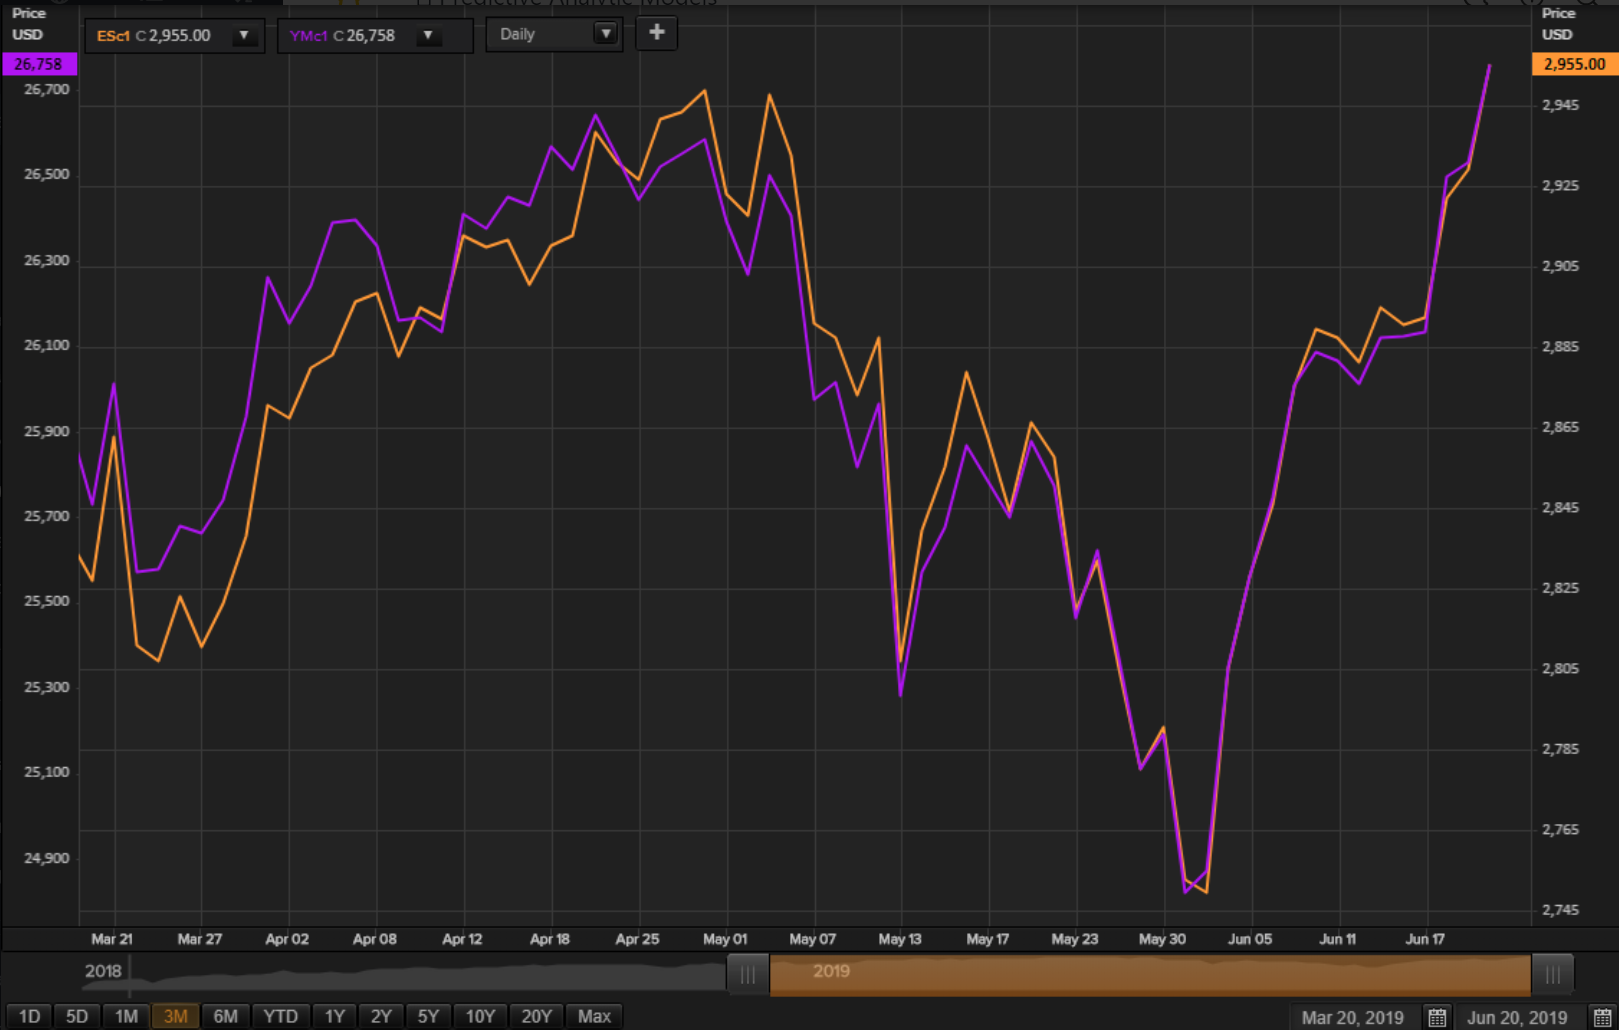
As suspected yesterday, the divergence between falling yields and rising oil prices is already a reality, and probably confirmed today.
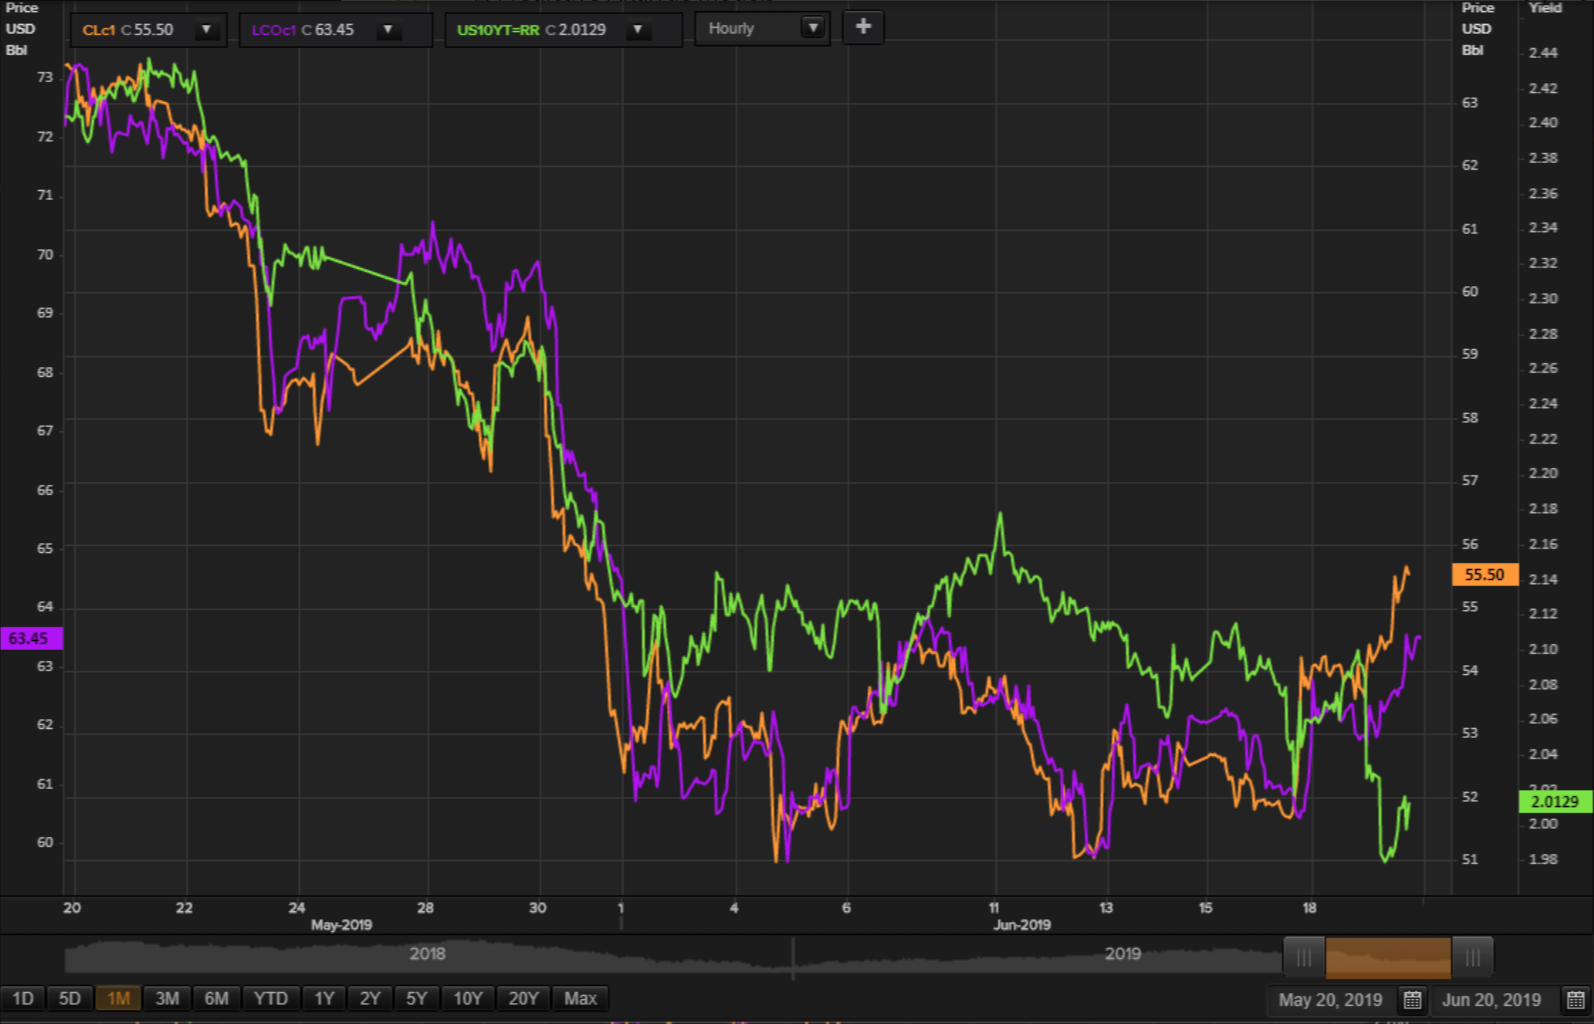
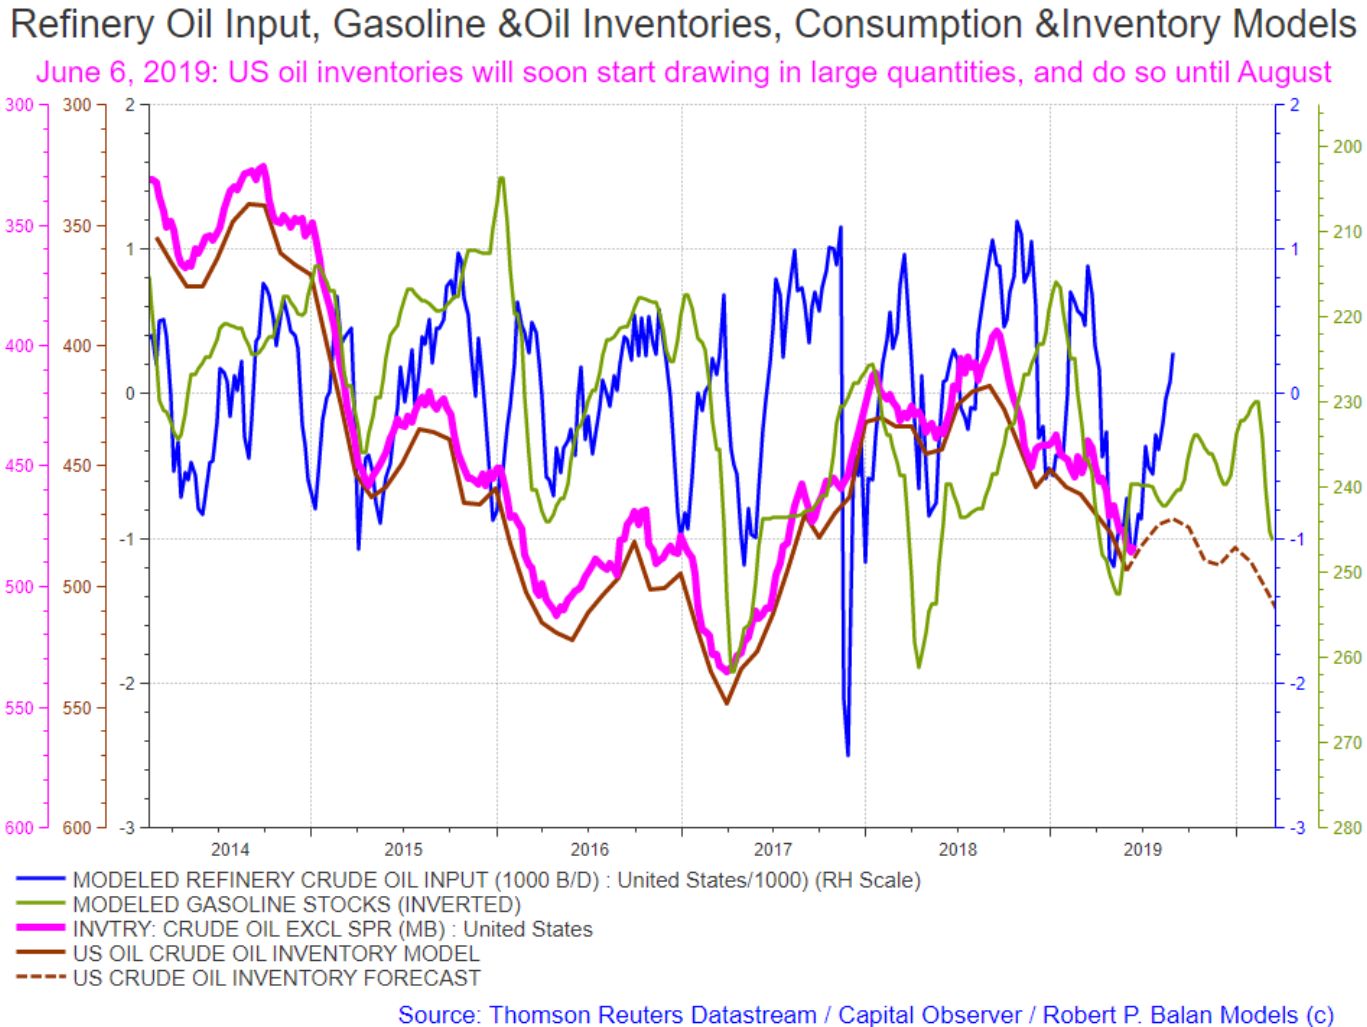
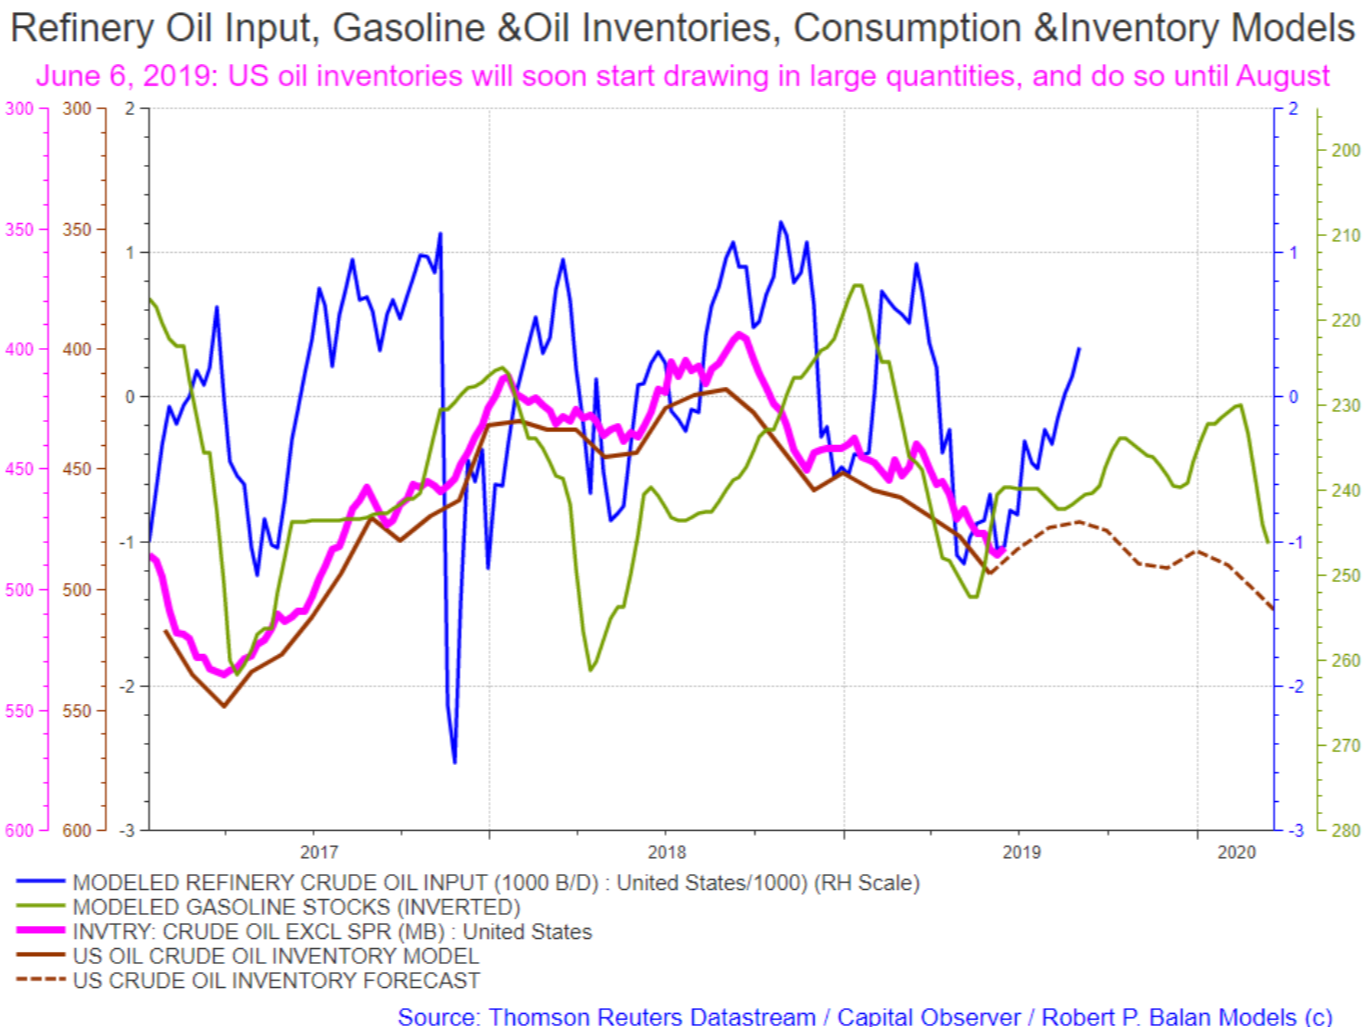
One reason --- the oil inventory situation may have finally found an inflection point -- from now on, most likely we will be seeing draws rather than builds. The link between refinery oil inputs and oil inventories have finally converge.
Zoomed in
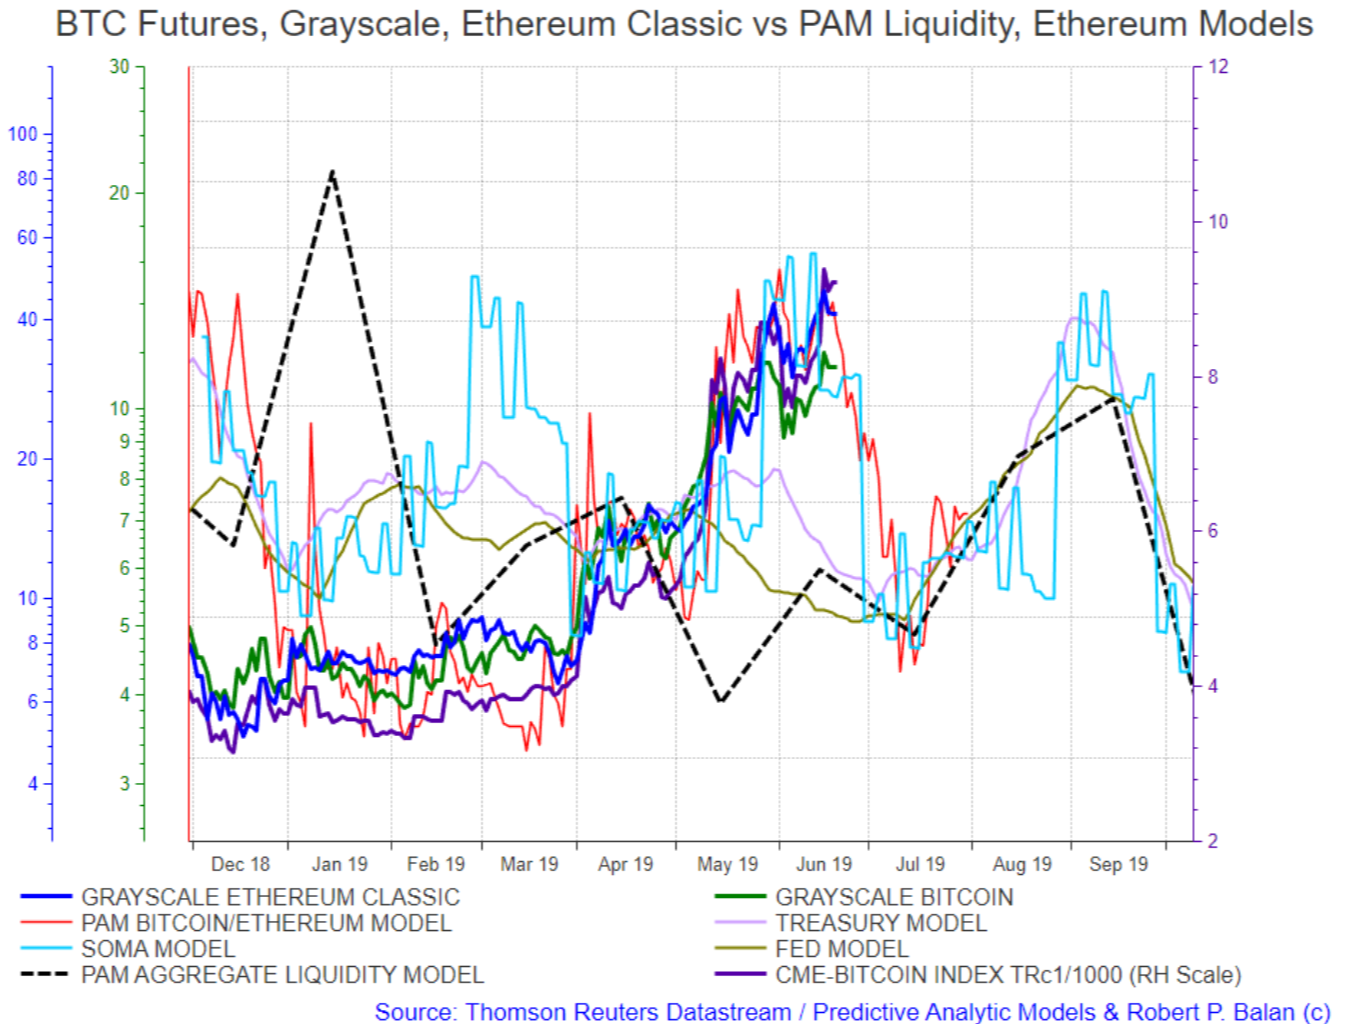
Bitcoin assets should be making new highs over the next few trading days.
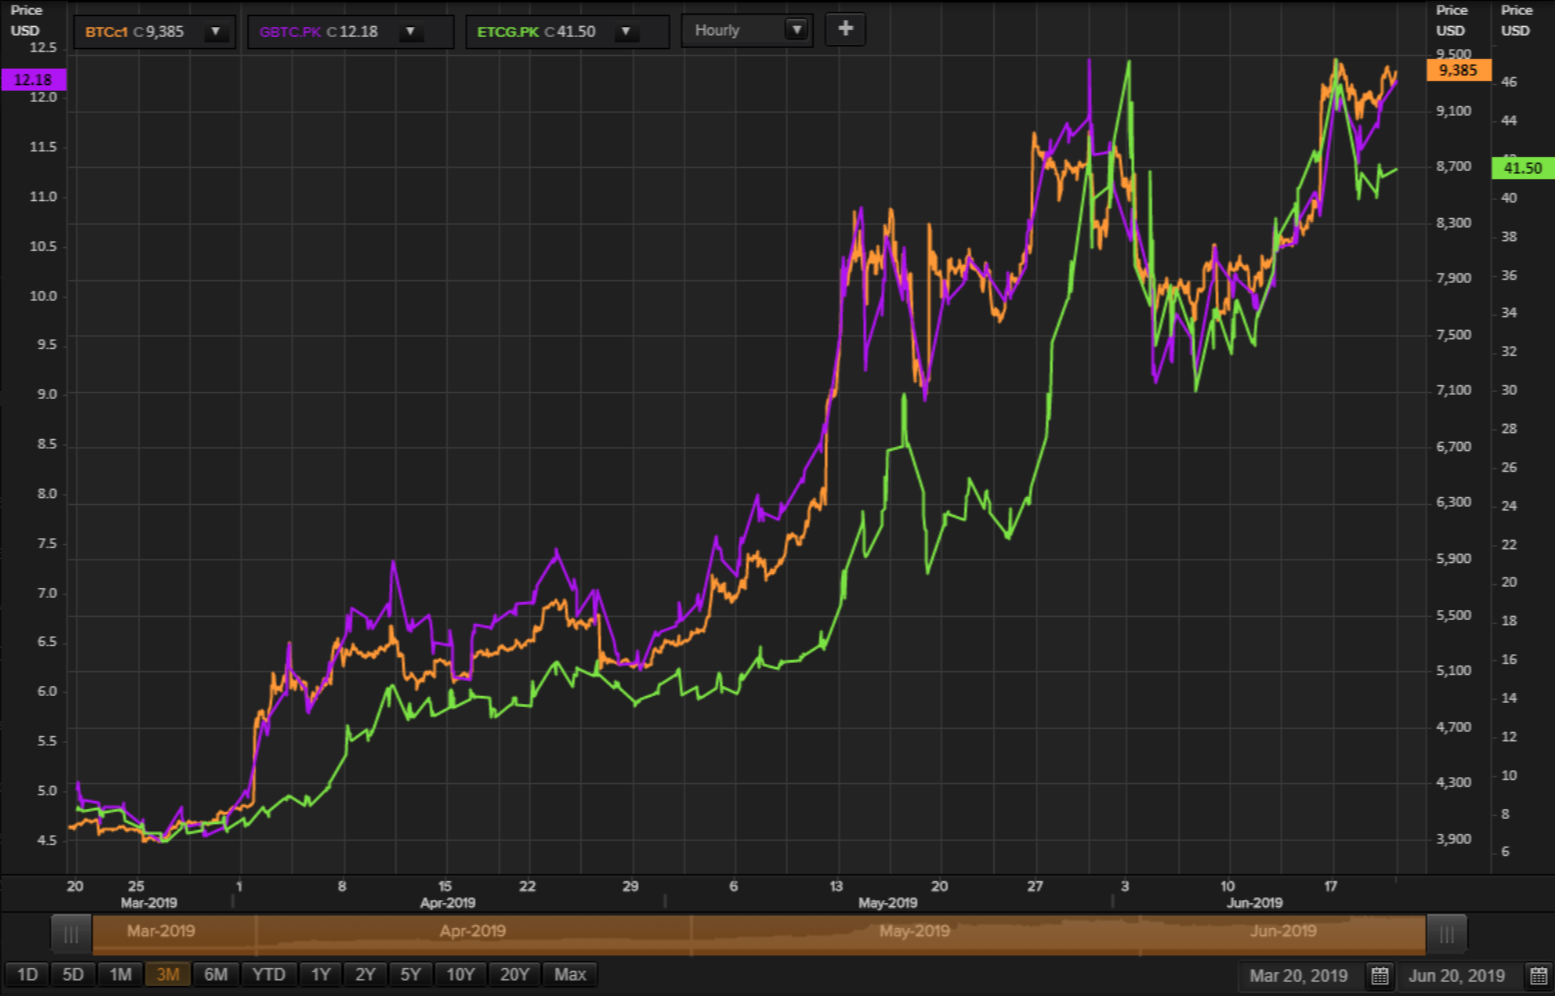
But time may also be running out of the BTC universe. We expect declines to initiate very soon, with a trough expected by mid-July.
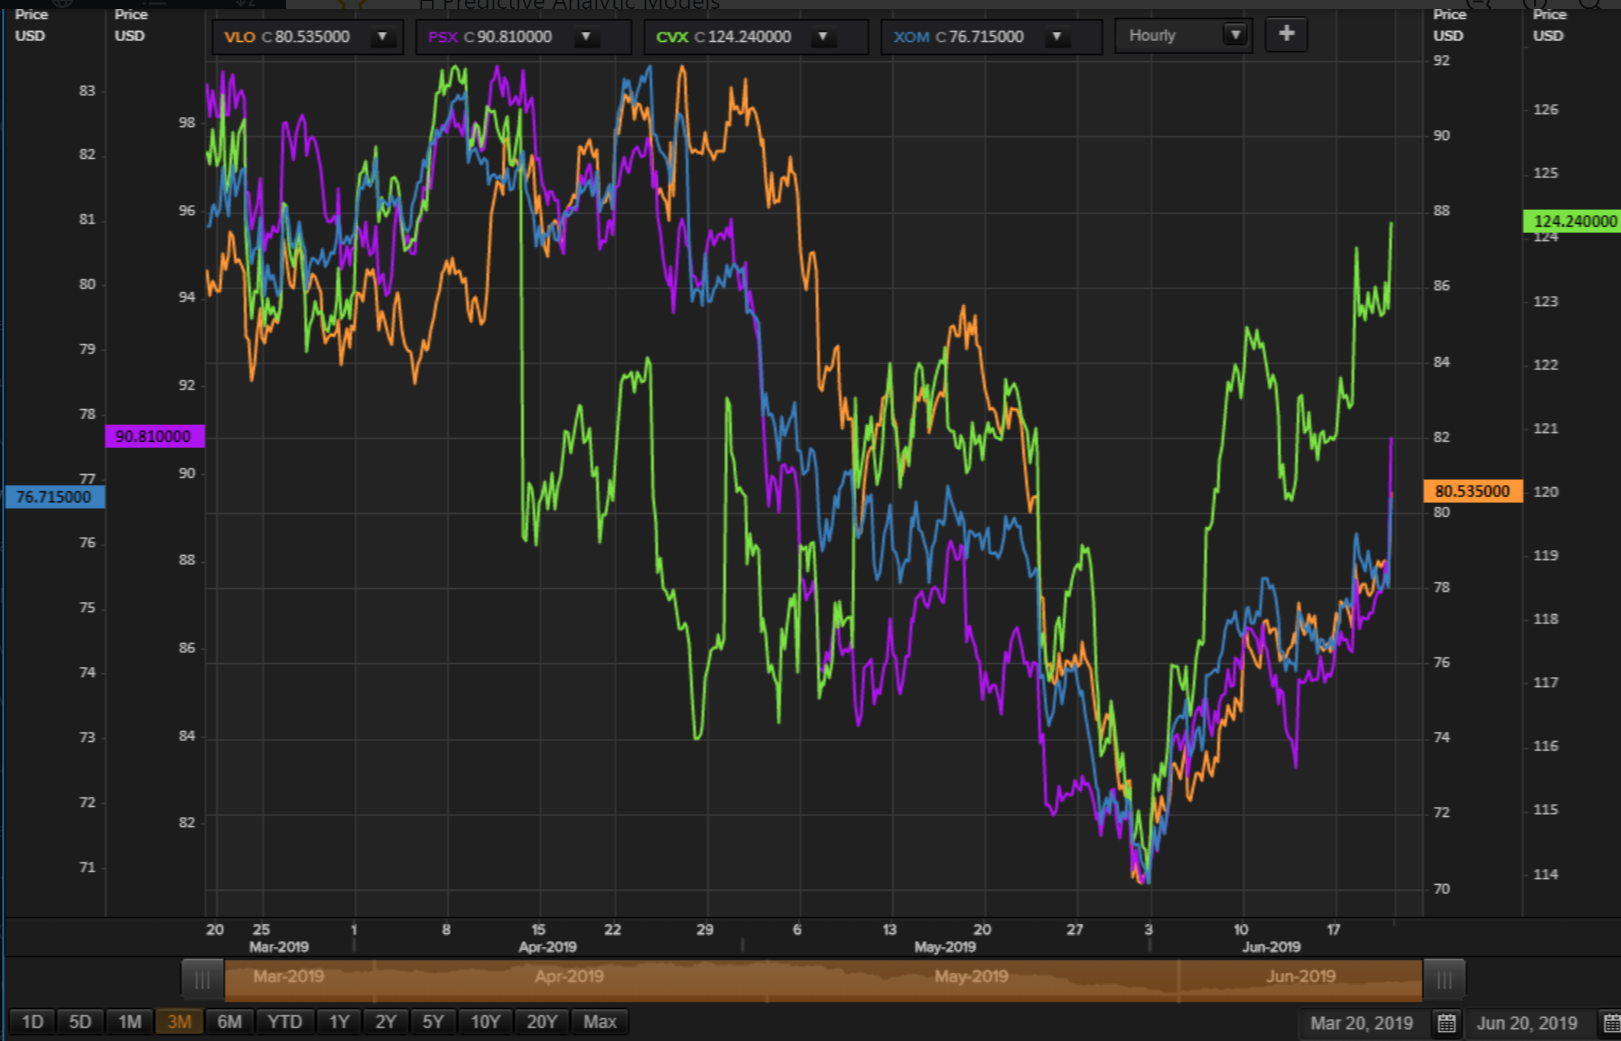
Big gains in early NY trade for energy equities. With the decoupling of oil from yields, the energy equities are free to take a hitch with general equities.
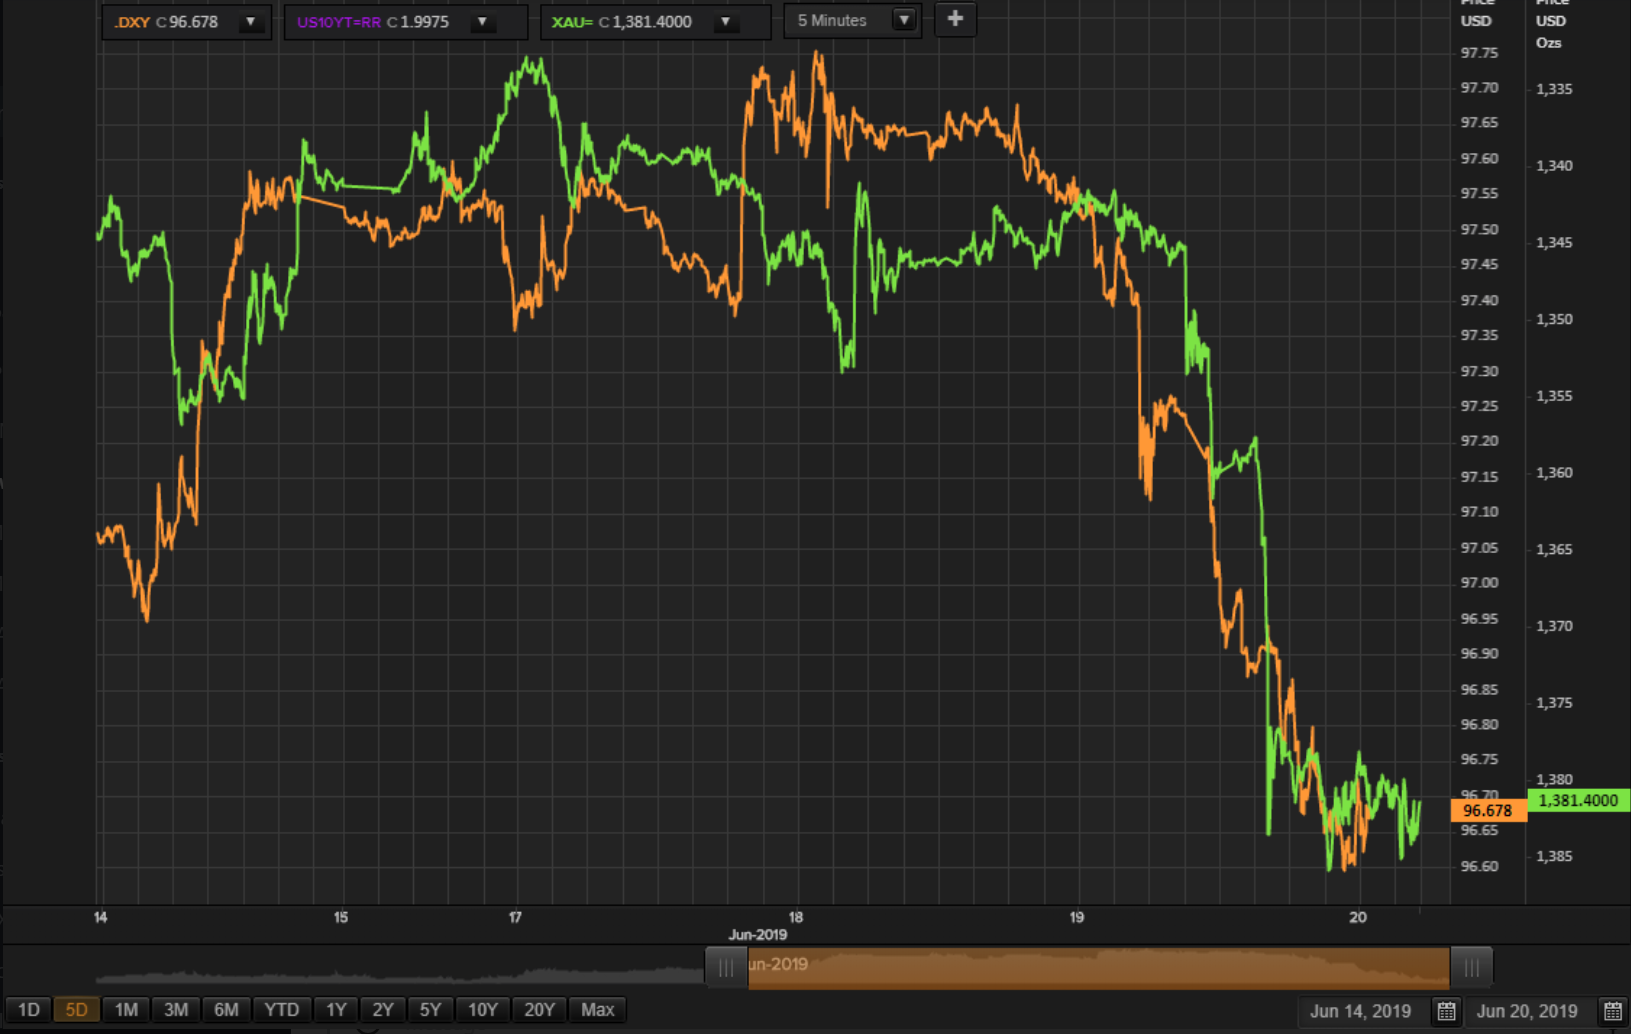
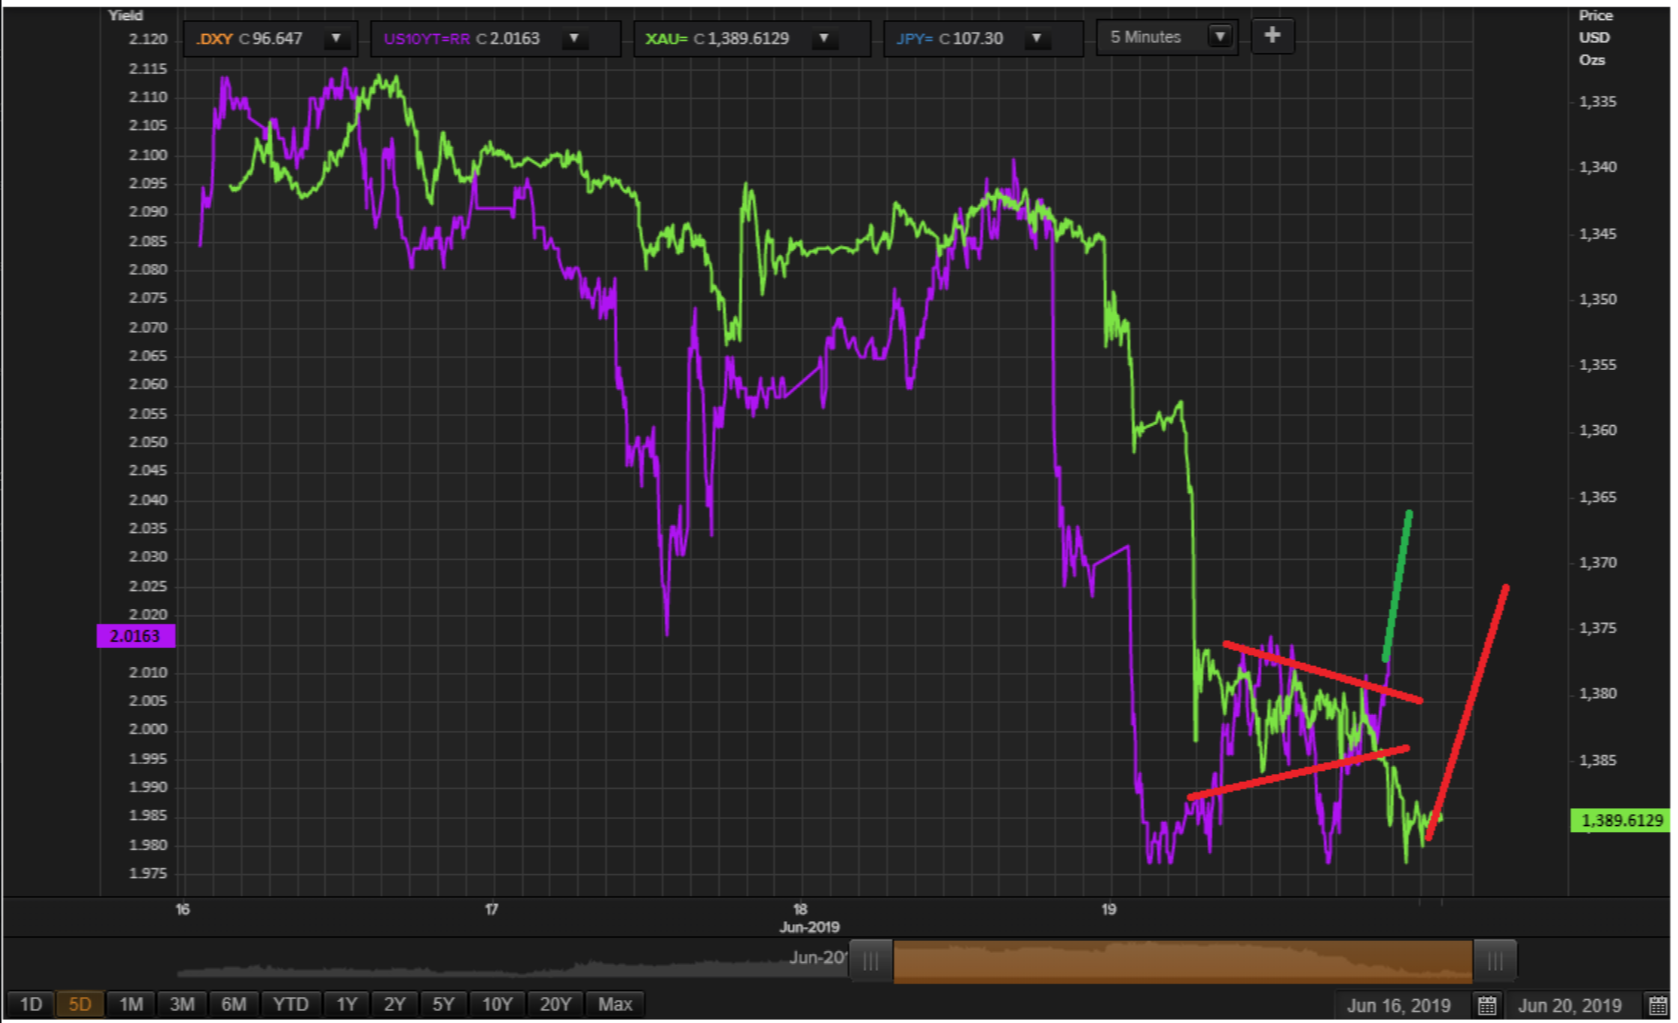
Gold (XAU) seems to be doing a small triangle consolidation pattern, so this suggest we have another upmove in the making for Gold (and downmove in the making for DXY).
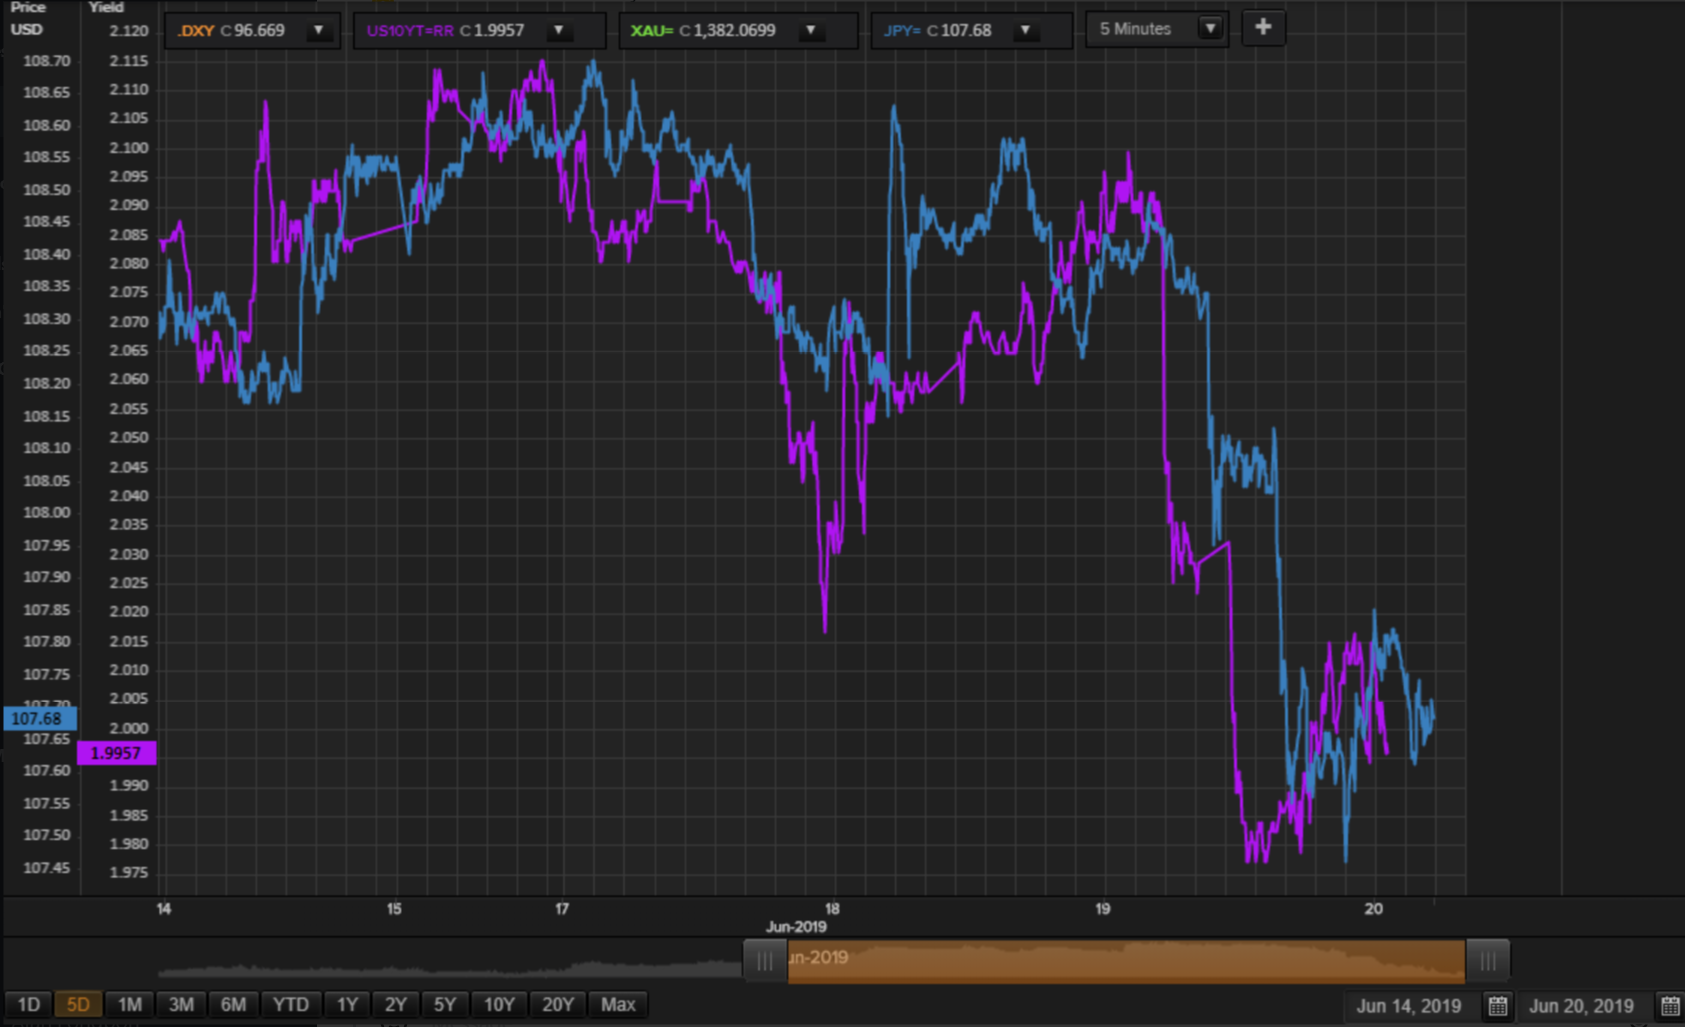
USD/JPY and 10yr yield seem to have another upside follow-through before crucial decision time. Breach of 2.02% seems a crucial event for hopes of rising yields.
There is a lot of cross currents in the markets as risk asset investors are looking for evidences to back up their initial reaction to the Fed statements and to Powell's Q&A responses. I am sure we will see more clarity later today.
Pause for now and resume narrative when we see enough to add to what already been said.
Open for discussions.
vjapn @vjapnJun 20, 2019 4:13 PM
Robert, Can you update gold and bonds possible price paths and if bonds are decoupling from gold as bonds are about flat versus gold being up huge. Thank you.
wc.happy @wc.happyJun 20, 2019 4:17 PM
any Thoughts on getting long GLD Or is the meat up done?
Acetaia @acetaiaJun 20, 2019 4:20 PM
What does Pam think on the developement since yesterday evening and where we are going?
Robert P. Balan @robert.p.balanLeaderJun 20, 2019 4:21 PM
vjapn
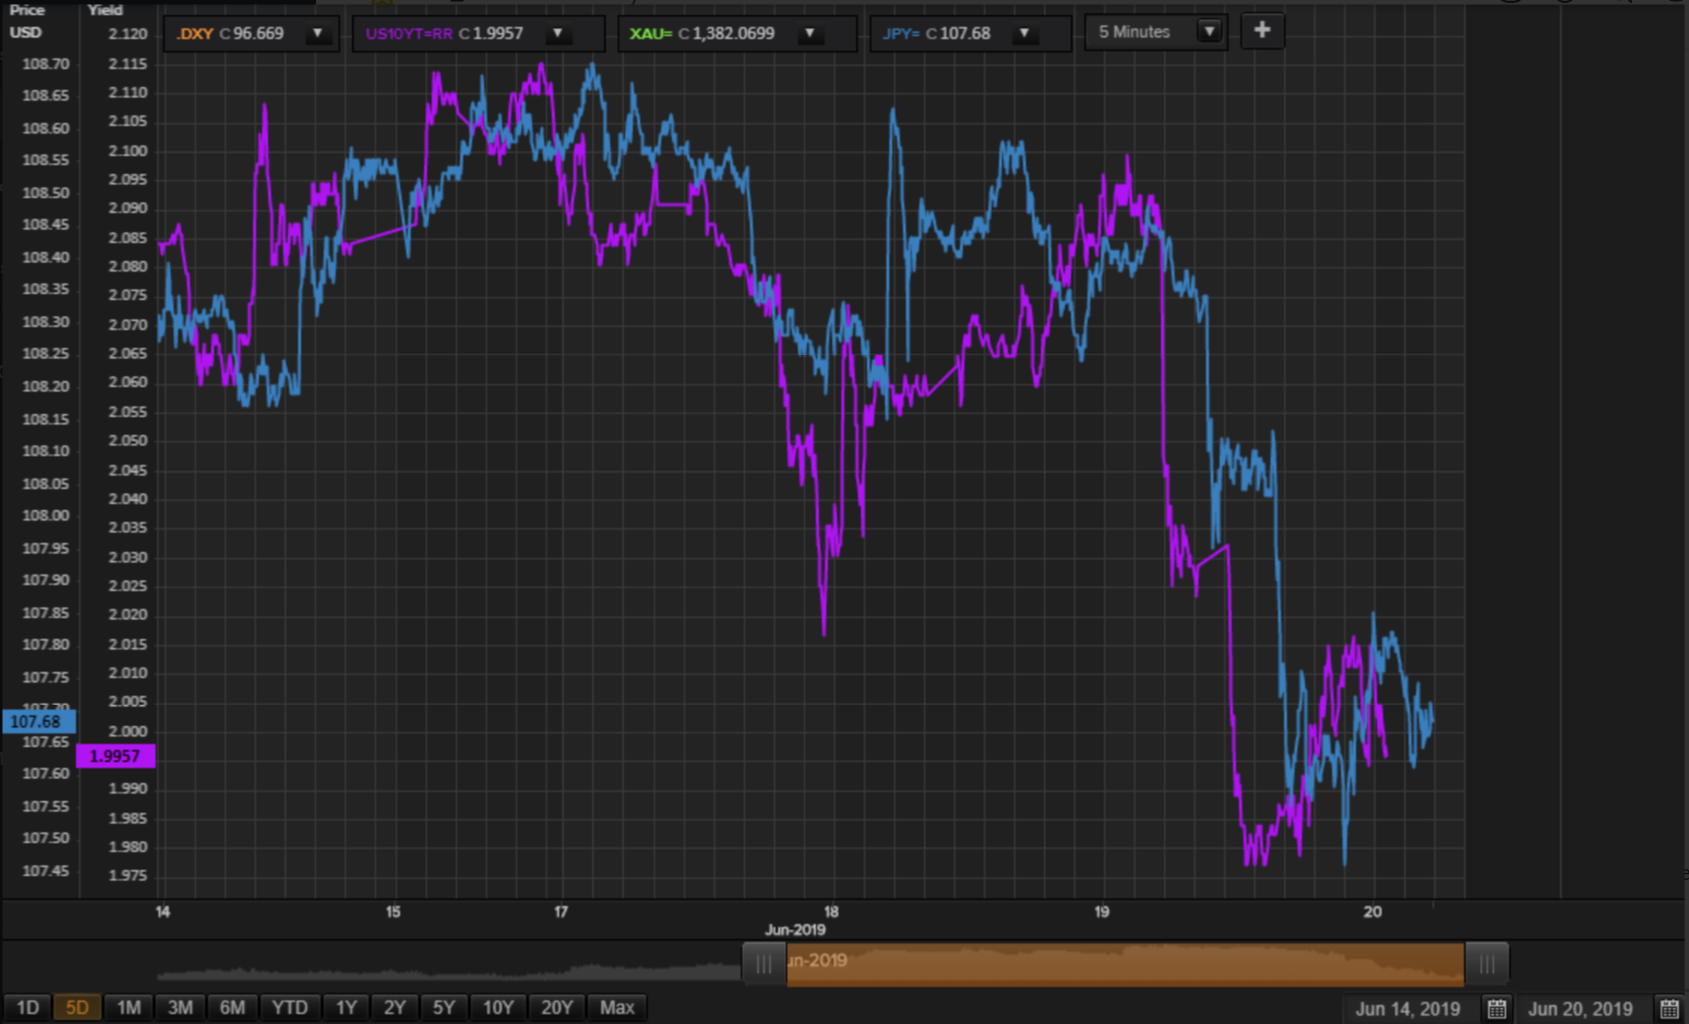
Bonds are linking up with USD/JPY which always lead DXY on the way up or on the way down.DXY is the prime mover of Gold at this point -- gold is not weakening even as yields start to rise. Gold is still getting cues from the DXY. Nonetheless, the key is whether or not yields stabilize and recover some of the sharp decline yesterday. I think we will see that later in the day. I am still amazed that DXY has that outsized decline -- but that is the market for you.
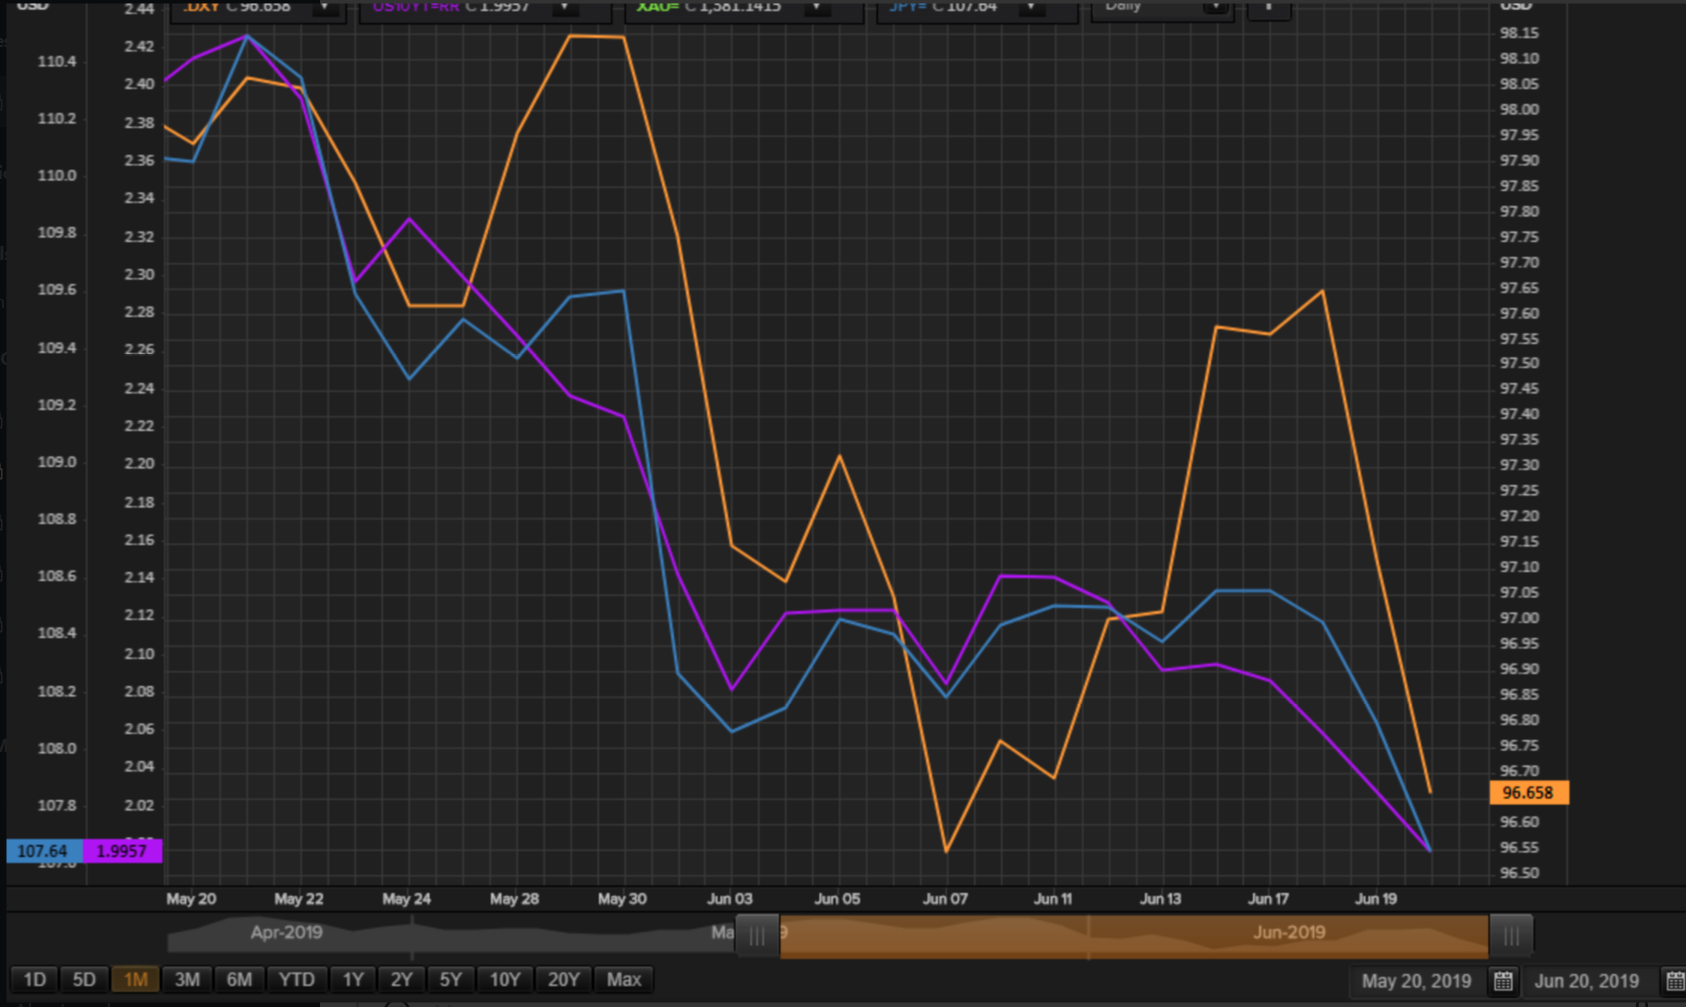
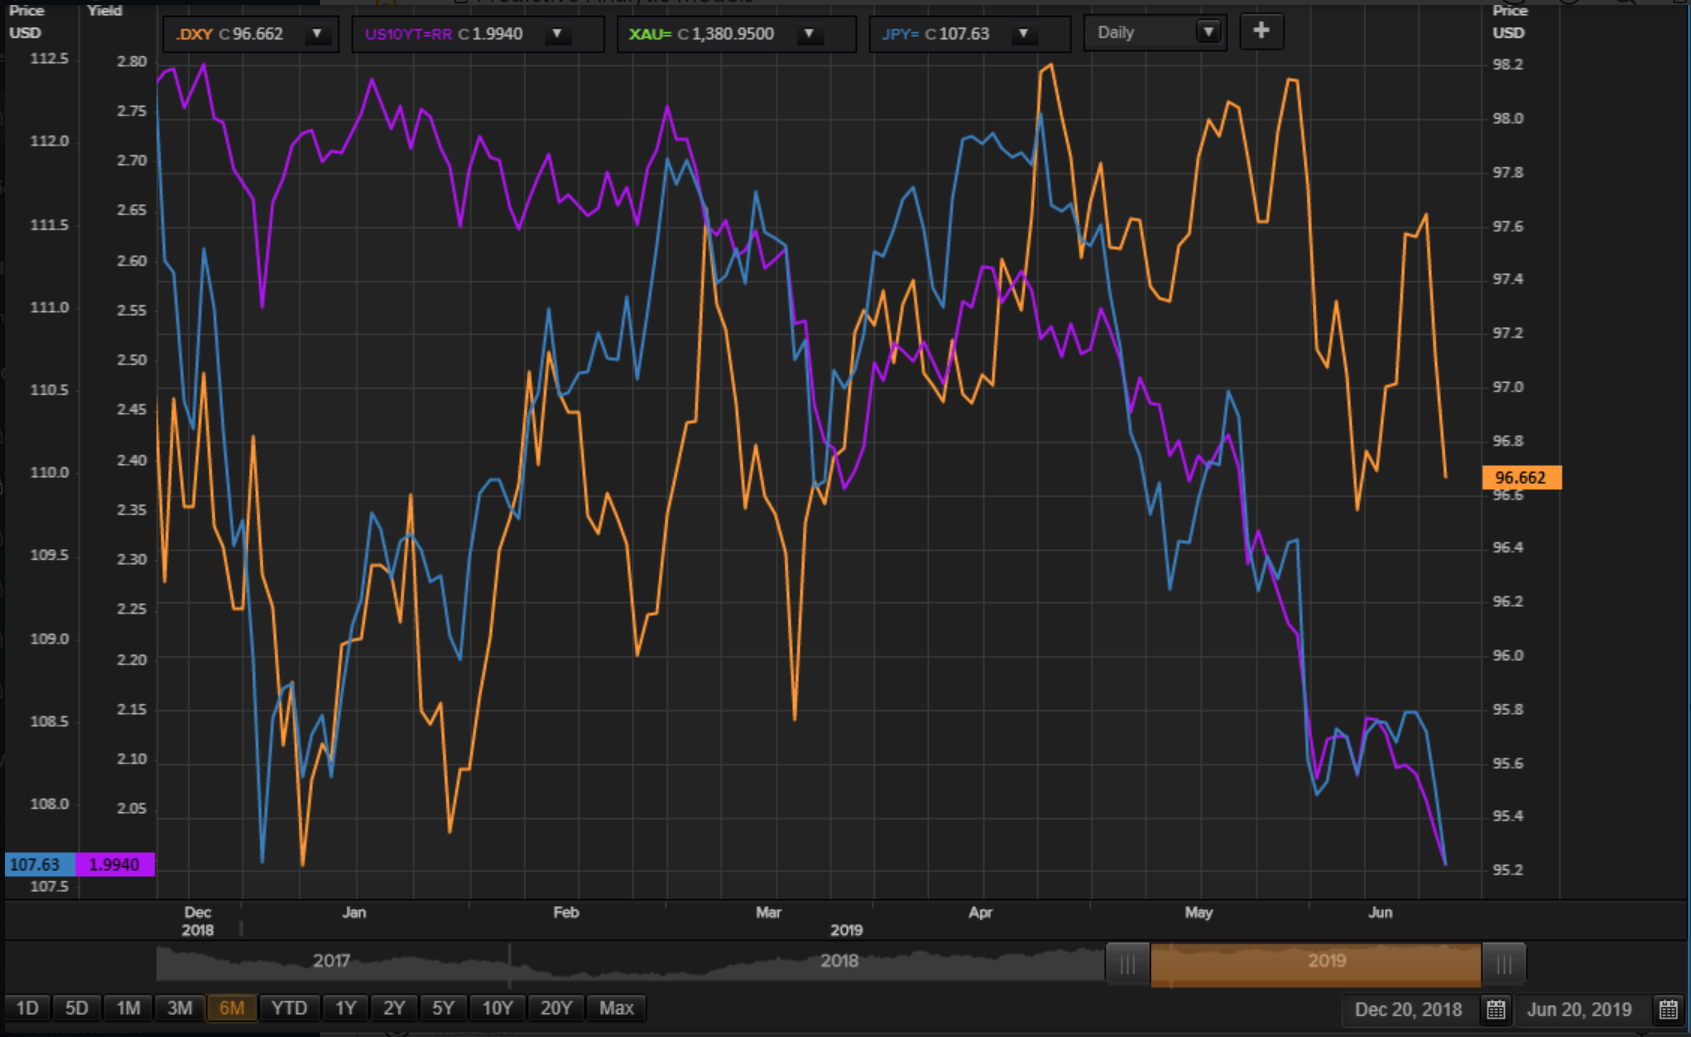
From EWP perspective the DXY moves since the May 30 top remains a consolidation. No legitimate bear market decline (fives waves) has started yet -- all we see are three waves.
On the other hand, yields have already completed is long Wave 3 -- that is why Gold is having a triangle already; triangles are the penultimate consolidation followed by a final dip -- completing the five waves. That is why I hesitate to chase the gold rally, wc.happy
acetaia
For equities, the five-year models as still working well.
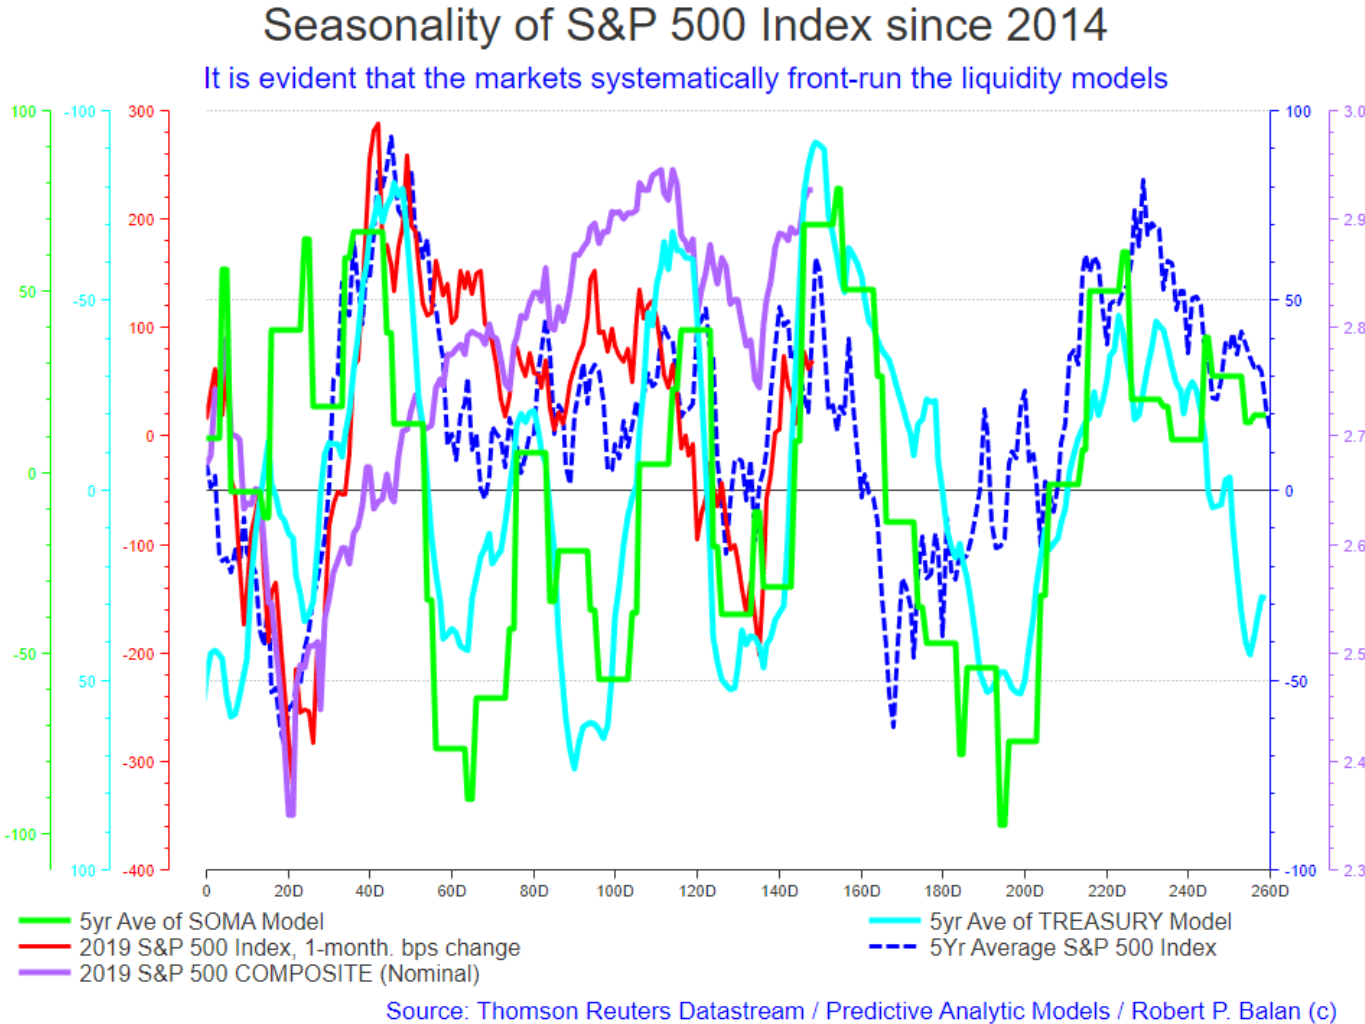
The equity model's last data point was yesterday, and does not include today's. The high in the model is supposed to be reached at Friday's closing. So maybe the intraday high could be Monday, followed by significant declines.
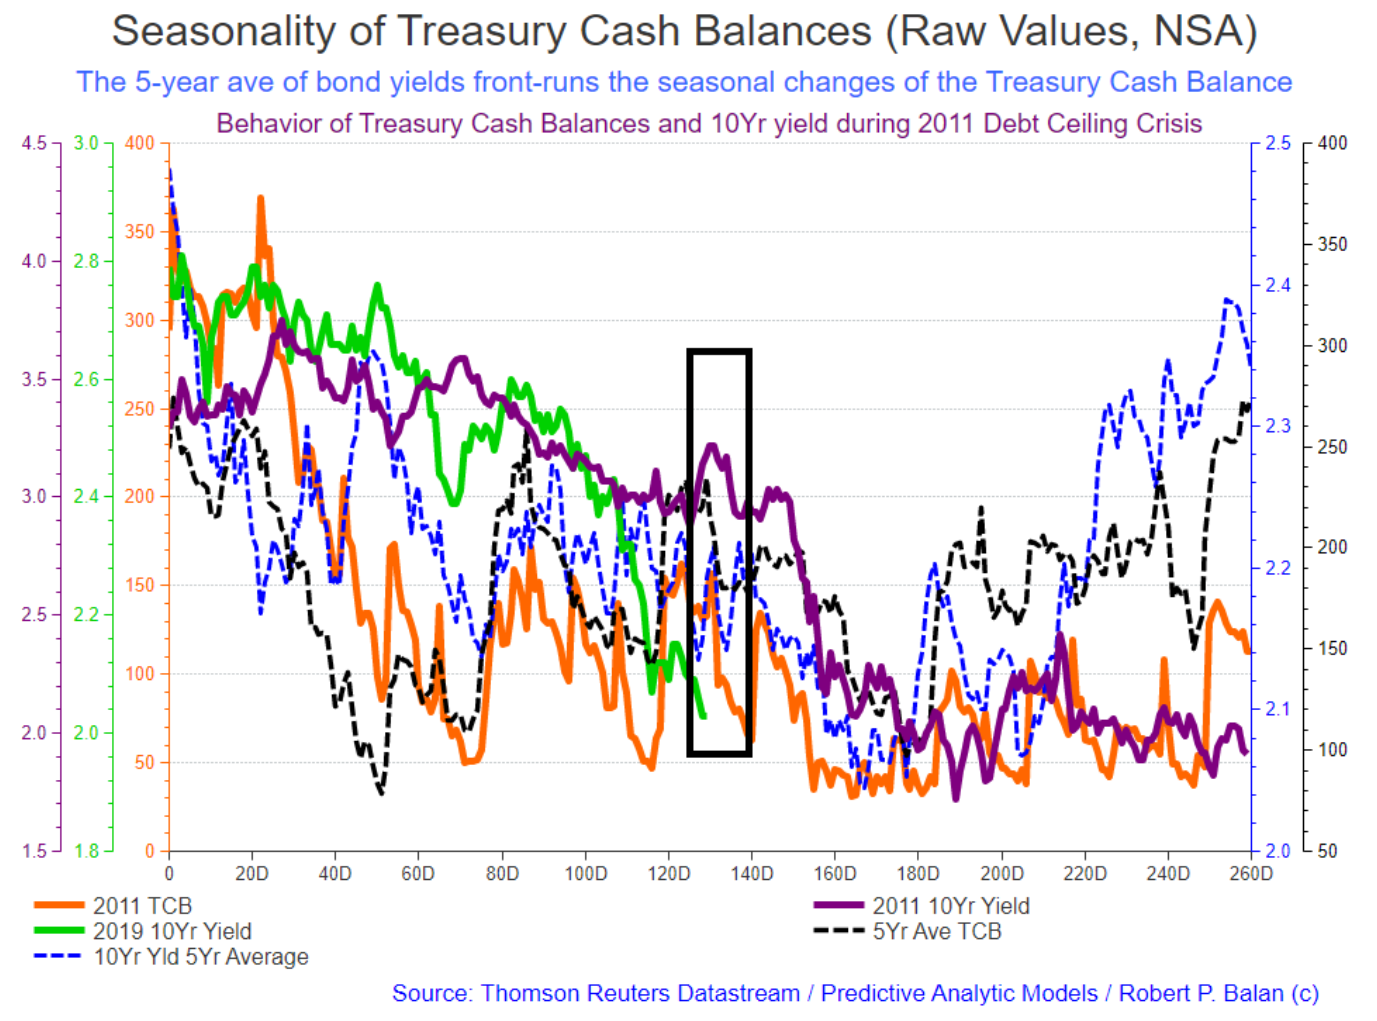
In the last five years (and, at least during the 2011 debt crisis) yields always have an inflection point higher at just about this time -- it can last for at least 4 days to as long as 6 days.
That could be enough to bring on 2.2% or higher -- better levels to protect the short bond trades, and to initiate new near term long bond punts.
The cause is a sudden influx of liquidity into the Treasury Cash Balances, at this period of the year (and during any year), and that has been consistent in the past 20 years.
You will also note that excepting another uptick in H1 July, yields will be declining into a low during the late Sept-early October time frame.
From than point on until January next year (and in any year), yields should be rising strongly.
The prime mover of the decline in US yields has been the inability of the Treasury to borrow (which means dearth of securities supply) which mechanically depresses yields. But once that ceiling is removed, yields bounce back with a vengeance (blue dotted line in chart above).
The dearth of securities supply was further exacerbated by a plunge in systemic liquidity from both the Treasury and the Fed, from early May until Sept-October, with intermediate pauses. See the fall in Treasury Cash Balances from early May to Sep-October.
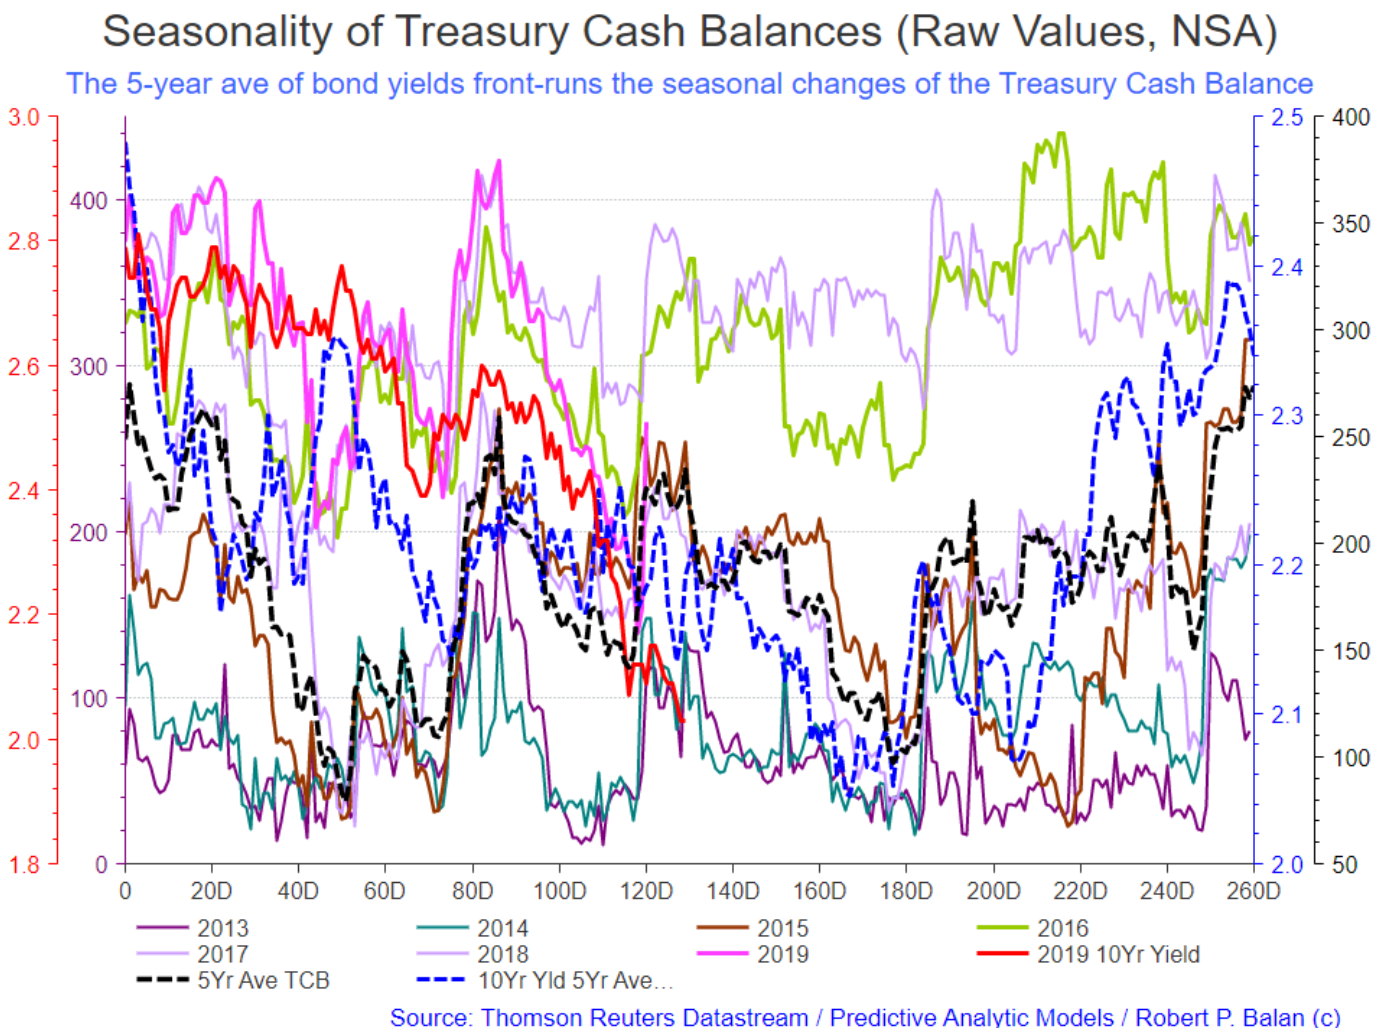
Red line is the current 2019 10yr yield. Blue dotted line is the five year average of the 10yr yield. Black dotted line is the 5 year average of the seasonality of liquidity from the Treasury. The current year movement in yield is NOT much different from historical moves, but is exaggerated by the dearth of securities supply.
JdEFP @jdefpJun 20, 2019 5:14 PM
robert.p.balan - From an EWT standpoint, do you still see ES at the top of a large Wave 2 irregular after a May Wave 1? Or, do you see that wave pattern having changed now?
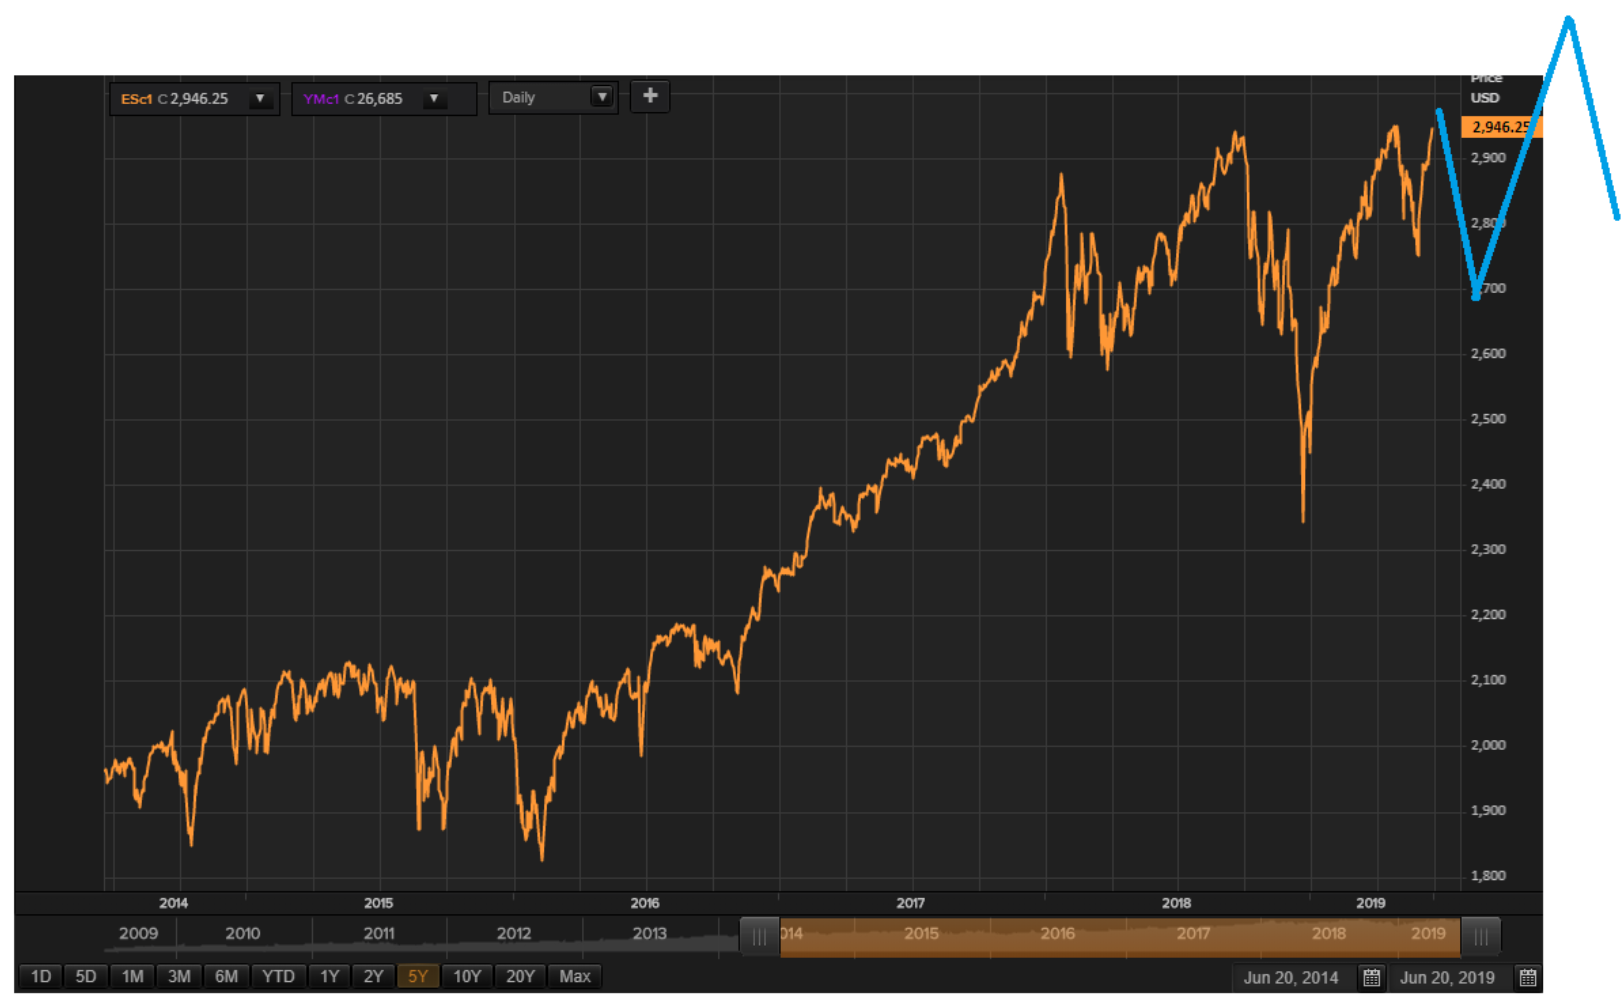
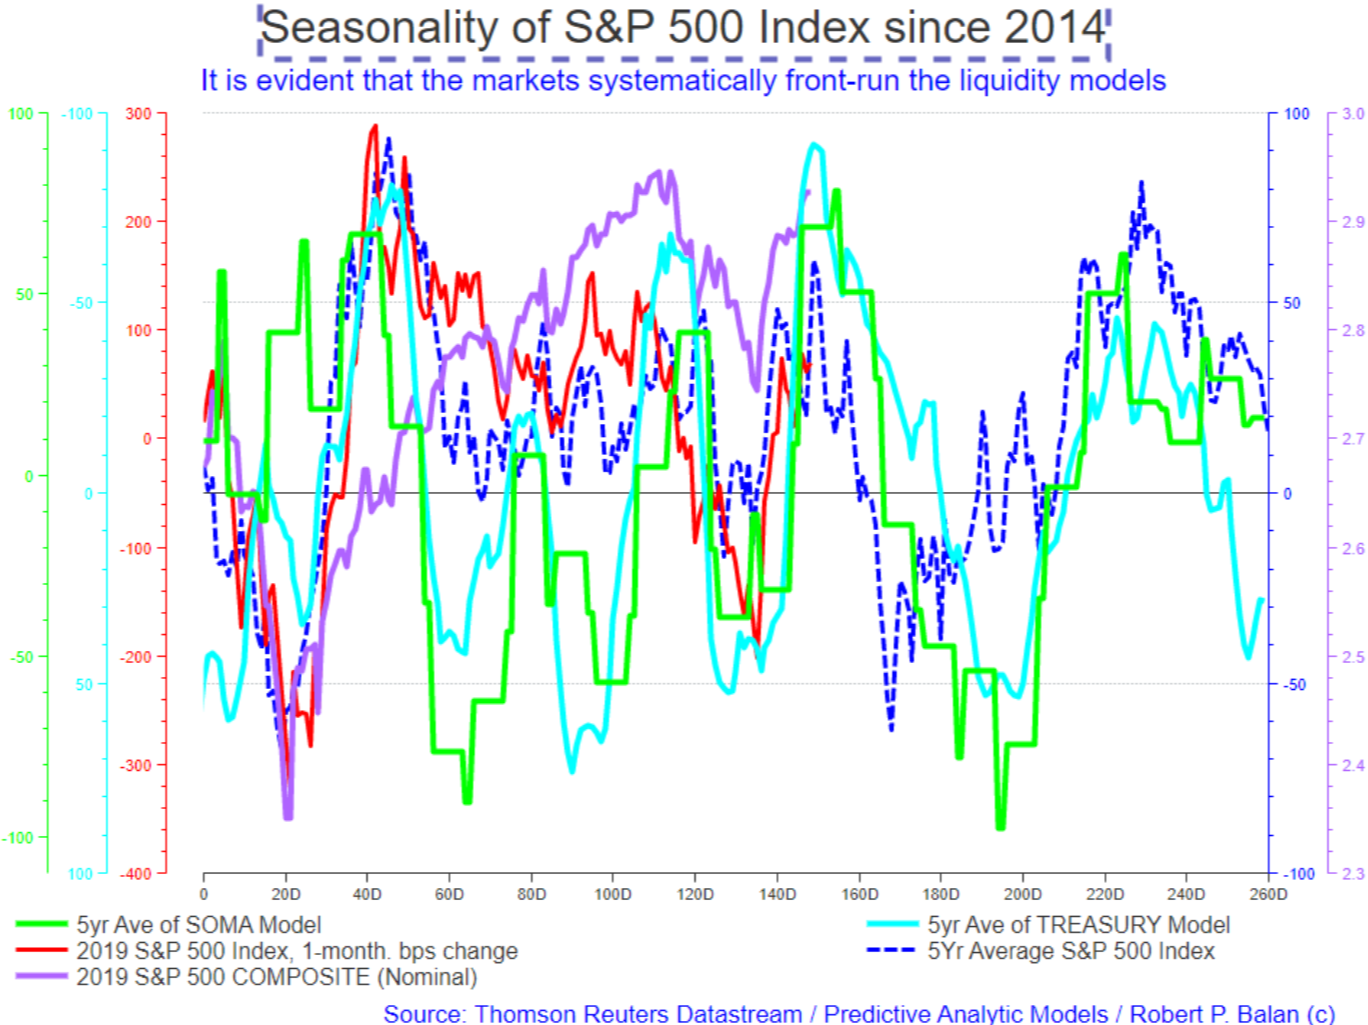
The previous chart with the EWP schemata is what I see in the SPX five-year average performance model.
JdEFP @jdefpJun 20, 2019 5:29 PM
So, it is your current opinion that from here we could be making lower lows as compared to May then go to higher highs after end of July?
That is a precise description of the EWP schemata. What makes it compelling IMO is that 2019 SPX so far is almost exact replica of the 5-yr average of the SPX. It's a better argument than anything I can present.
JdEFP @jdefpJun 20, 2019 5:35 PM
Thanks, Robert. And, understood. I'm just trying to fit what the model is telling us into an EWT reconciliation.
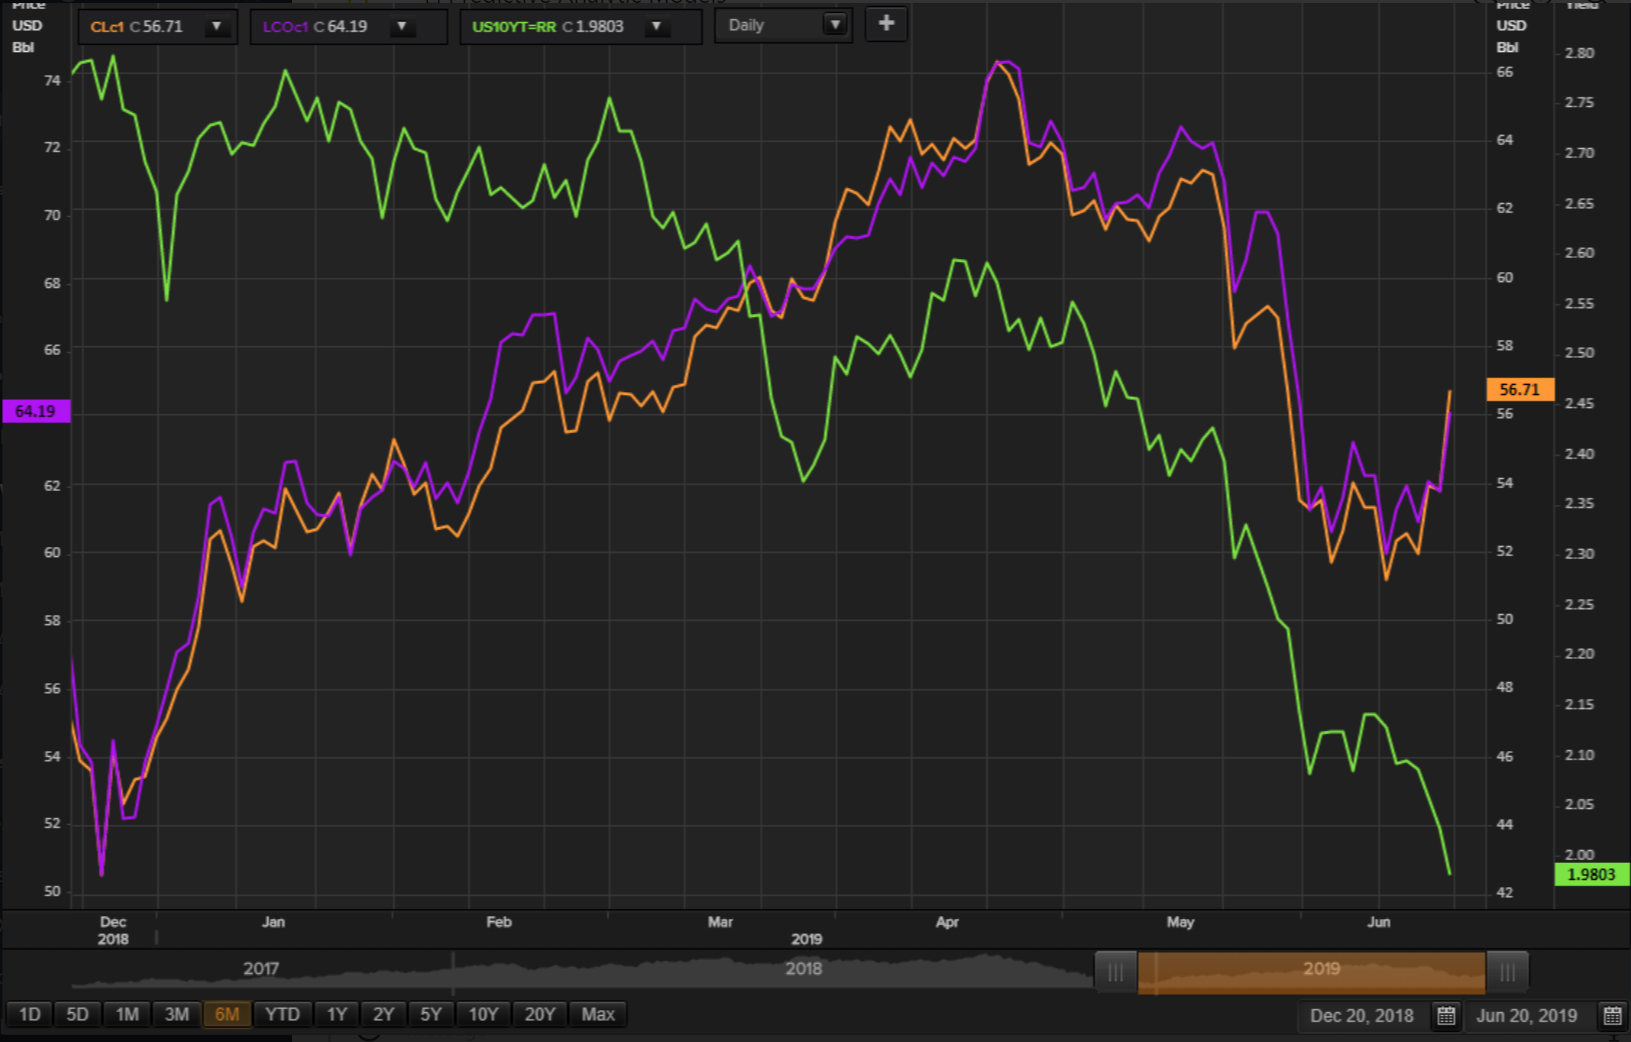
This is the confirmation of the decoupling of oil from the clutches of the US bond yields. We will initiate GUSH, crude, and product longs when we see a pullback in the oil prices. We will list the instruments we want to use at the Prospective/Current Trades spreadsheet.
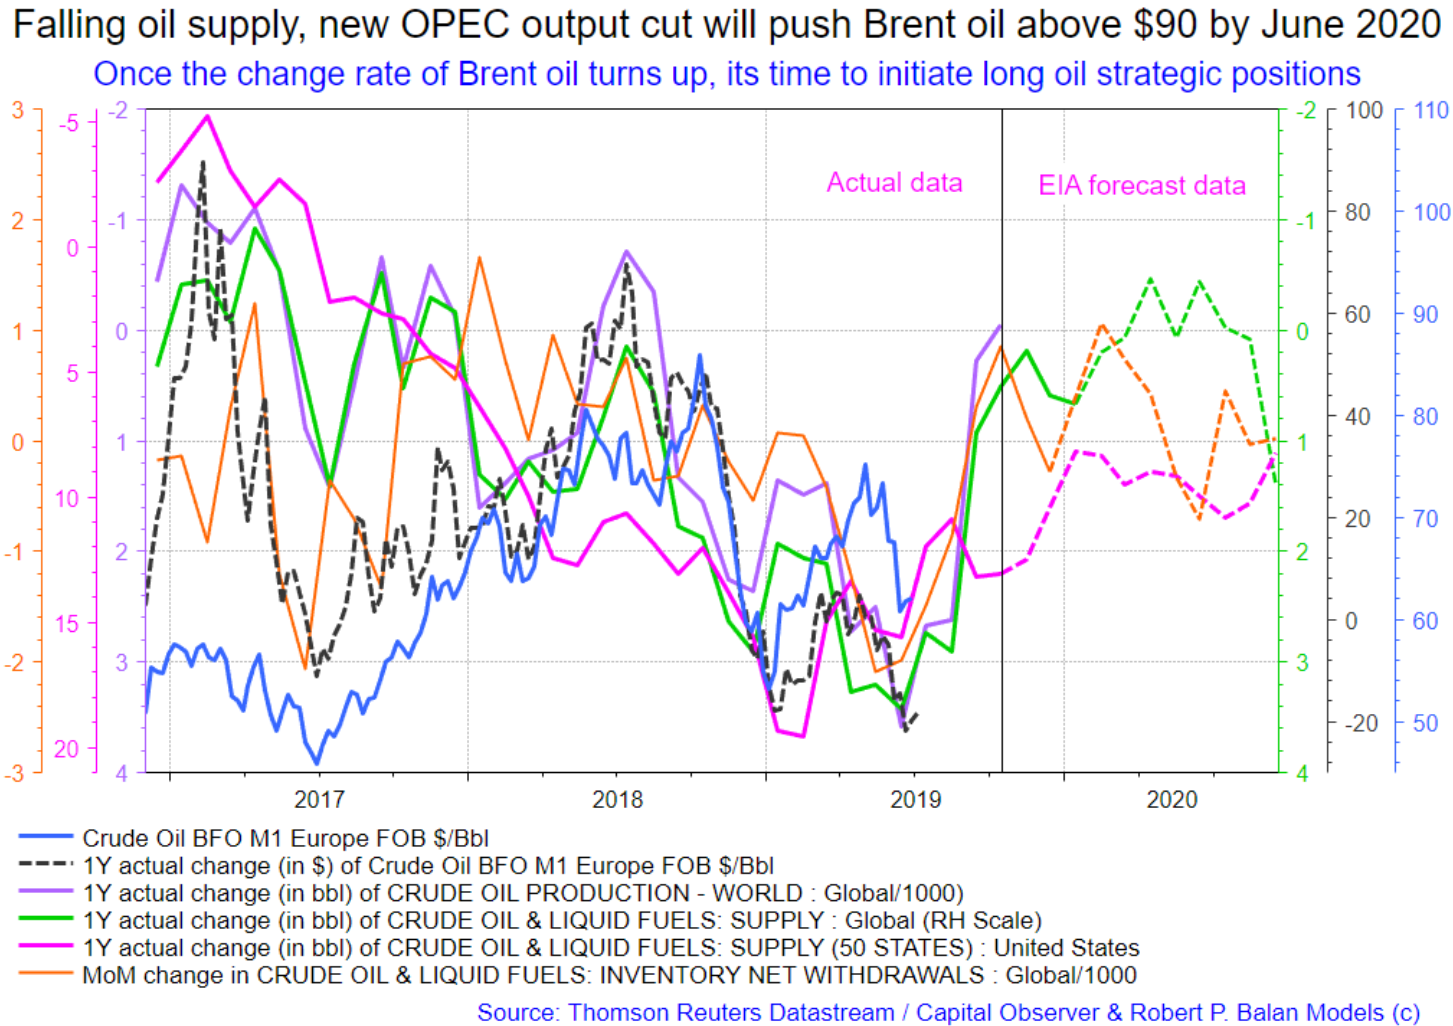
And, by the way, the crude oil model has already provided the inflection point that we have been waiting for.
Here is what Mr. Kiser wants to do:
USLV (Velocity 3x Long Silver ETN) USLV x 2 tranches $62.14 USLV 67.42 $5.28 8.50%
USLV (Velocity 3x Long Silver ETN) USLV x 2 tranches $64.10 USLV 67.42 $3.32 5.18%
GLL (-2x Gold ETF) x 3 tranches GLL $67.98 GLL 63.5 -$4.48 -6.59%
JdEFP @jdefpJun 20, 2019 5:54 PM
Is that some kind of ETF based straddle??
Or, are you saying PAM wants to close these positions? ... Sorry.
Robert P. Balan @robert.p.balanLeaderJun 20, 2019 5:57 PM
He wants to offset the GLL (-2x Gold ETF) x 3 tranches GLL $67.98 GLL 63.5 -$4.48 -6.59%with the USLV (Velocity 3x Long Silver ETN) x2 tranches USLV $64.10 USLV 67.42 $3.32 5.18%so PAM only has USLV (Velocity 3x Long Silver ETN) x2 tranches USLV $62.14 USLV 67.42 $5.28 8.50%left in the ledger. So no worries, and we only have to track the long PM trade. The problem I have is that I really feel that Gold is over-extended. But this maneuver has a lot of merit. We shall see.
Just letting you know the post-FOMC market turmoil is drawing out all strategies that could simplify things for PAM, and hopefully for you as well.
We have set forth the instruments we want to use in expressing a bullish oil sentiment, at the PAM Prospective/Current Trades tab.NEW ENERGY TRADES (JUNE 20, 2019) USO (US OIL FUND, WTI) USOUCO (2X WTI ETF) UCOUWT (long oil 3x etn) UWTGUSH (3x XOP, Bull 3X Shares) GUSH
Mr. Kiser ratcheted up the ante by saying that if gold will rally further, even it t is just the fifth wave, the performance gap between GLL and USLV will widen -- so the equivalence of the two diametric trades will disappear, because gold will outperform silver. I am convinced.@all
PAM will sellGLL (-2x Gold ETF) x 3 tranches GLL $67.98 GLL 63.5 -$4.48 -6.59%andUSLV (Velocity 3x Long Silver ETN) x2 tranches USLV $64.10 USLV 67.42 $3.32 5.18%
Details;GLL - 63.37USLV - 67.39
Robert P. Balan @robert.p.balanLeaderJun 20, 2019 6:27 PM
I just uploaded this email:PAM Sells GLL (-2x Gold Bear) And USLV (3x Gold Bull) In An Offset, Leaving Just USLV 2 Tranches
jayn1321 @jayn1321Jun 20, 2019 9:04 PM
Robert, do you have any thoughts on housing? I am starting to see a lot of flow in XHB
Robert P. Balan @robert.p.balanModeratorLeaderJun 20, 2019 9:12 PM
Robert P. Balan @robert.p.balanModeratorLeader
Jun 20, 2019 9:14 PM
jayn132
Some downside for housing. but not a disaster-
jayn1321 @jayn1321
Jun 20, 2019 9:16 PM
Forgive me if it is too simplistic in thought, but lower rates (from anticipated cuts) = more interested buyers coming in?
The flow I see is for early 2020
Robert P. Balan @robert.p.balanModeratorLeaderJun 20, 2019 9:39 PM
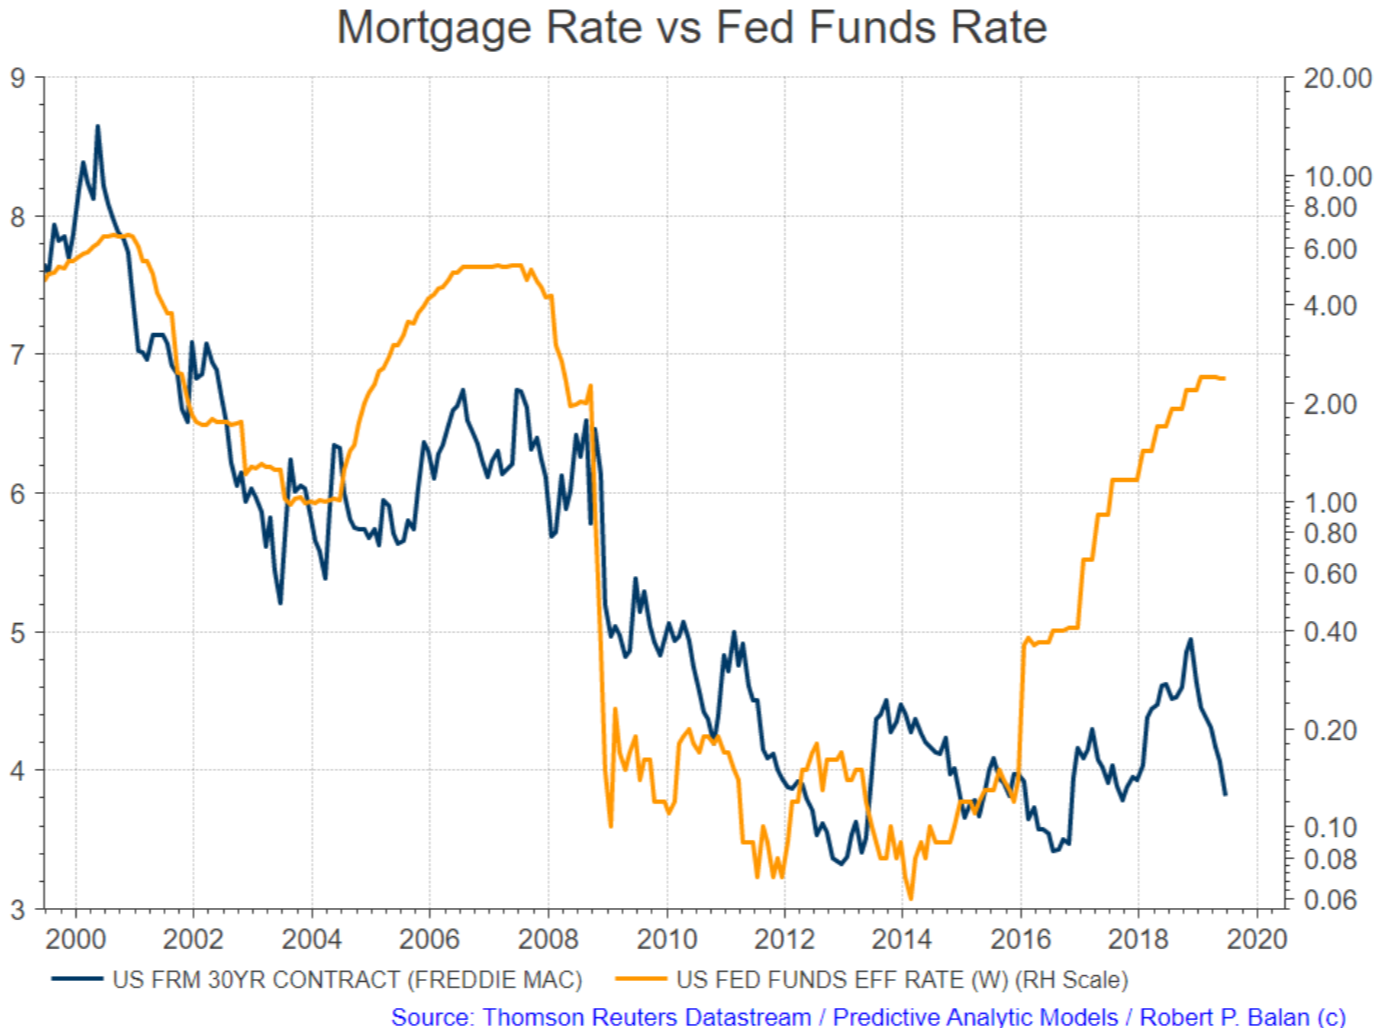
See it from the recovery in Housing Starts -- it does not matter what peripheral issues there will be -- this relationship is probably what counts the most. Focus on the relationship between mortgage rates and starts -- that should be good enough because I know of no other that have better covariance than these two data. If you believe there is something else -- then tell me what is in your mind-which you think could be better and I will provide the data, and covariance analysis, and lets see.
The impact of FFR on mortgage rates is almost non-existent -- I can show you that.
Robert P. Balan @robert.p.balanModeratorLeaderJun 20, 2019 10:12 PM
BTCc1 and GBTC made new higher highs today.
I believe yields will be higher tomorrow and gold will be lower, after making thatr small wave 4 triangle we were talking about.
jayn1321 @jayn1321Jun 20, 2019 10:17 PM
That's the exact chart I remember you showing, thanks. Seems like we're approaching that inflection point a couple months from now. I am just looking at options flow which I don't trust unless there is supporting evidence
Robert P. Balan @robert.p.balanModeratorLeaderJun 20, 2019 10:19 PM
But I just want to make sure we would not get another surprise, so I did not try and call the bottom today. More than one mistake in a week, and Mr. Kiser will be gnawing his fingers off his hand. Just kidding.
jayn1321
The October-September time frame is very important -- a lot of the risk assets (especially, yields) will be making their lows for the year at that time.
I suspect Gold will be too.
Another reason waiting in the wings -- a resurrection of inflation.
Mortgage rates have been falling, but if inflation makes a comeback, that will pressure mortgage rates higher -- and there will be a new scramble to lock in low rates obtaining at that time.
Core PCE has a great impact on mortgage rates.
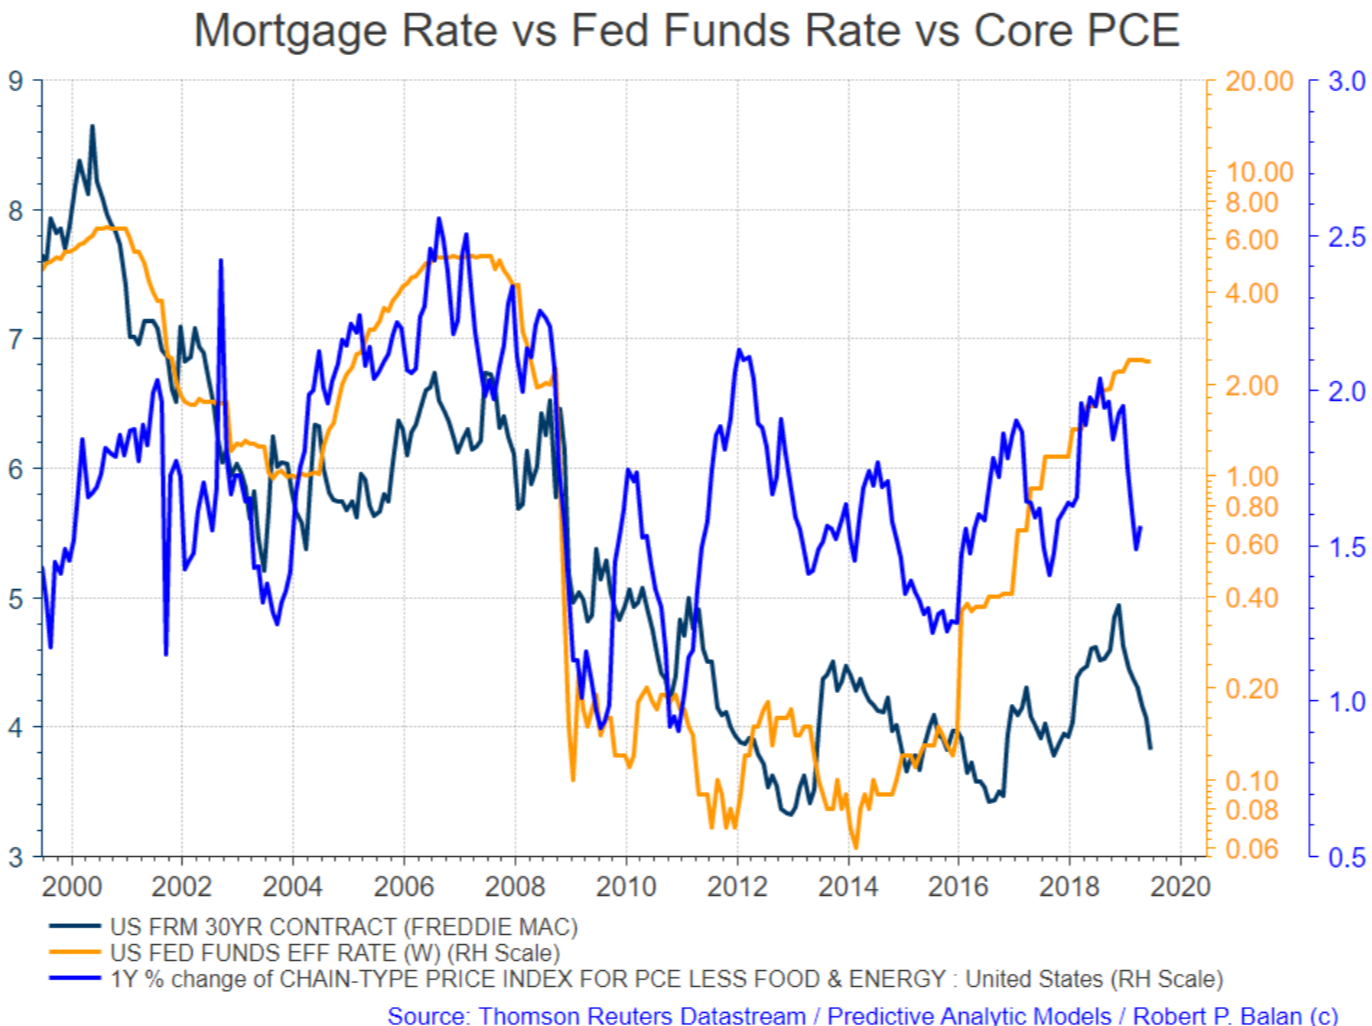
This is one aspect that also has a big influence on Housing Starts, but it transmits via the Mortgage Rate, so I give the MR the credit.
jayn1321 @jayn1321Jun 20, 2019 10:34 PM
Interesting, thanks Robert
MARKETS CLOSED
Predictive Analytic Models (PAM) provides REAL-TIME trading advice and strategies using guidance from US Treasury, Federal Reserve and term market money flows. PAM also provides LIVE modeled tools to subscribers in trading equities, bonds, currencies, gold and oil -- assets impacted by ebb and flow of systemic money. Sophisticated LIVE models to trade and invest in the oil sector are provided as well. PAM's veteran investors and seasoned traders can use PAM's proprietary tools 24X7 via PAM's SA service portal.
Try us for two-weeks, free. Please go here
Disclosure: I am/we are long oil, slv. dxy..

Comments
Log in or sign up to join the conversation.