

Summary
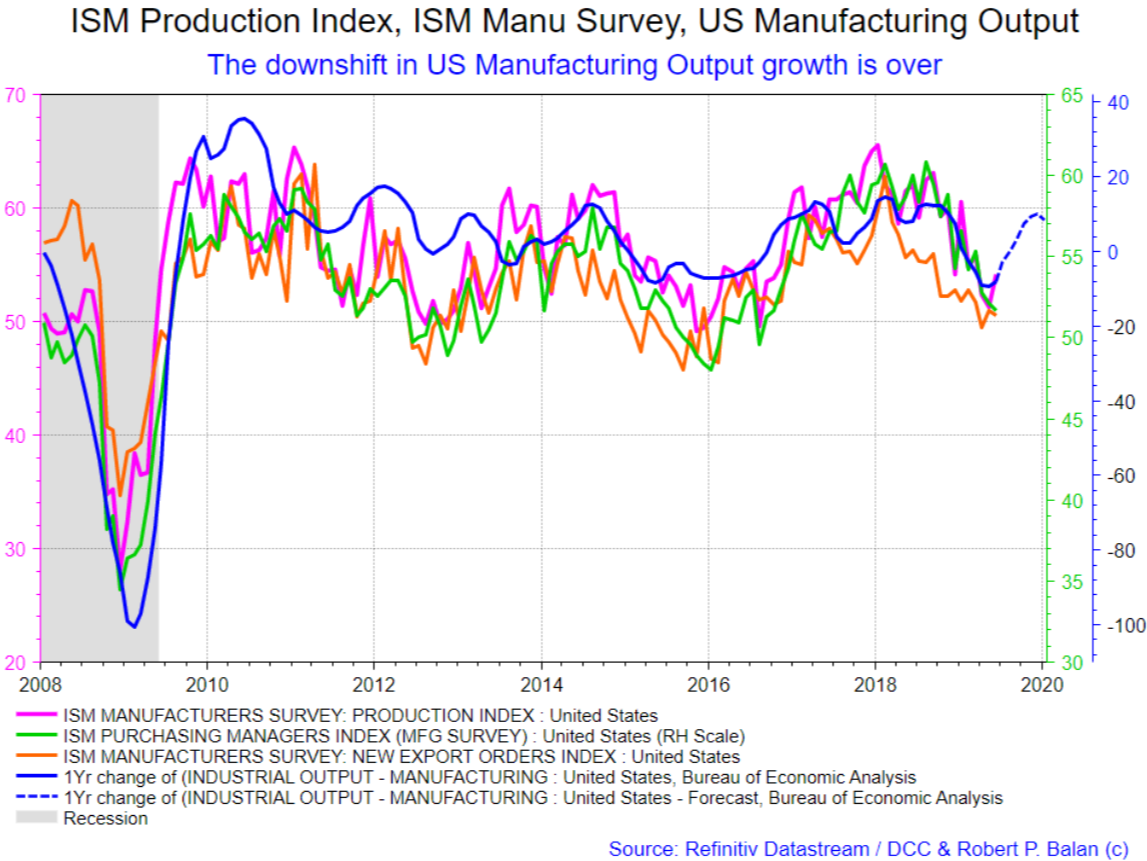
- The much ballyhooed US "recession" is over -- before it even began. The downshift in Manufacturing Output growth is over. The Philly Fed General Business Activity Index has bottomed.
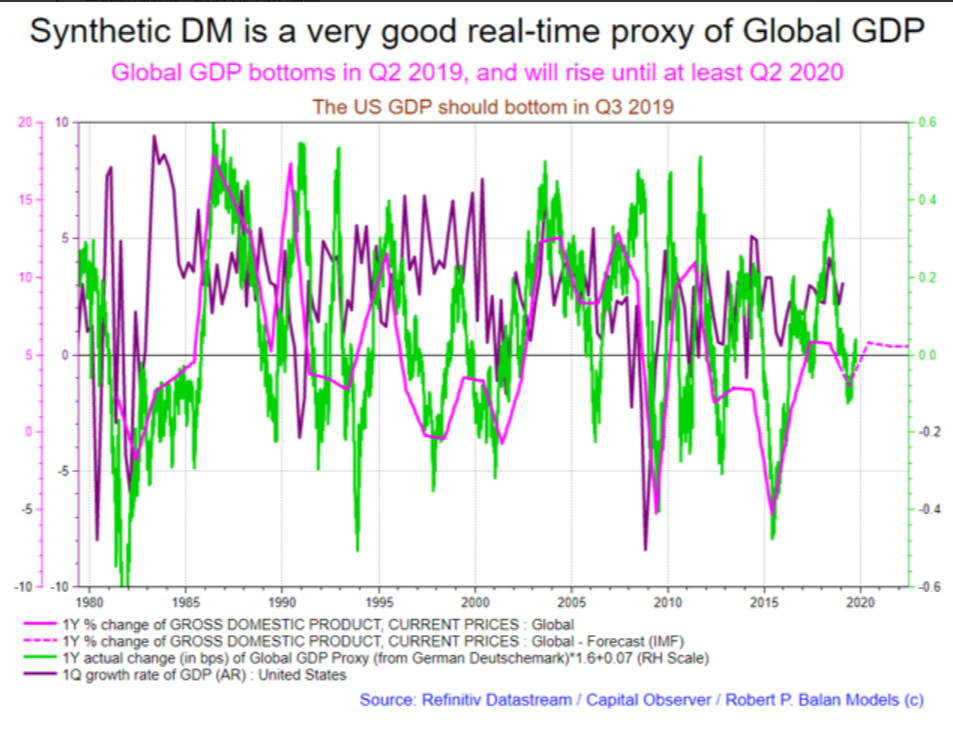
- The downshift in US GDP may end in Q2 2019, instead of Q3, as we first indicated This coincides with the upturn in Global GDP in Q2 this year.
- We have seen the upticks in SPX and yields signaled by the liquidity models; if these indicators are correct, we should see equities and yields finally keel over and fall.
- If the implications of a yield decline is correct, then necessarily DXY has to weaken. If we get some more cooperating declines from yields, PAM will add to the DXY short trades that were initiated earlier in the week.
- If yields fall further, then Gold and the Miners should rise (yields shown as inverted in the chart above). We will be watching for a breach of 1430 (XAU) to the upside to get more confidence that a new Gold rally is upon us.
(This actual Market Report was written pre-NY market opening, on July 24, 2019, and was updated until the NY market closed. Seeking Alpha has been encouraging SA service providers to become more transparent, and show actual reports and interaction between providers and subscribers. We are providing this report to showcase what PAM provides to the members of the community).
Original article here
Why not take a free two-week trial subscription, have a look at us and see if this community of veteran investors is a good fit for you?
Please go here
Robert P. Balan @robert.p.balanLeaderJul 24, 2019 9:30 AM
The US "recession" is over before it even beganLatest data from the US Bureau of Economic Analysis:The downshift in Manufacturing Output growth is over
Alan [email protected] 24, 2019 10:11 AM
I bet that chart correlates with something like fiscal flows or G5 TCB.
Robert P. Balan @robert.p.balanLeaderJul 24, 2019 9:36 AM
Manufacturing Output growth plus Philadelphia Fed General Business Activity Index (black line)The Philly Fed General Business Activity Index has bottomed
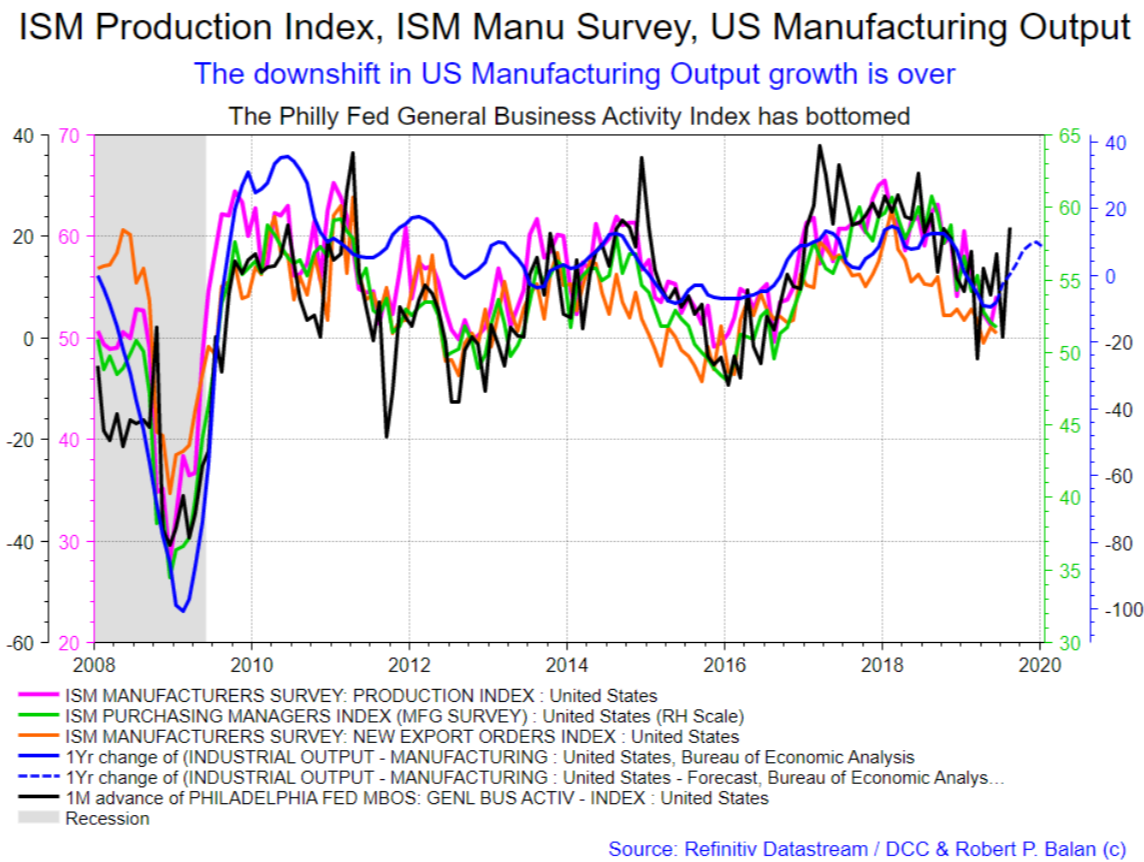
The much ballyhooed US "recession" is over -- before it even began.
Robert P. Balan @robert.p.balanLeaderJul 24, 2019 10:12 AM
The downshift in US GDP may end in Q2 2019, instead of Q3, as we first indicated.
This coincides with the upturn in Global GDP in Q2 this year.
Robert P. Balan @robert.p.balanLeaderJul 24, 2019 11:10 AM
The latest IMF outlook suggests that global growth should bottom by the middle of the year, and there should rising growth by the second half of 2019. . . .
vjapn @vjapnJul 24, 2019 12:54 PM
Robert, If US GDP bottoms in Q2 vs Q3, will that change your outlook on equities and bonds?
Robert P. Balan @robert.p.balanLeaderJul 24, 2019 1:19 PM
Not really vjapn -- even if that is the case, we will only know that Q2 has bottomed, but only during Q3. GDP reports are delayed by one quarter. It used to be that SPX leads GDP by one quarter, but after the Fed's Quantitative Easing regime, SPX now tends to coincide with GDP, even trail it by one quarter. Let me show you that with a chart.
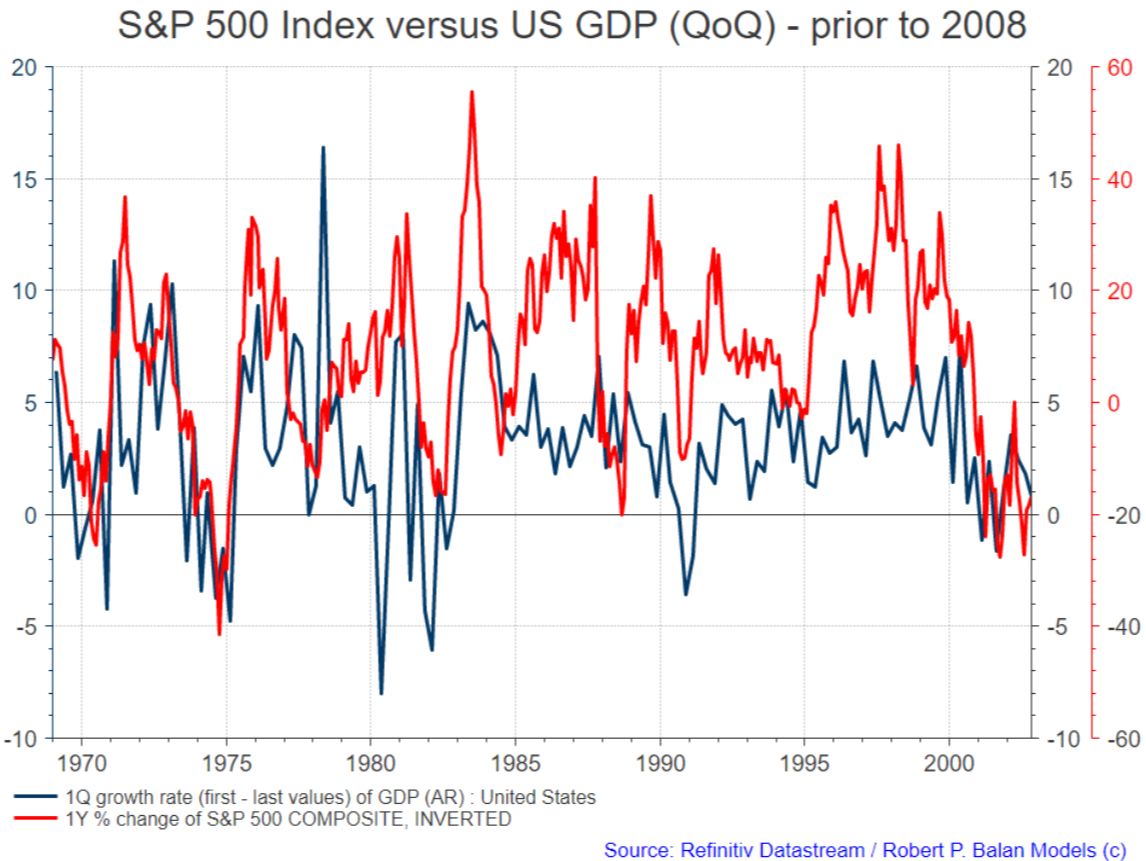
Obviously, the inflection points of the SPX leads GDP in the above chart, by 1 quarter on average.
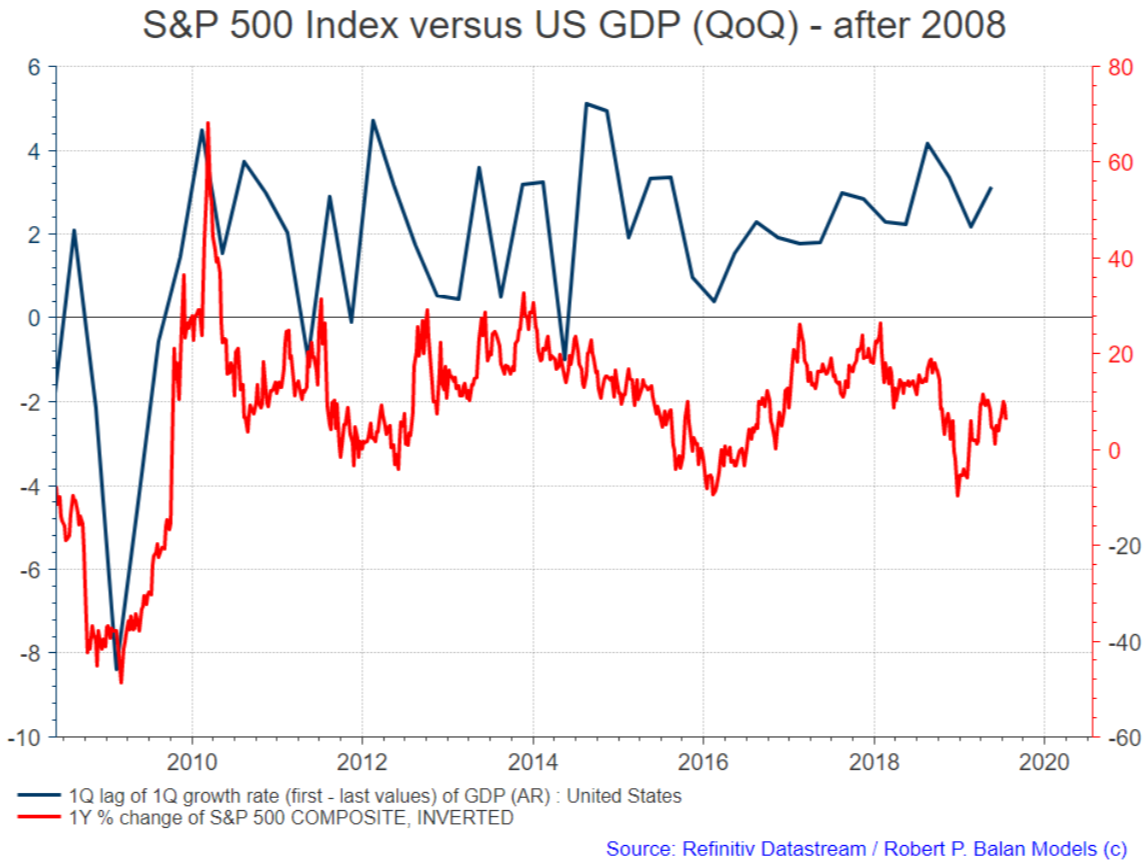
I have to move GDP 1 quarter forward to synchronize the inflection points of GDP and SPX. What it provides is that SPX has become a real time indicator of the US GDP.
SPX has lost its predictive power.
Robert P. Balan @robert.p.balanLeaderJul 24, 2019 2:12 PM
GOOD MORNING
Market Report At The Chat, July 24, 2019
We again start with the status of the Liquidity Models,
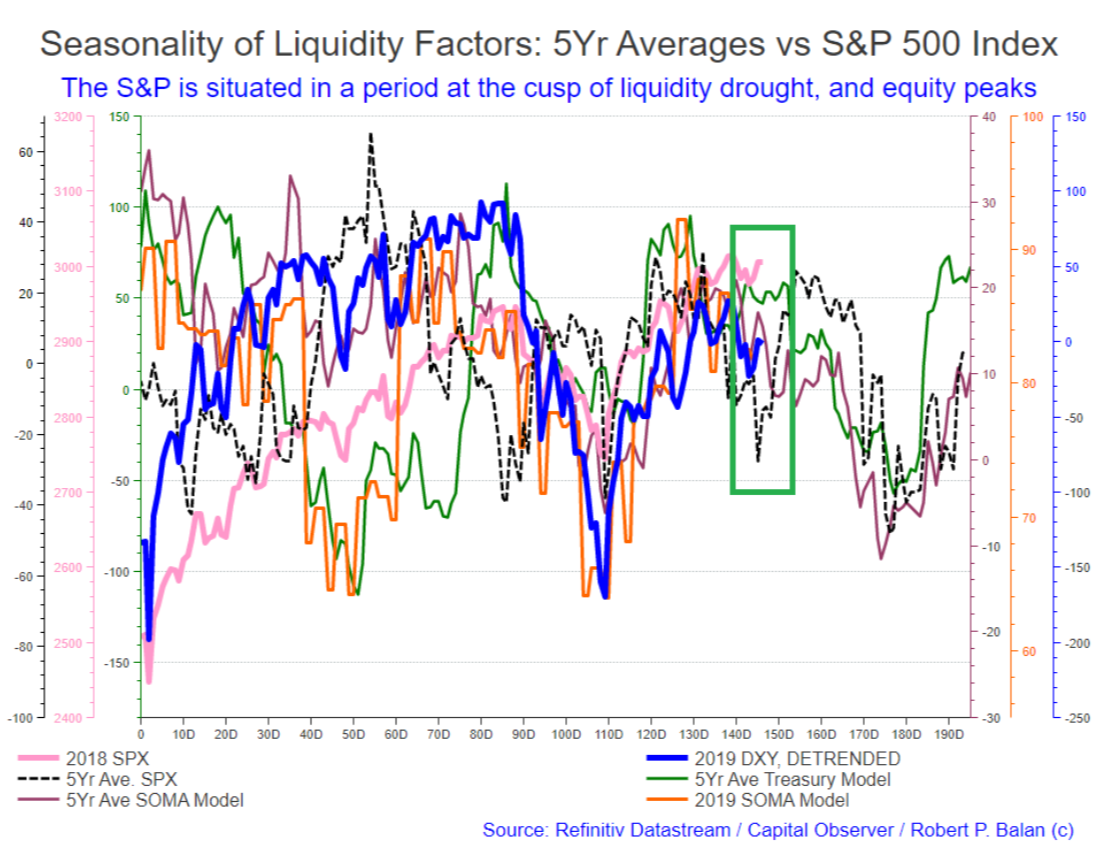
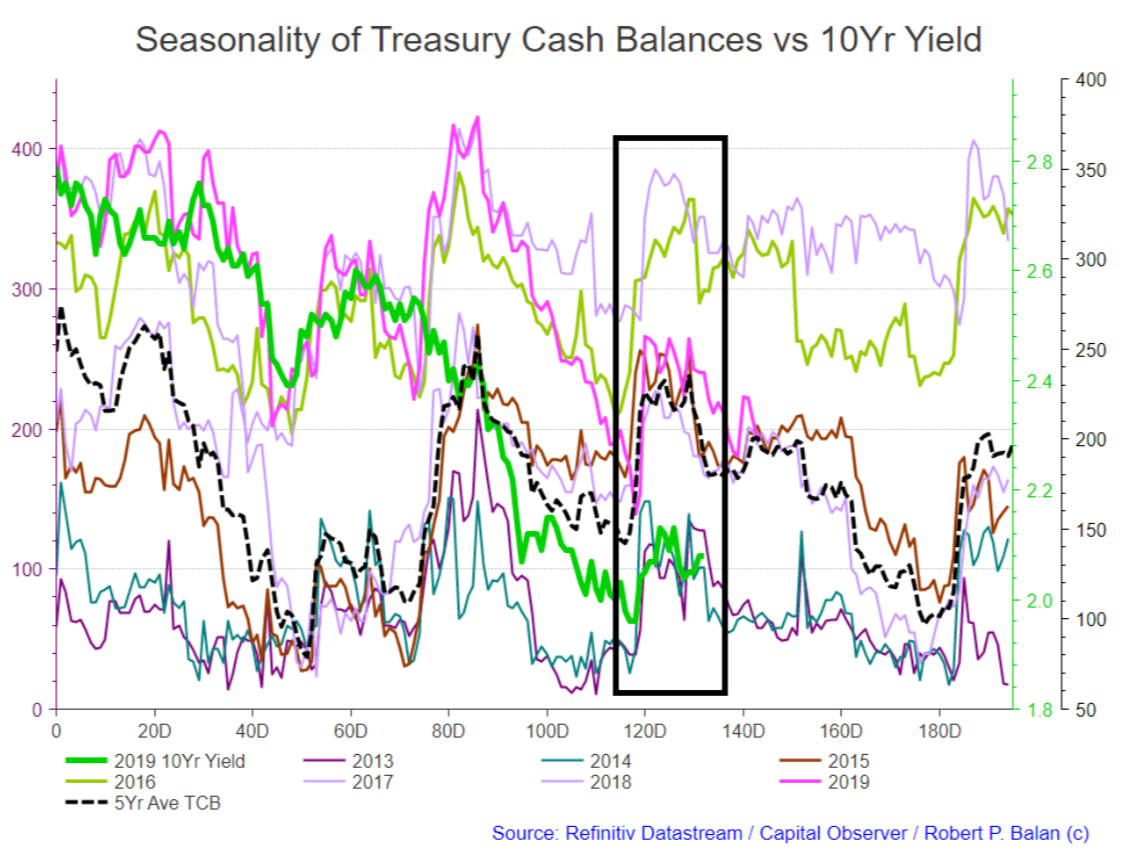
We have seen the upticks in SPX and yields signaled by the liquidity models, and if these indicators are correct, we should see equities and yields finally keel over and fall.
On Monday, we uploaded this chart to illustrate the likely price actions which are being flagged by the liquidity models. The price action was then described as completing the Wave 2 of the series, and what follows is Wave with significant downside potential.
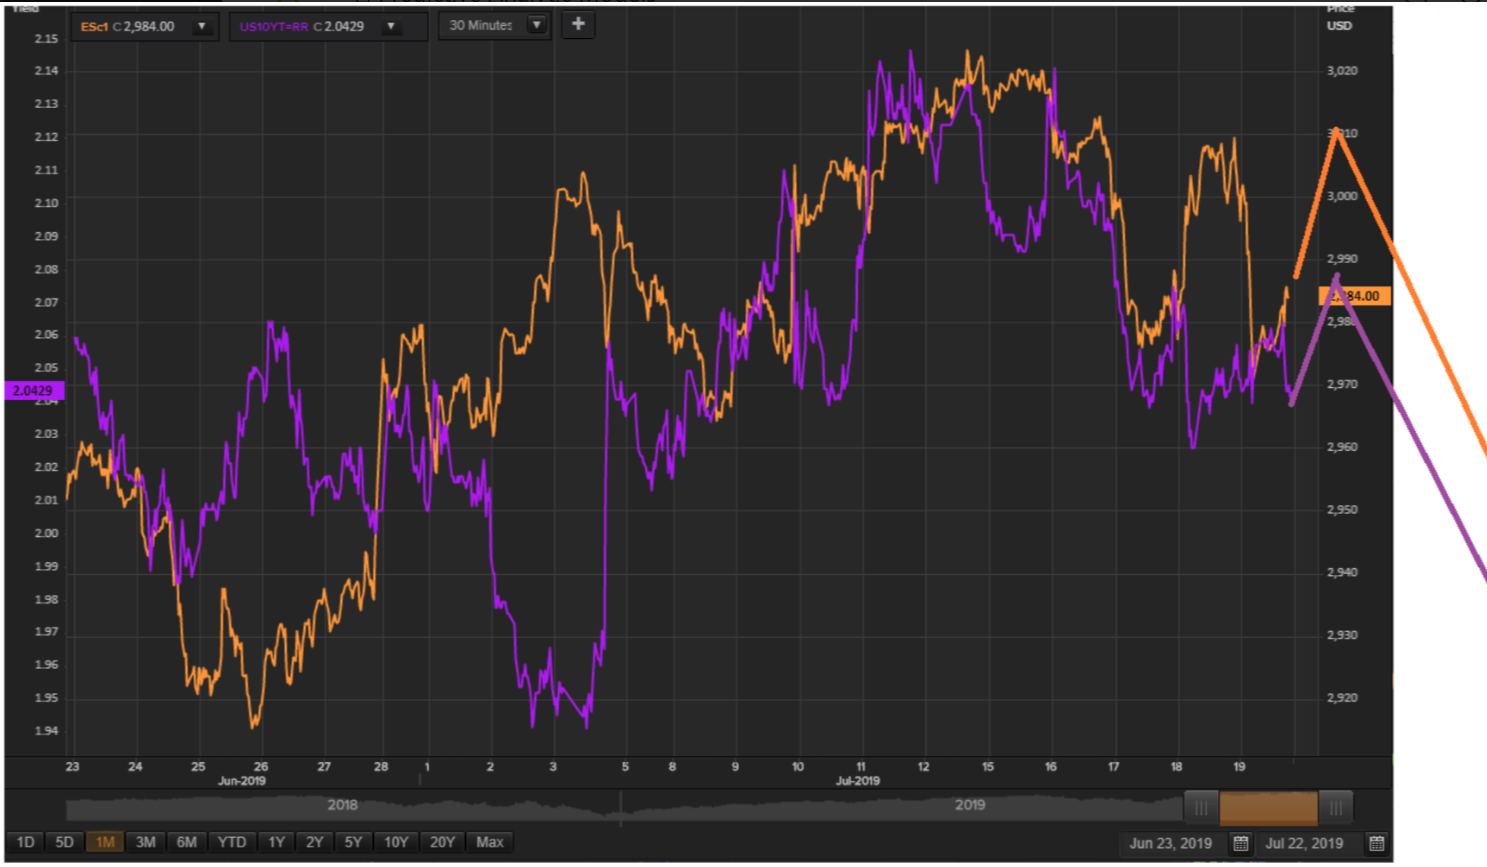
Today, it does look like the illustrations were spot on, and the requisite Wave 2 action may have been met. We now expect Wave 3, and subsequent moves down to Wave 5, to define the price action from here until a July 29-July 30 initial bottom being suggested by the models.
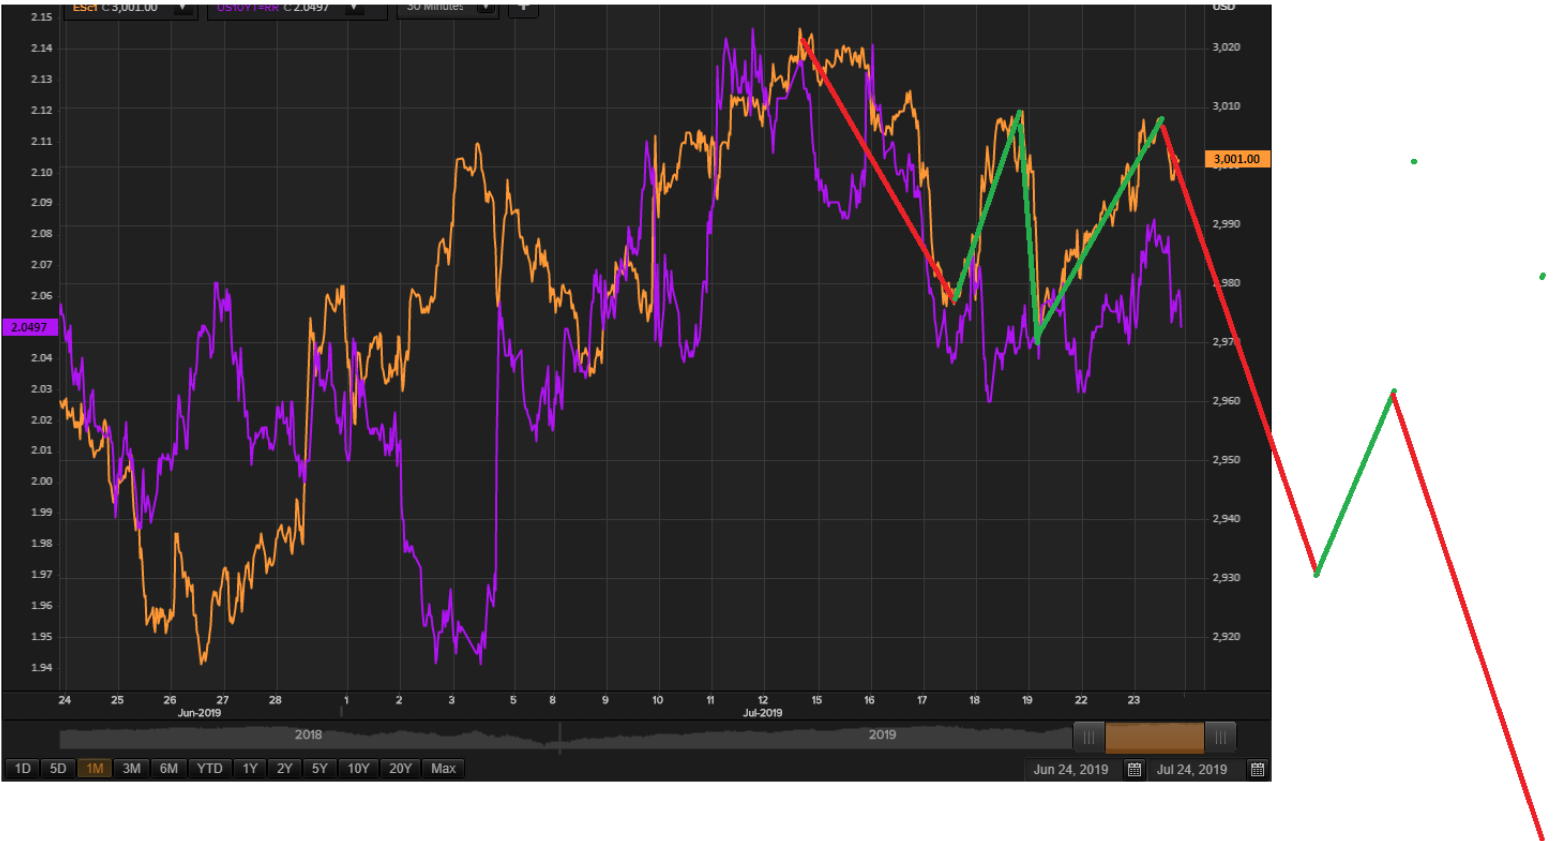
Of course the illustration does not denote the actual target levels which we will be looking for. We will wait for the outcome of today's trading -- and if we do get that sell-off later today, then we will work on downside targets and speak about them tomorrow.
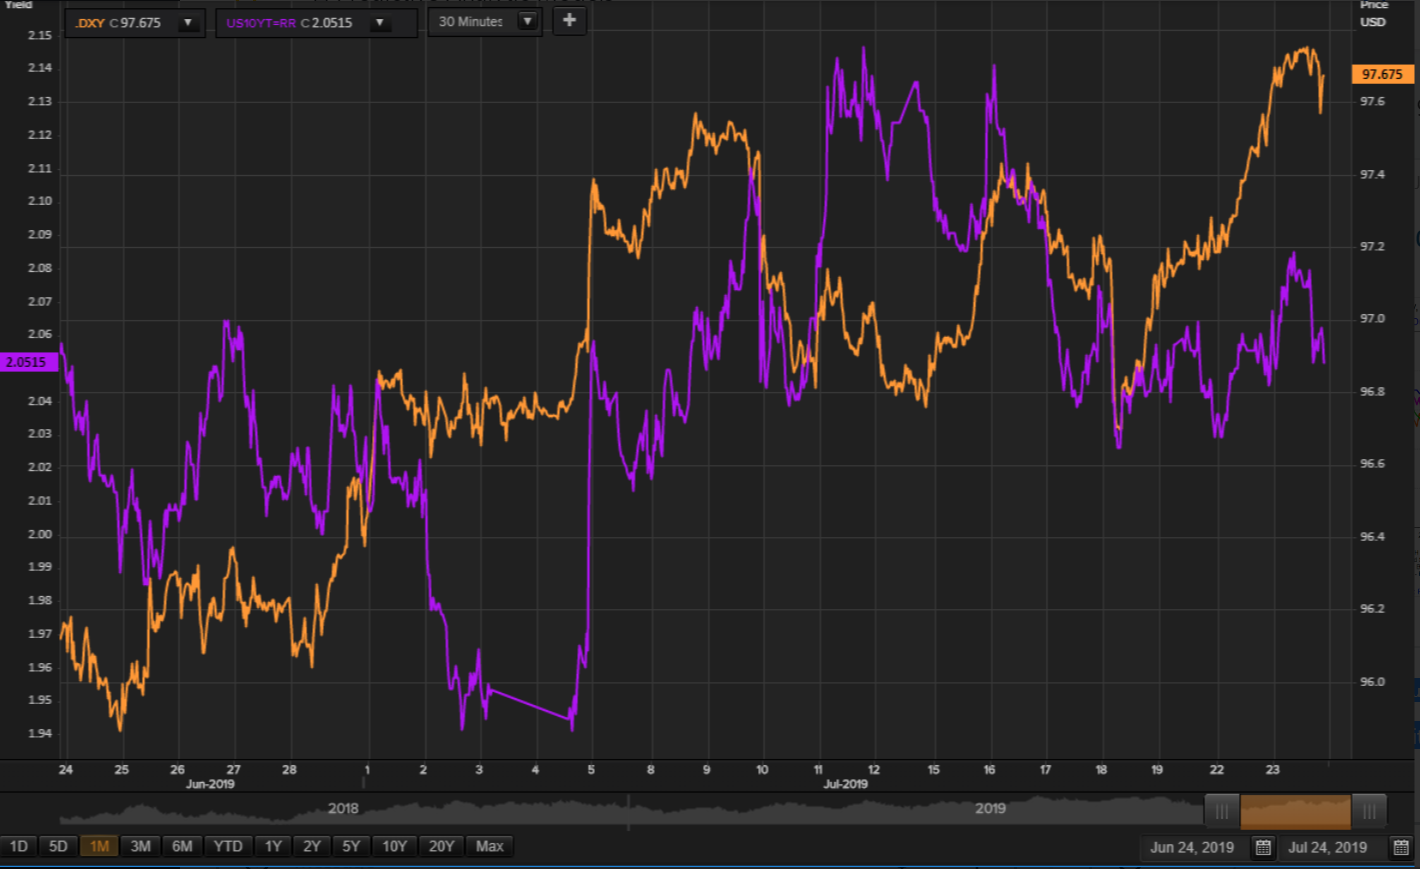
If the implications of a yield decline is correct, then necessarily DXY has to weaken. And Tim and I believe that we are seeing the currency in the process of topping out (chart above).
If we get some more cooperating declines from yields, PAM will add to the DXY short trades that were initiated earlier in the week.
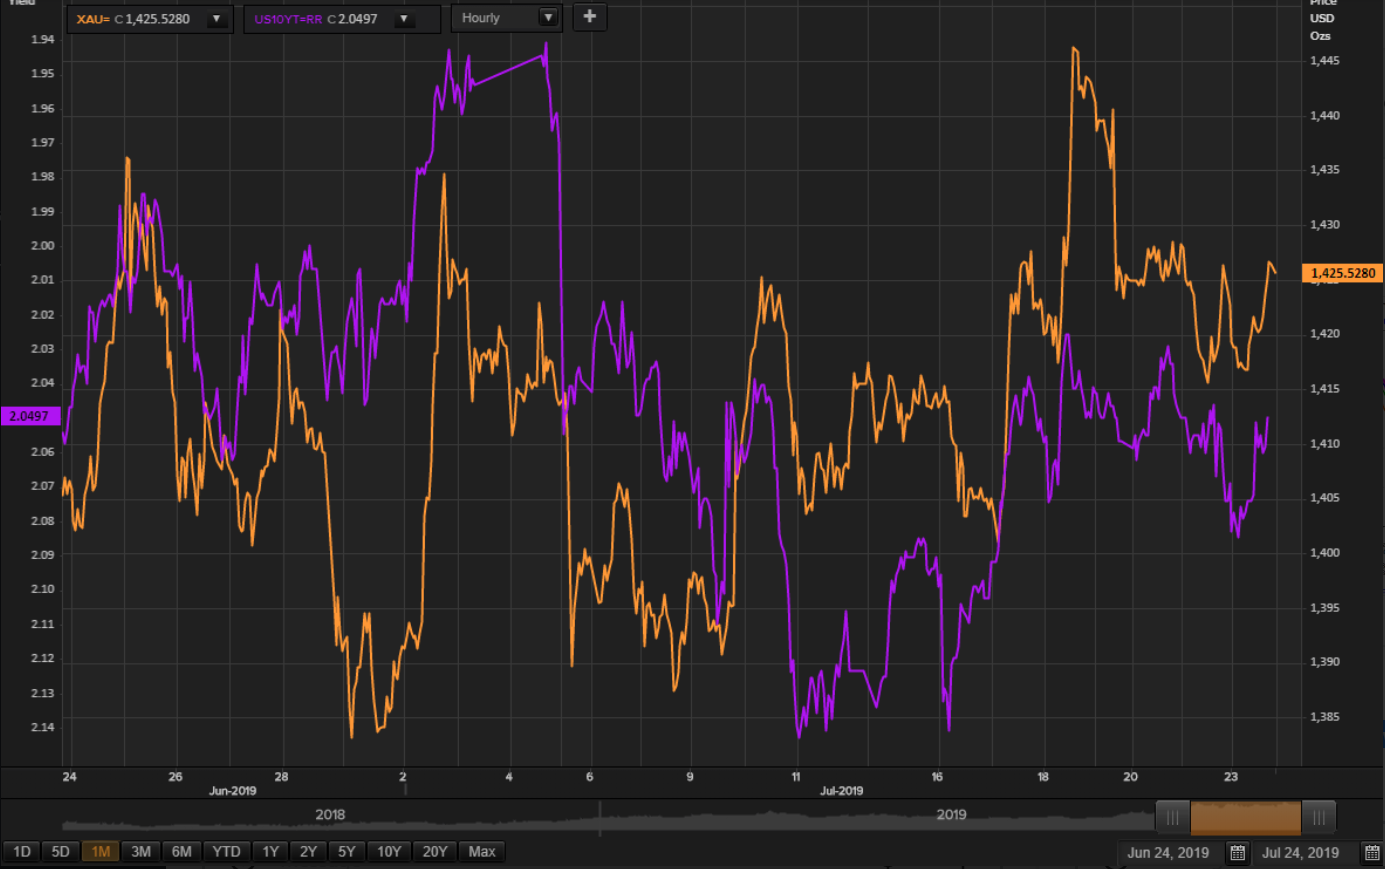
If yields fall further, then Gold and the Miners should rise (yields shown as inverted in the chart above). We will be watching for a breach of 1430 (XAU) to the upside to get more confidence that a new Gold rally is upon us.
The step-ladder ascent of oil prices, lead by Brent, is actually very encouraging. That means there is still significant pessimism over the scenario of a crude oil rally, so that means bears still have not capitulated. That should help cement the oil prices gains.
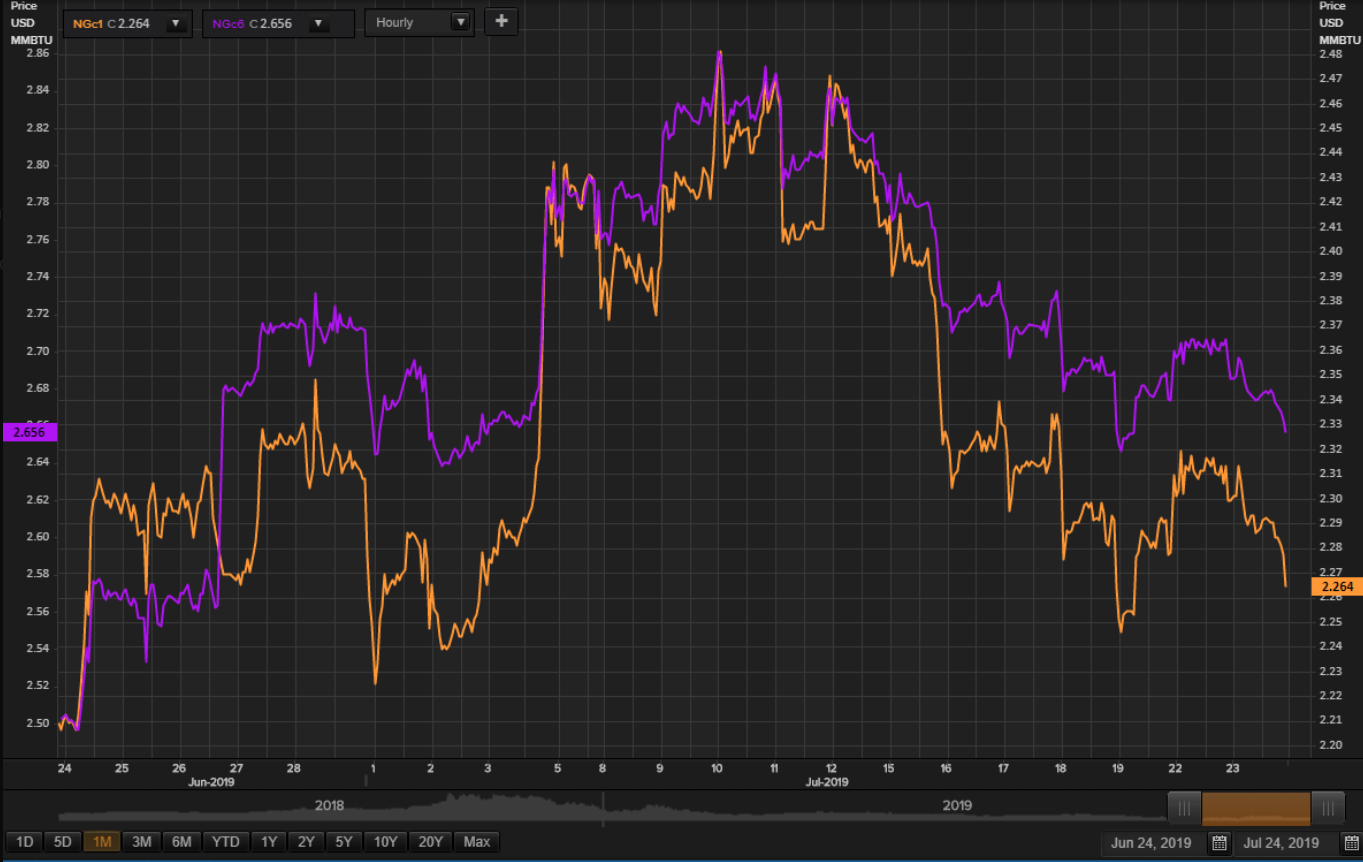
NatGas prices are probably at the "test the lows" stage. If we do not see lower lows from here (relative to the lows a few days ago) then that might be a good reason to reinstate long NG trades.
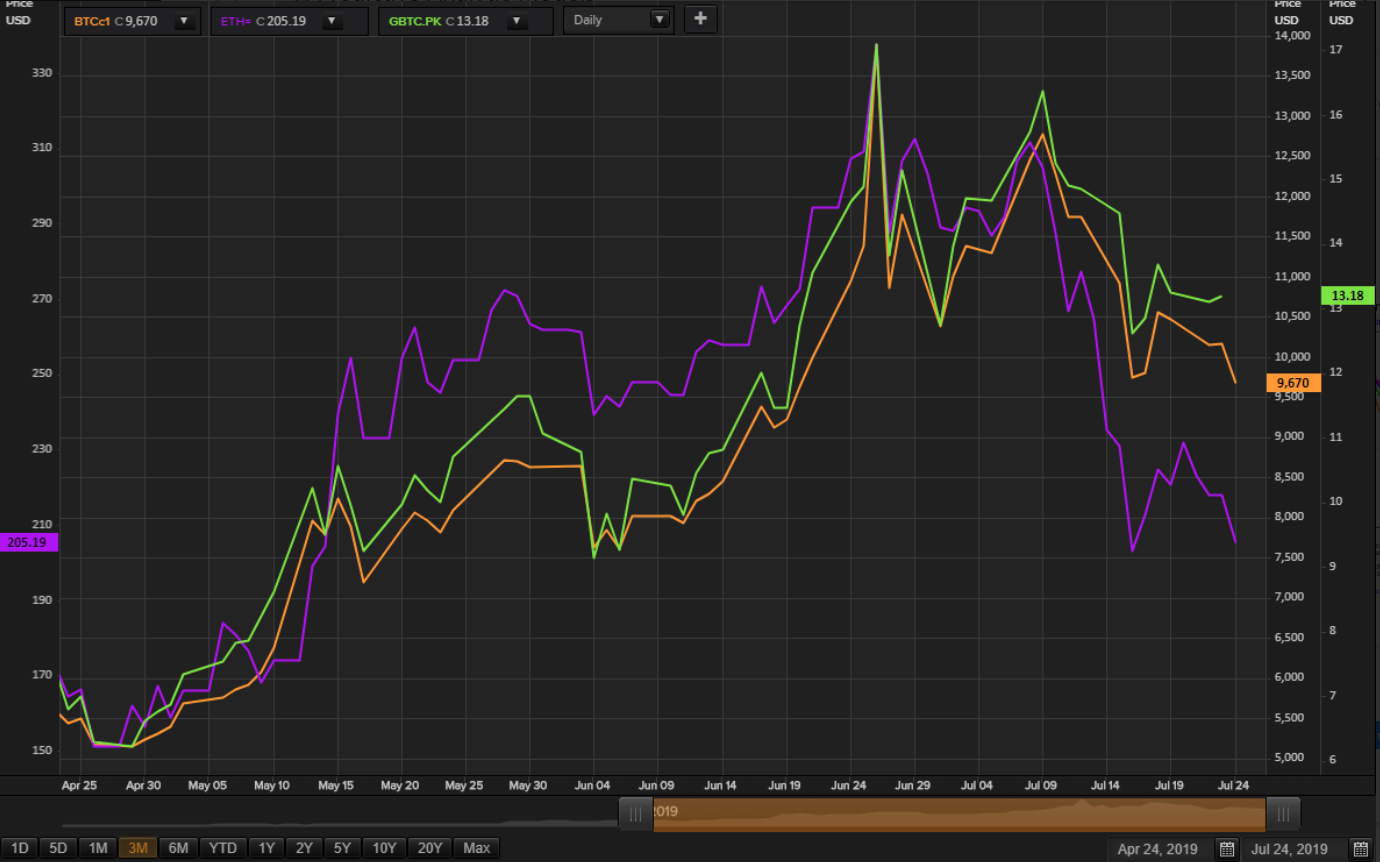
Finally, cryptos are doing the same "test the lows" process. If daily closes start moving up from here, then I will be looking to add to my BTCc1 futures long trades via DCC.
Robert P. Balan @robert.p.balanLeaderJul 24, 2019 2:59 PM
We wait for more price action to resume the narrative, after NY market opens. Open to discussions.
vjapn @vjapnJul 24, 2019 5:45 PM
Robert, Crude got to 57.50 area and failed. Does that suggest more downside which would also align with your views on ES trading lower?
Robert P. Balan @robert.p.balanLeaderJul 24, 2019 5:55 PM
Have a look at what I just posted about oil in the Nexus. These small intraday moves should not bother you so much vjapn.
vjapn @vjapnJul 24, 2019 9:00 PM
Robert, any change in thoughts based on today's action in equities?
Robert P. Balan @robert.p.balanLeaderJul 24, 2019 9:08 PM
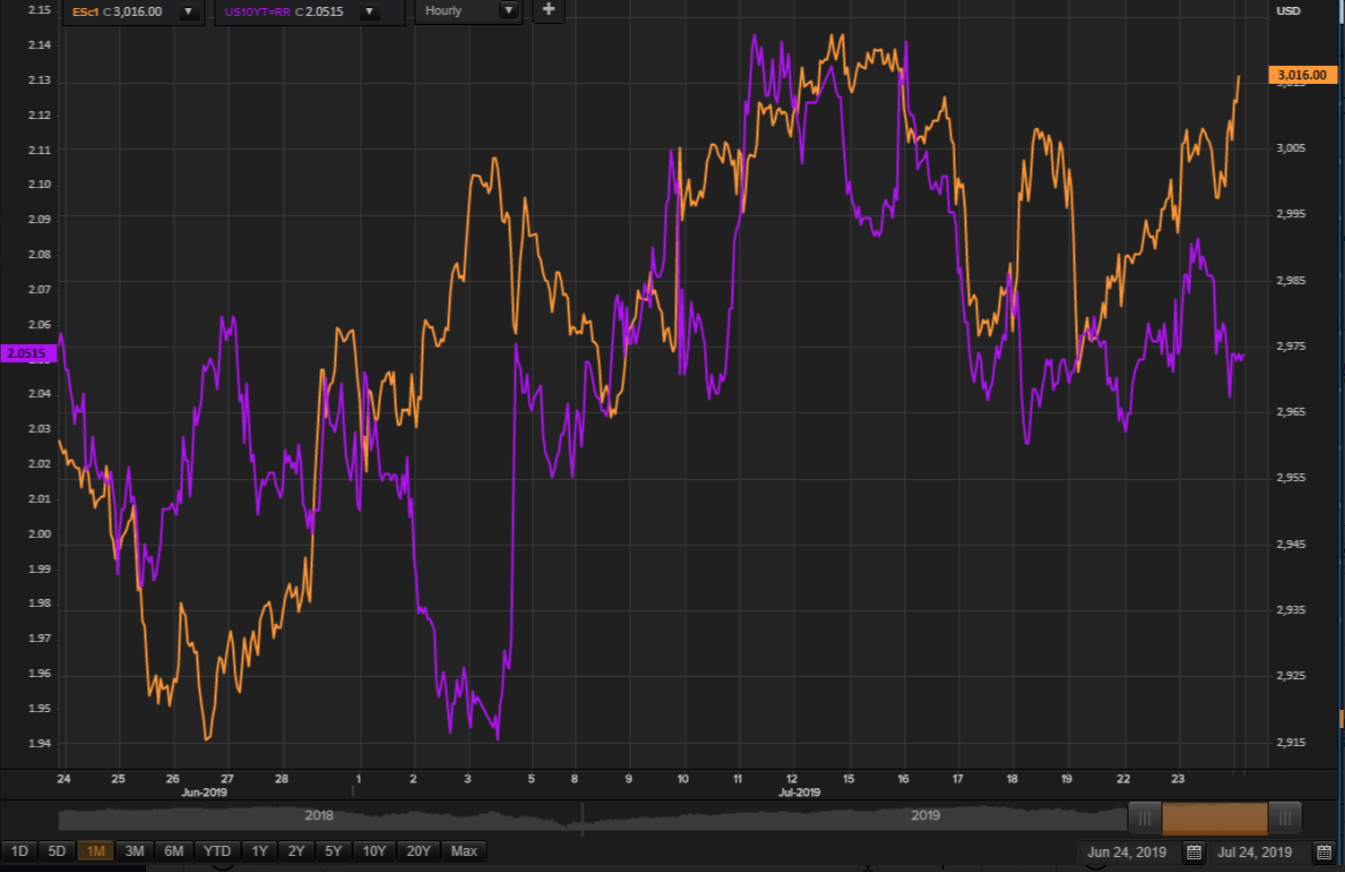
Equities should have rolled over but they haven't. I will wait until tomorrow to make a judgment, but don't let that stop you from taking risk management measures if you are not comfortable with the situation.
Alan Longbon @Alan.LongbonJul 24, 2019 9:31 PM
I think the underlying economic picture is quite strong and the markets not rolling over is a sign of that. After committing to those wise words what is the bet that it rolls over hard all the rest of the week. lol
FlatCoated @flatcoatedJul 25, 2019 12:24 AM
Alan.Longbon - Well I agree with you, so it should fall twice as fast.
Acetaia @acetaiaJul 24, 2019 4:33 PM
That IEA product build yesterday was overhang from last weeks EIA. Today great numbers for OIL.
Robert P. Balan @robert.p.balanModeratorLeaderJul 24, 2019 4:40 PM
Thanks Acetaia.
API
Crude -10.961mm
Cushing -448k
Gasoline +4.436mm - biggest build since Jan
Distillates +1.42mm
DOE
Crude -10.835mm
Cushing -429k
Gasoline -226k
Distillates +613k
The humongous gasoline build in API did not show up in the DOE data -- it will probably appear in the next week or in two.
US Crude production crashed down 700k last week but largely due to Gulf stoppages due to storm Barry...
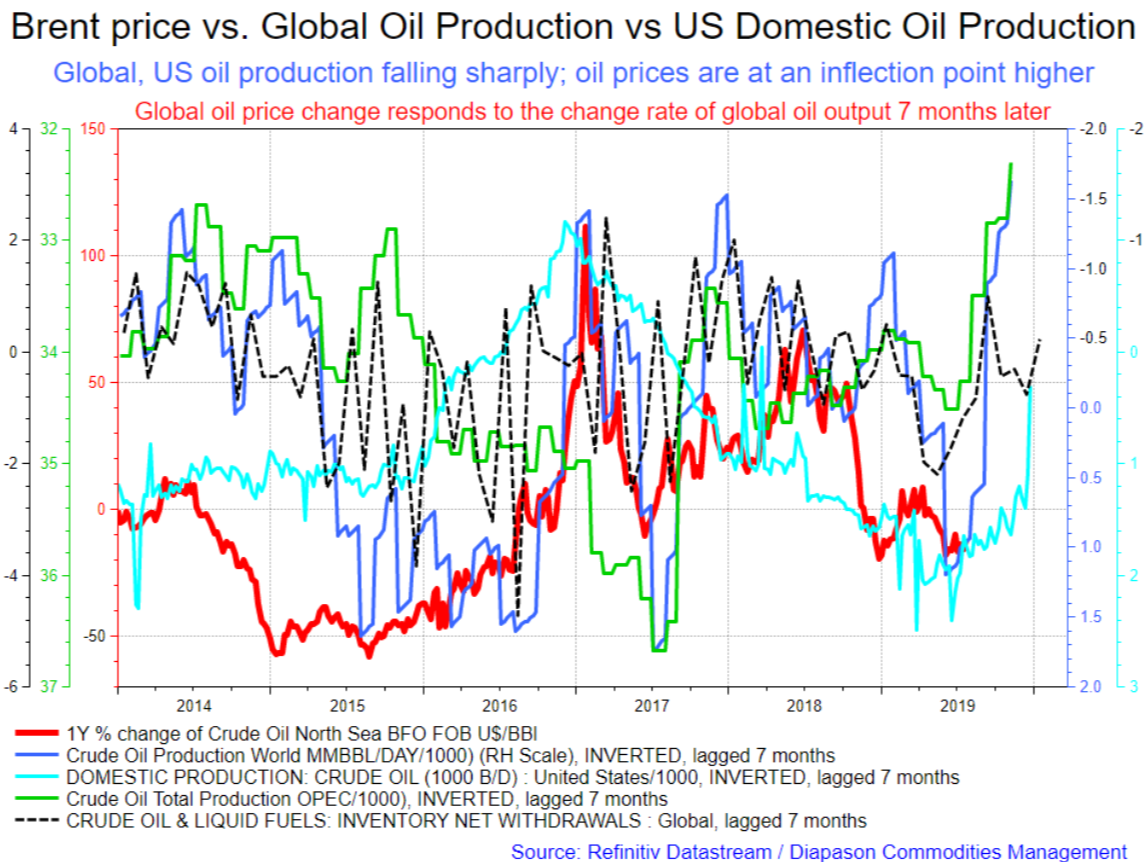
It seems ludicrous that global oil prices are falling while global production is falling globally and global oil demand is on an uptick.
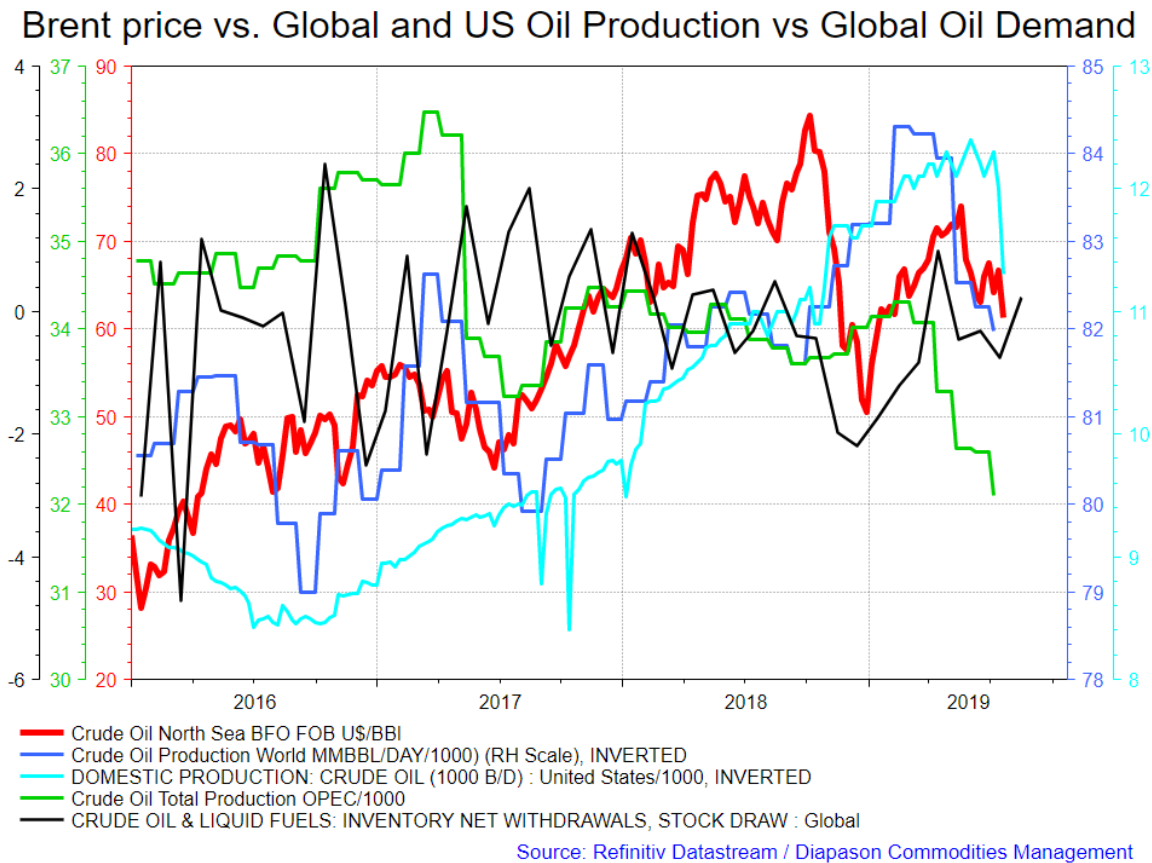
But the issue clears up with regression of these factors, which shows that changes in these oil fundamental data impact the change rate of the global oil price 7 MONTHS later.
Triple F Fred @Triple.F.FredJul 24, 2019 8:58 PM
robert.p.balan Robert, a quick question on the oil production #s posted, does the "global production" include US production in the total? Maybe sometime before you have addressed that query but I do not remember seeing it... Thanks, Fred
Robert P. Balan @robert.p.balanModeratorLeaderJul 24, 2019 9:00 PM
Yes FFFred, global total oil production is total for the globe. That, by the way is a single, unique data from the EIA.
Triple F Fred @Triple.F.FredJul 24, 2019 9:03 PM
thanks, felt it should be that way! Greatly appreciate the quick response... Now to do some # crunching....
MARKETS CLOSED
Predictive Analytic Models (PAM) provides REAL-TIME trading advice and strategies using guidance from US Treasury, Federal Reserve and term market money flows. PAM also provides LIVE modeled tools to subscribers in trading equities, bonds, currencies, gold and oil -- assets impacted by ebb and flow of systemic money. Sophisticated LIVE models to trade and invest in the oil sector are provided as well. PAM's veteran investors and seasoned traders can use PAM's proprietary tools 24X7 via PAM's SA service portal.
Try us for two-weeks, free. Please go here

Comments
Log in or sign up to join the conversation.