

Summary
- We are approaching a short-term stock market support, which looks to occur after a week. And that is supported by high-frequency analysis.
- The current consolidation resolves into further declines until August 5 or 6, if the models' inflection points are correct. Then barriers appear sometime in August 22, plus/minus 2 days.
- The bottom of the 10yr yield may seen in two weeks, if the current yields perform more or less in accordance with what we have seen in past five years.
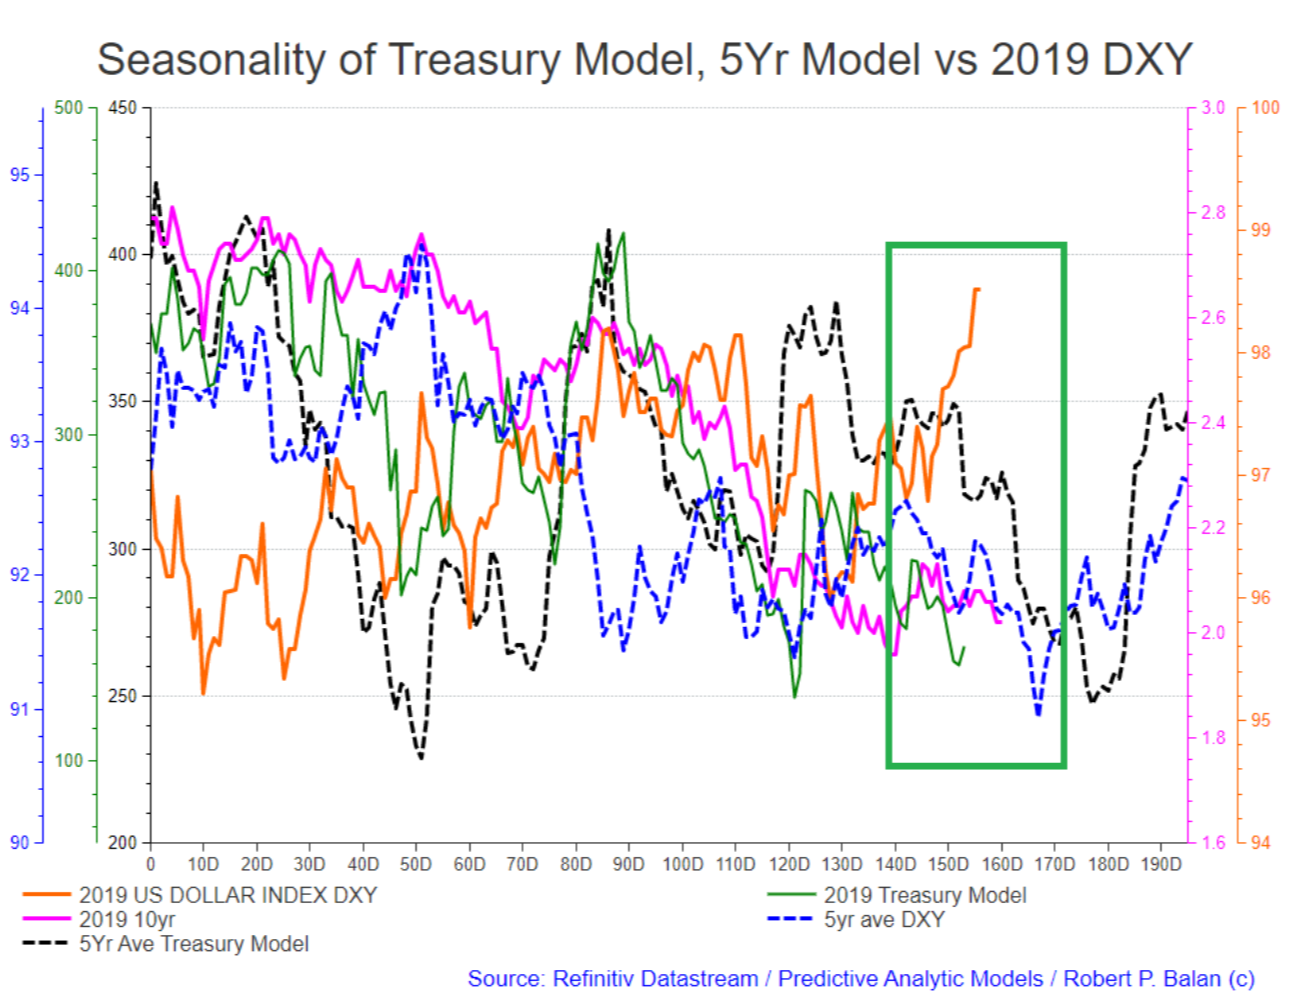
- The DXY has been diverging from short term and long term yields for about 8 days now. It is noted that the DXY does this every now and then, but eventually ends up following the lead of the yields -- higher or lower. In the current case, with yields expected to fall further, then DXY should be repriced appropriately lower verysoon.
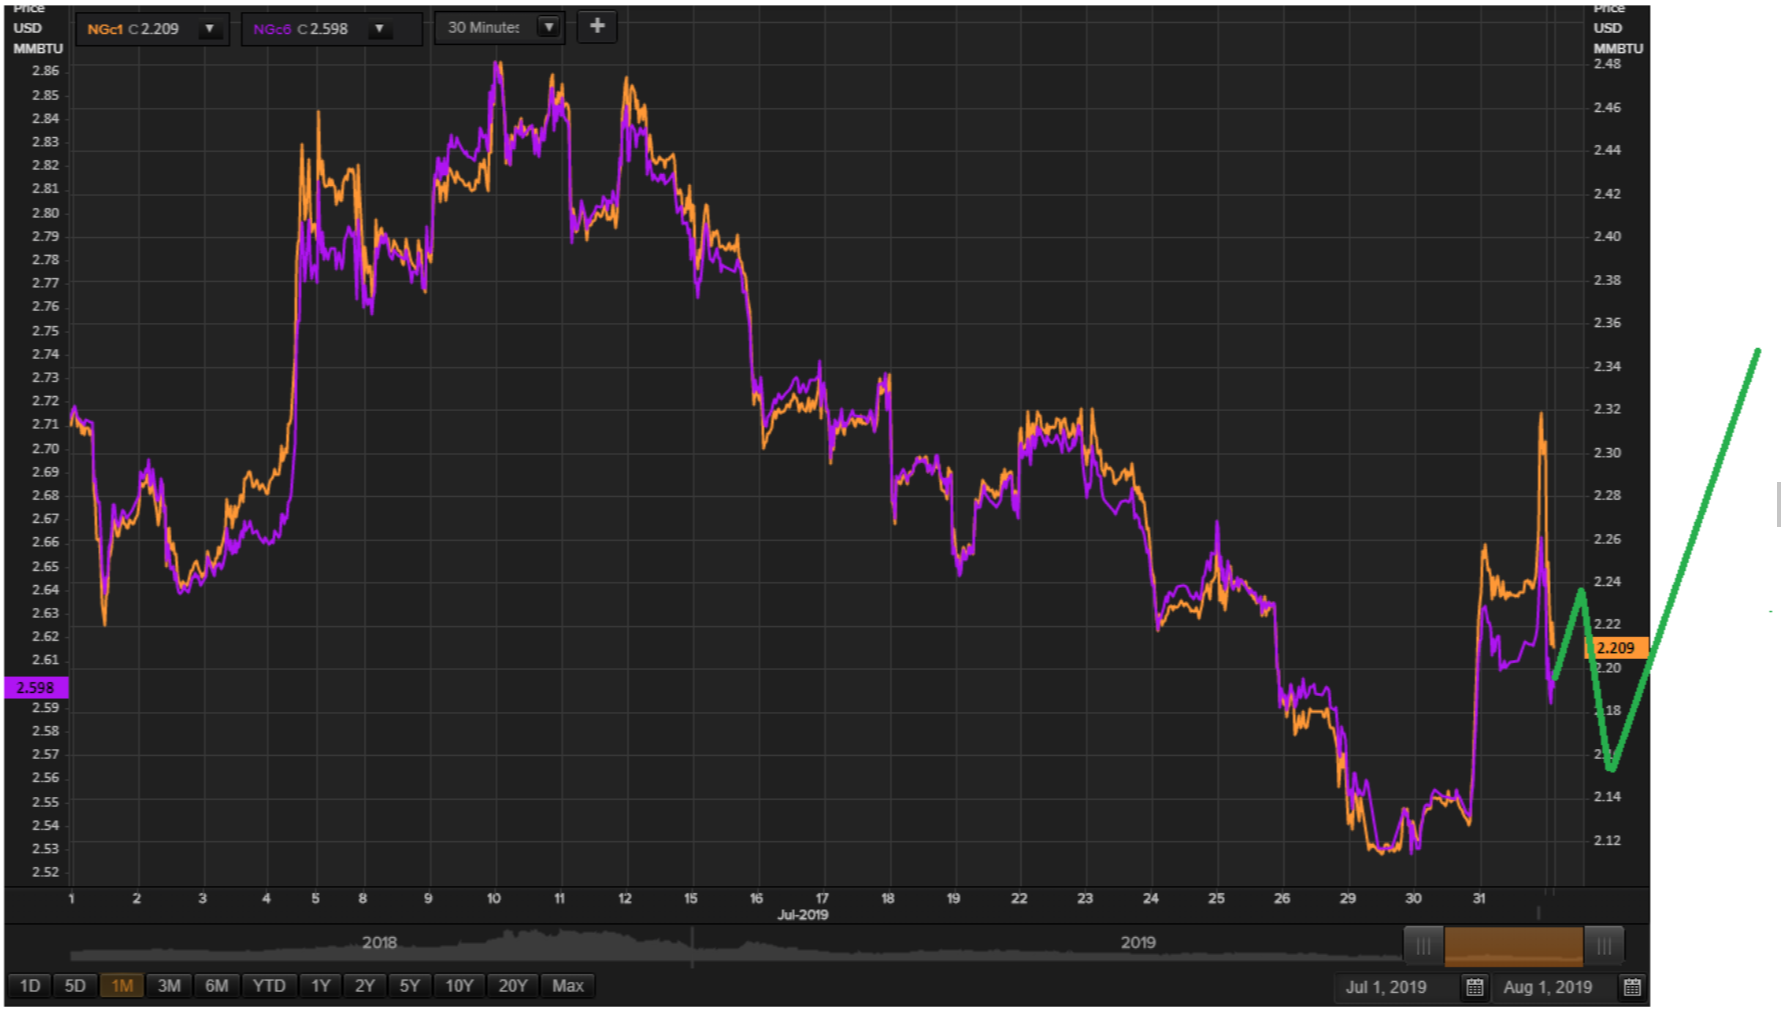
- We have seen some impressive recovery in NatGas, and higher frequency wave analysis already shows five almost completed. We should see a correction of 50 pct or more as te next move in NG, and PAM will be looking to go long after that correction is deemed over.
(This actual Market Report was written pre-NY market opening, on August 1, 2019, and was updated until the NY market closed. Seeking Alpha has been encouraging SA service providers to become more transparent, and show actual reports and interaction between providers and subscribers. We are providing this report to showcase what PAM provides to the members of the community).
Why not take a free two-week trial subscription, have a look at us and see if this community of veteran investors is a good fit for you?
Please go here
Robert P. Balan @robert.p.balanLeaderAug 1, 2019 3:08 PM
GOOD MORNING
Market Report At The Chat, August 1, 2019
It's Swiss Confederation Day, today.
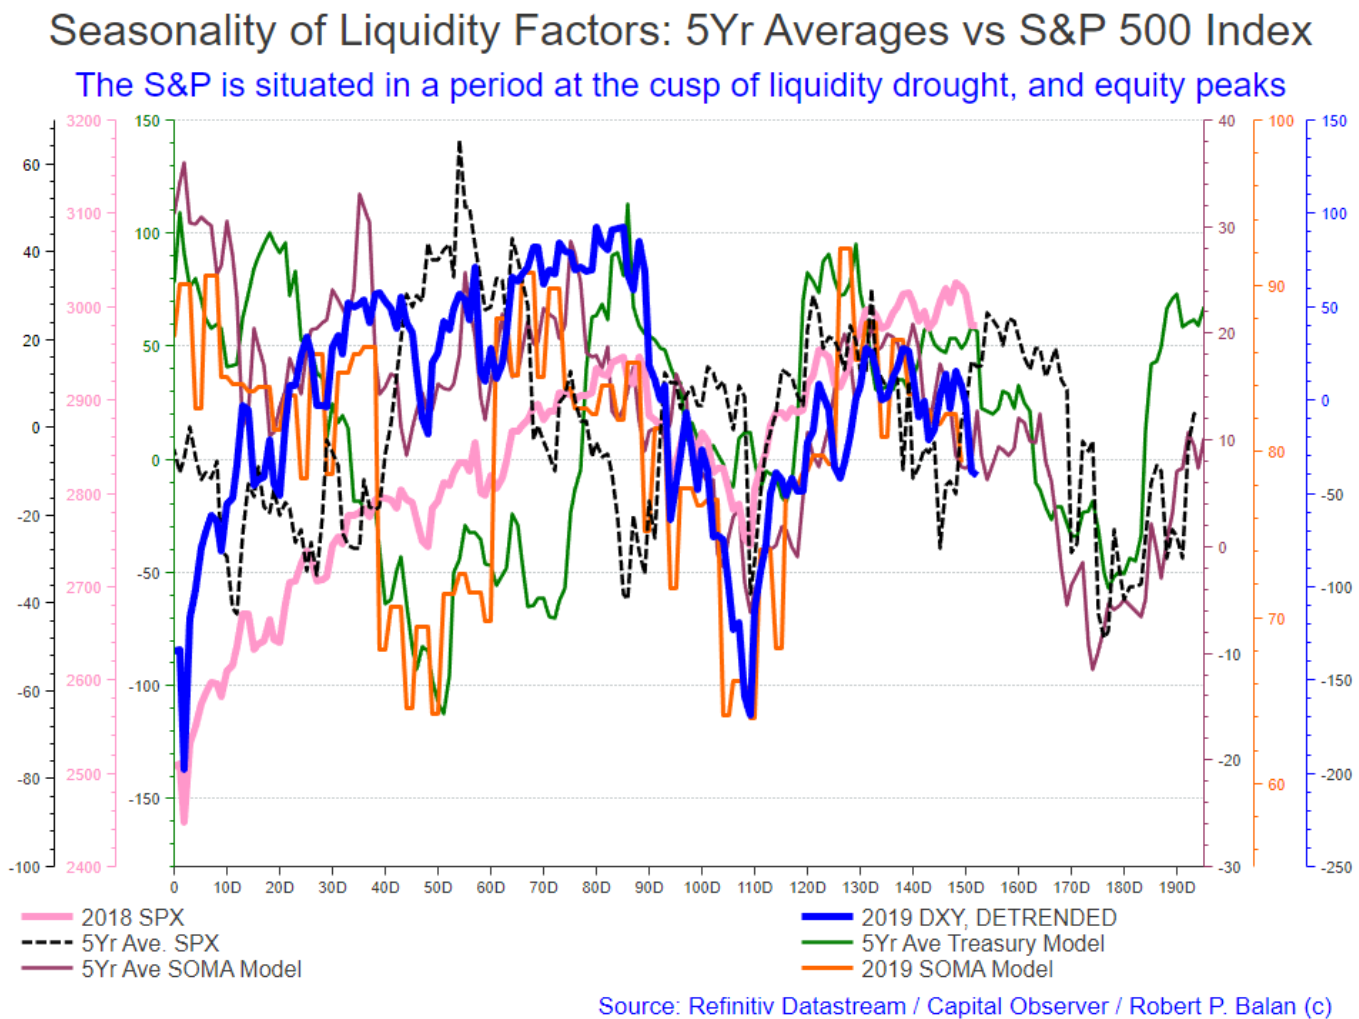
Here is how the models look at this point:
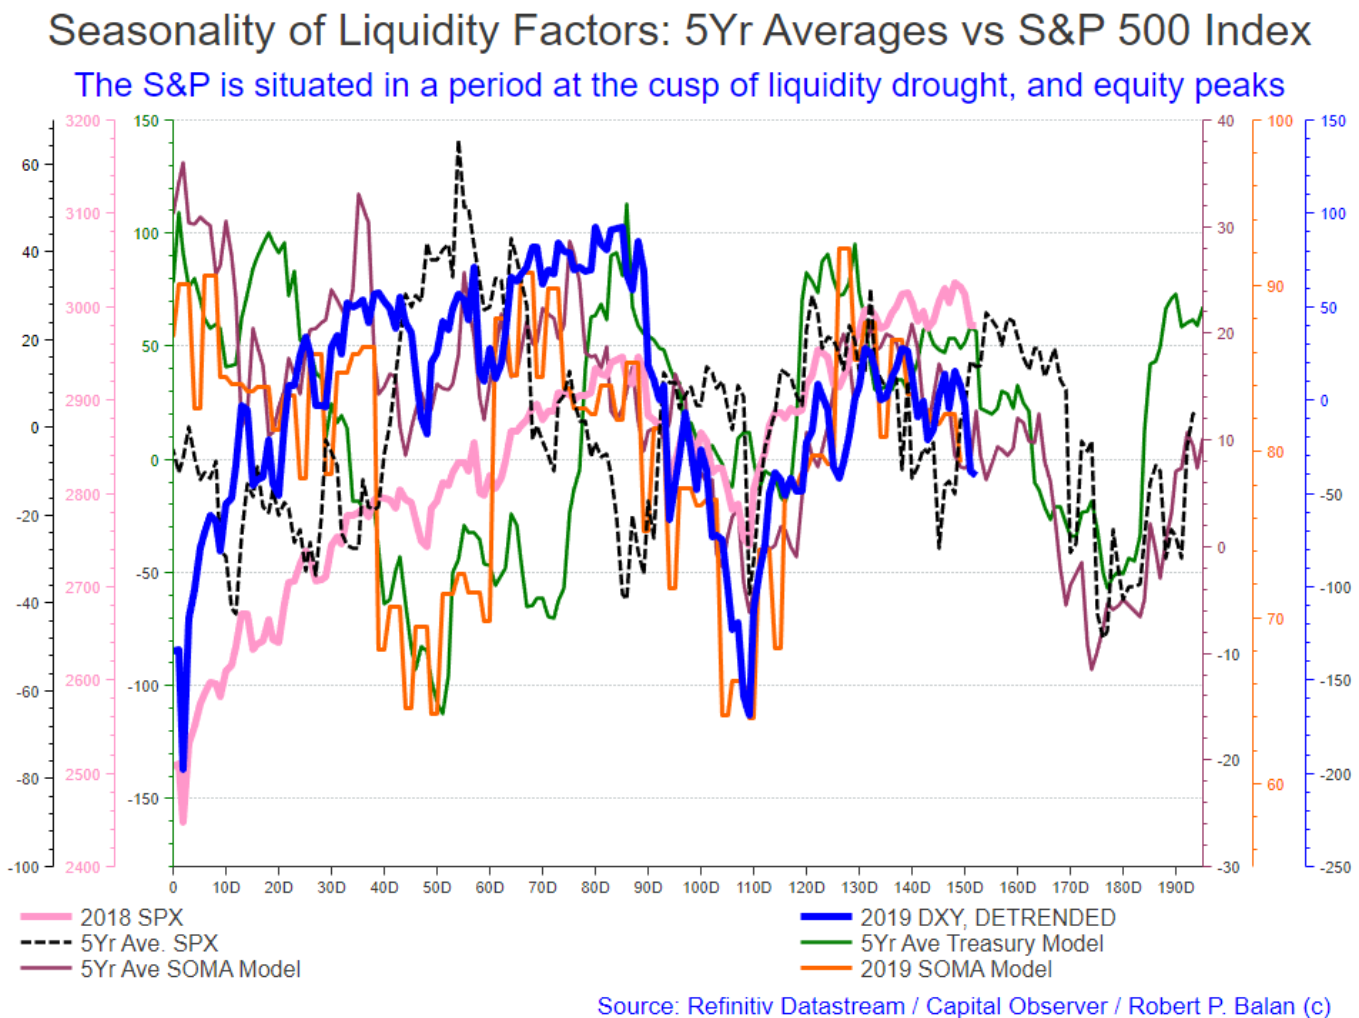
We are approaching a short-term stock market support, which looks to occur after a week.
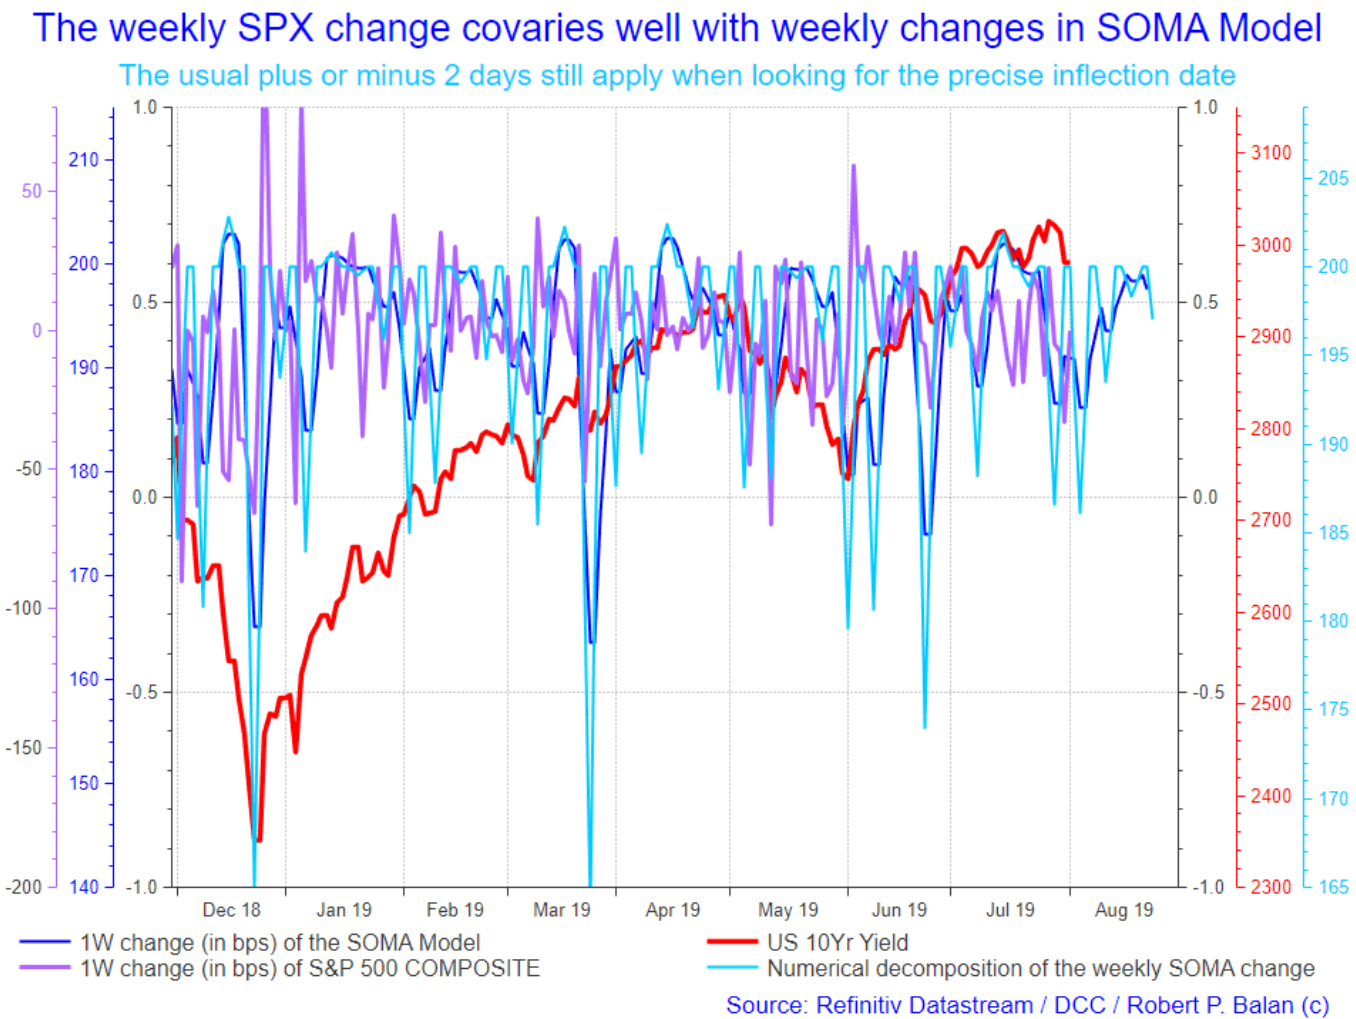
And that is supported by high-frequency analysis. The current consolidation period should resolve into further declines until August 5 or 6, if the inflection points in the models are correct. Then we may have barriers appear sometime in August 22, plus or minus 2 days.
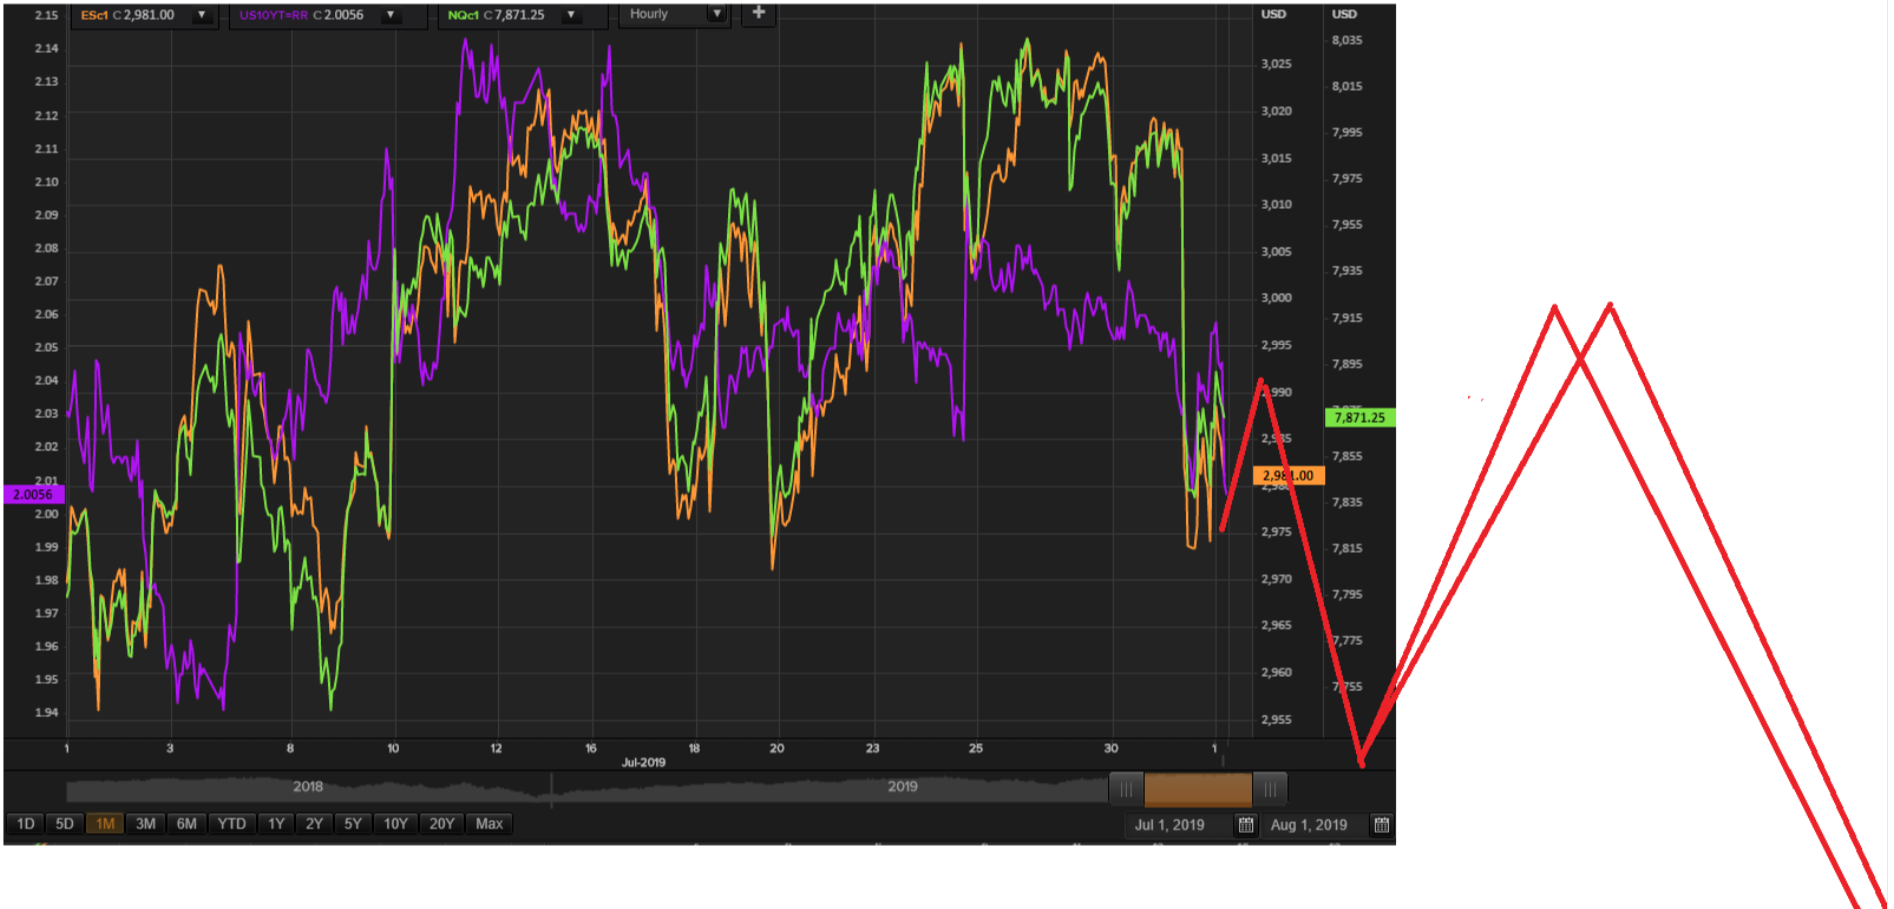
If we illustrate these inflection points, and throw in a little of EWP considerations, the path of the equity markets should look like the chart below.
vjapn @vjapnAug 1, 2019 3:24 PM
Robert, sorry to interrupt, however I think the chart has incorrect pricing. ES had a low of 2958 yesterday and this chart shows around 2975.
Robert P. Balan @robert.p.balanLeaderAug 1, 2019 3:25 PM
These are the futures contracts vjapn on hourly basis. Let's see the higher frequency.
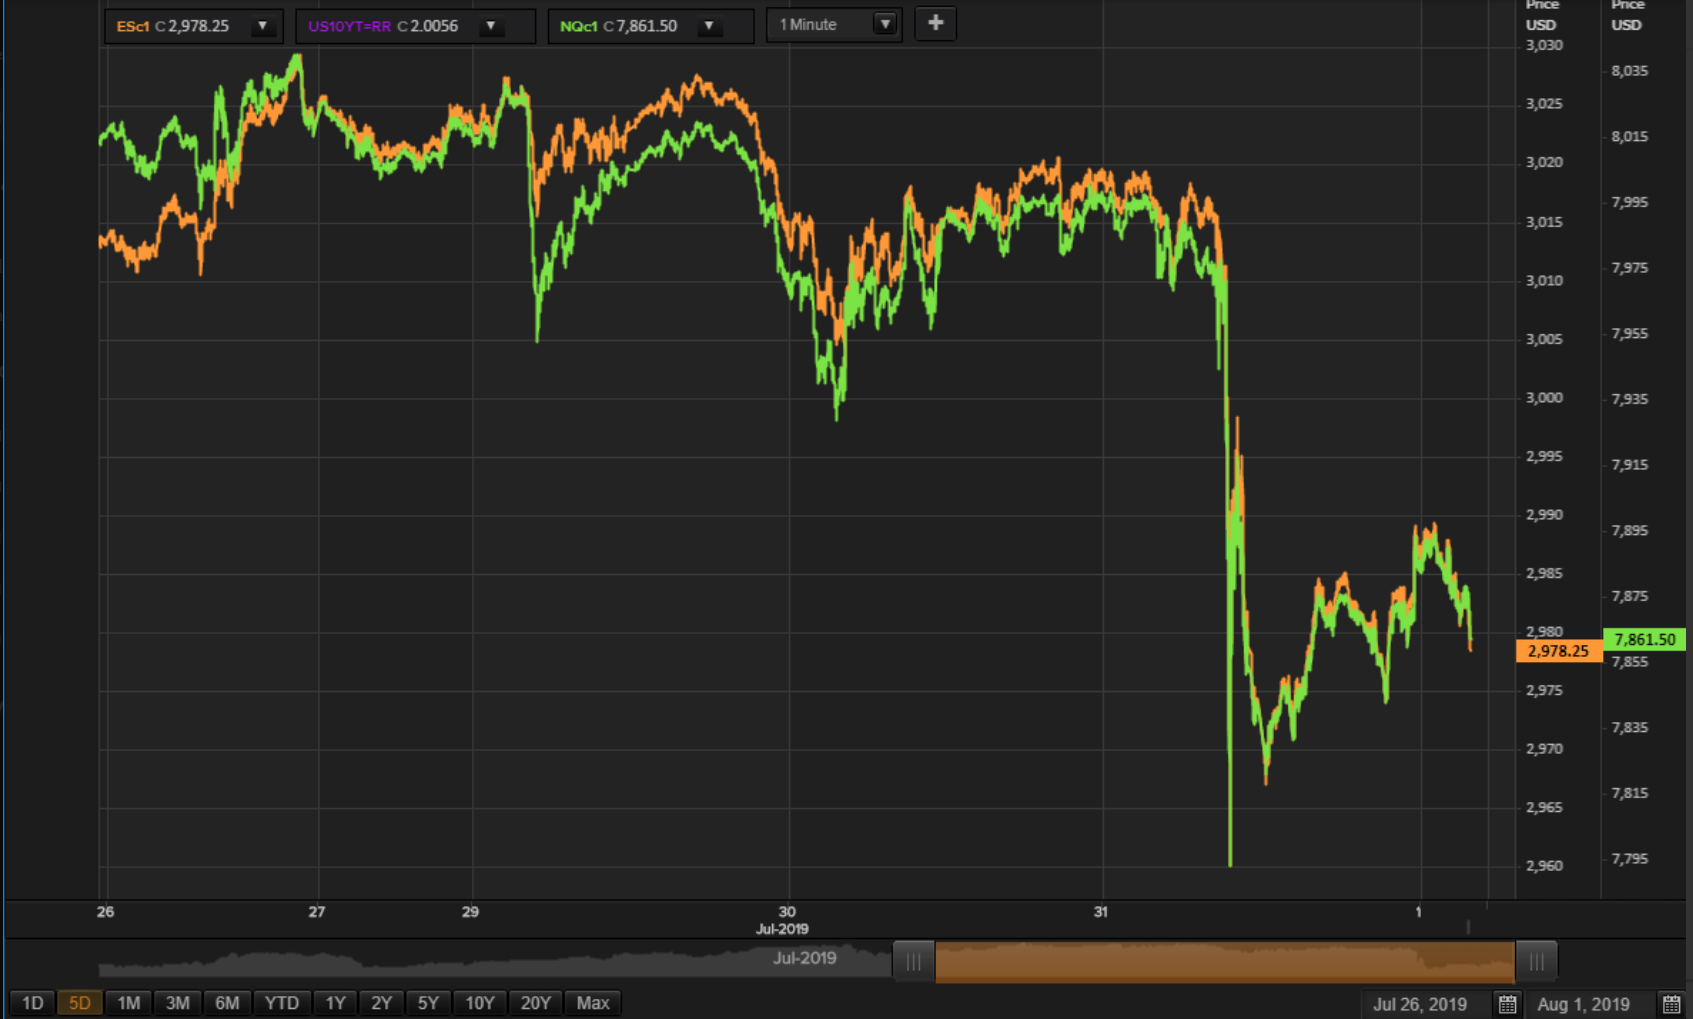
Yes, the minute chart shows 2960.
The charts are only for illustration purposes of what we believe will happen next.
Do not take the inflection points of the illustrations as implied targets. We will define targets on day to day.
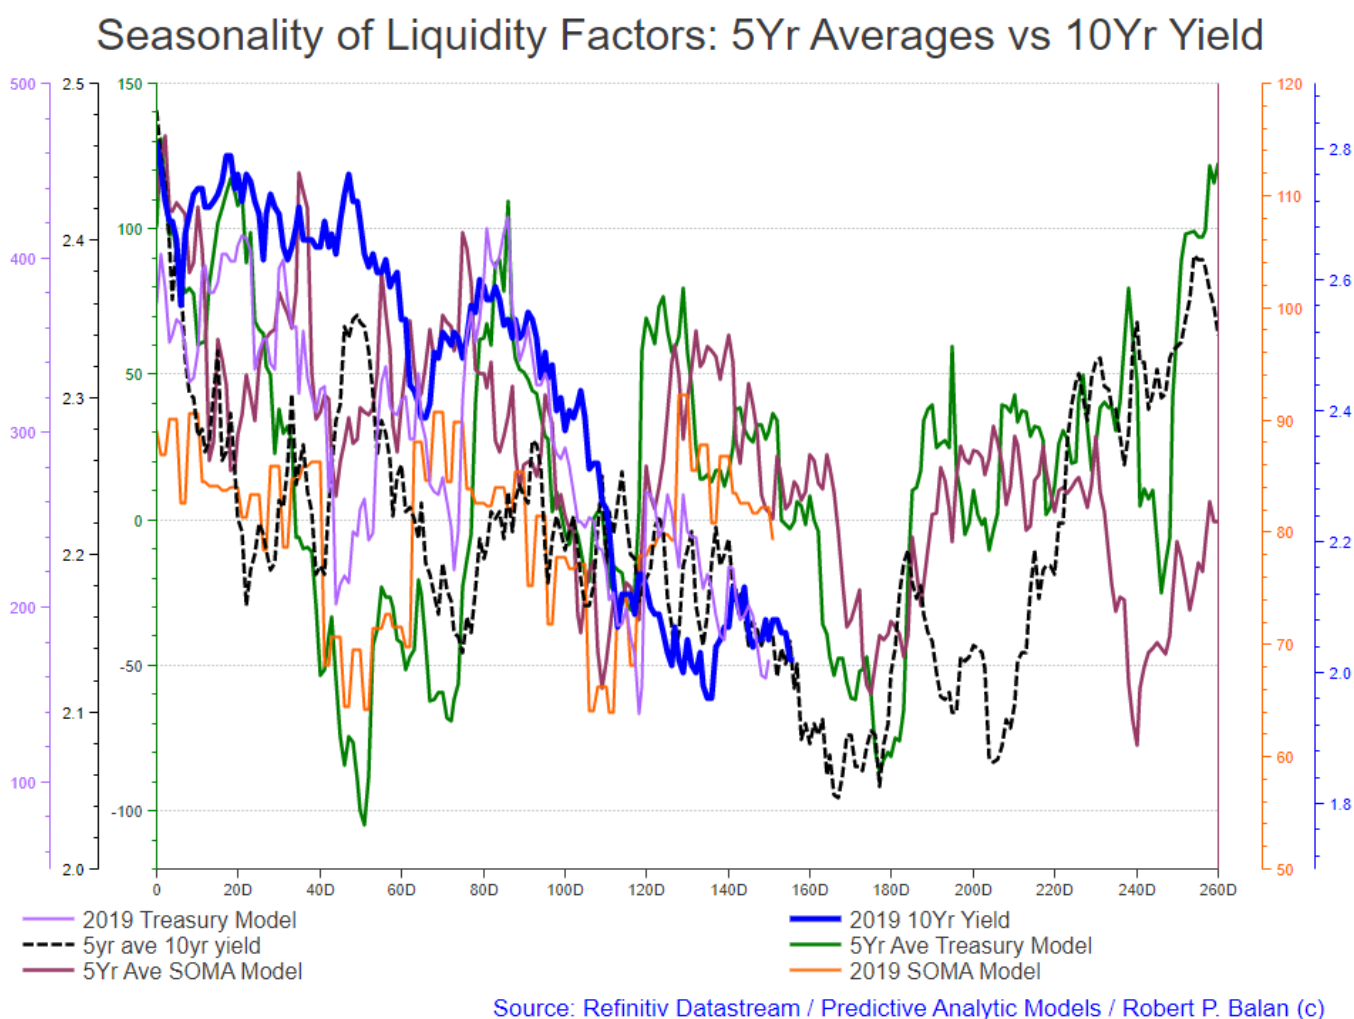
This is how the Treasury and SOMA liquidity models are in relation to the current 2019 10yr yield.
We are making some ad hoc adjustments from day to day because the inv banks' front run period has been ranging from 10 to 8 days.
But by and large, the bottom of the 10yr yield may seen in two weeks, if the current yields perform more or less in accordance with what we have seen in the past five years,
The decline could be longer if we eventually get a deep dip in yields sometime during Trading Day 180.
Acetaia @acetaiaAug 1, 2019 3:43 PM
Some questions on the sp500 to clear things up: 1)You generally mentioned that the selloff will last till 5 august some days ago and then will resume for 2 weeks surging is that still true? 2) What means we are approaching a bottom. Is the bottom now building or at the end of the week where the red lines go down? Sorry for interruption.
Robert P. Balan @robert.p.balanLeaderAug 1, 2019 3:43 PM
acetaia
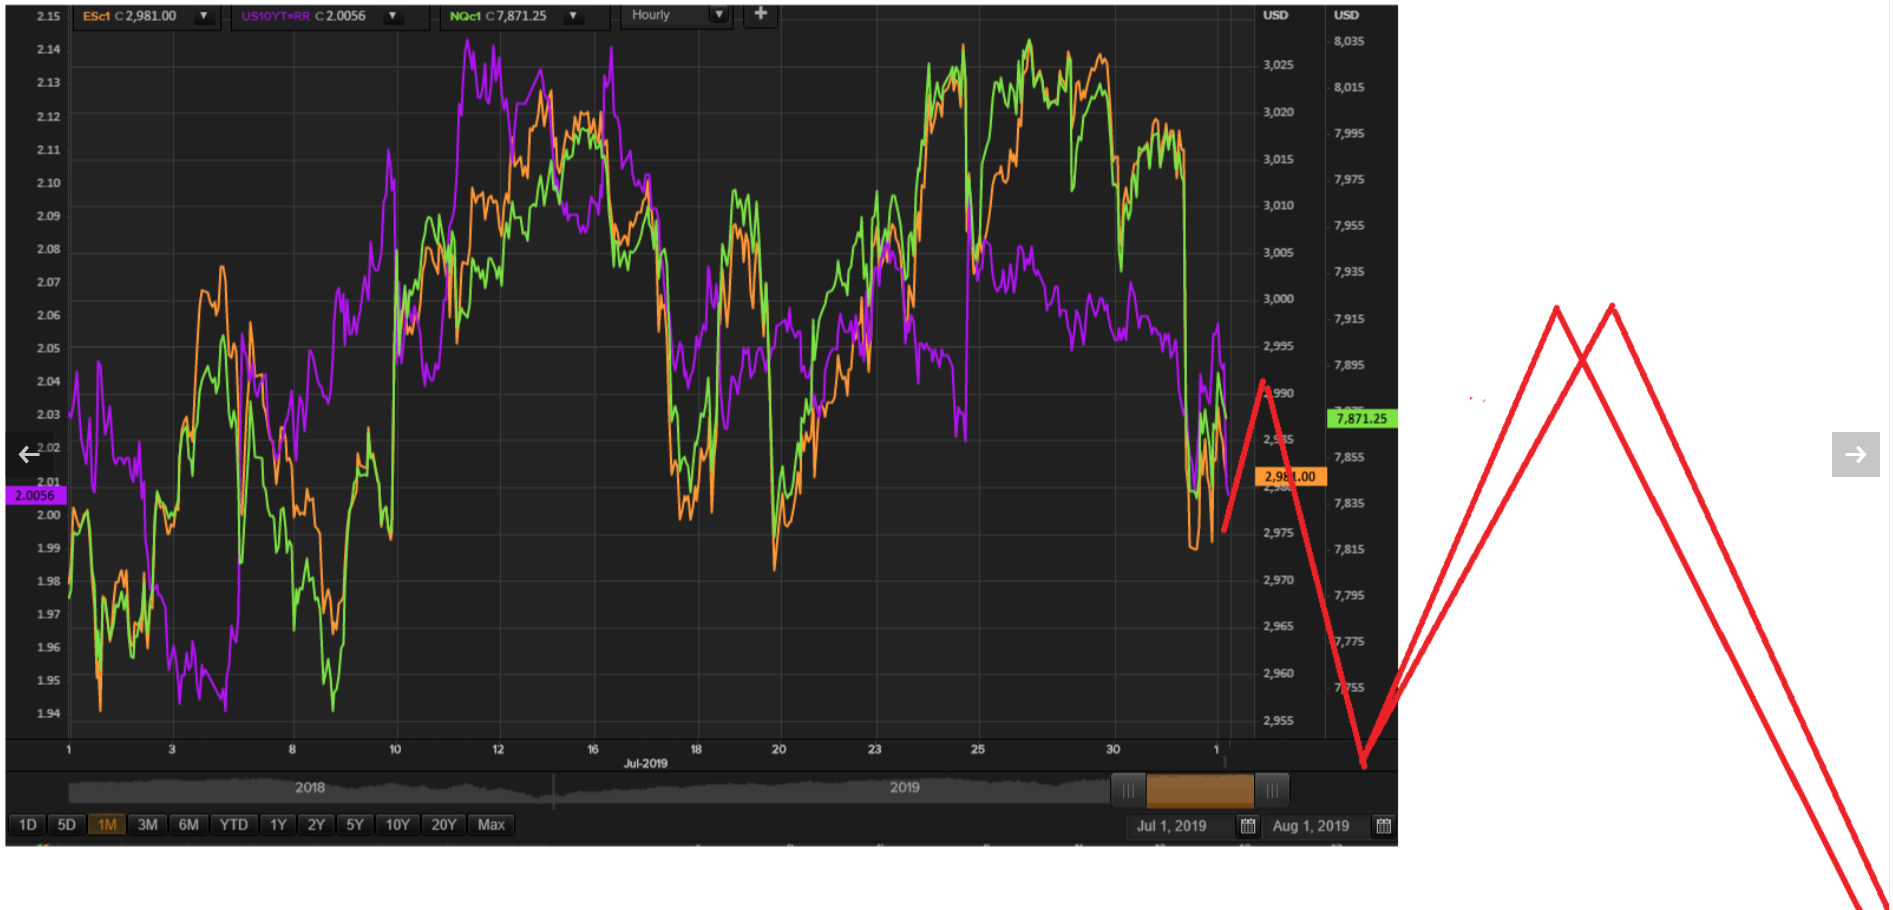
The bottom of the lines represent the August 5 trough that the High Frequency (HF) model is showing. The two week rebound is illustrated as well, followed by a sell-off which we are not yet seeing in the HF model, but very clear on the 5year averages. The illustration may not be accurate on both x and y axis -- I am drawing this via MS paint, so it is inaccurate at best.
Robert P. Balan @robert.p.balanLeaderAug 1, 2019 3:51 PM
You have to extend the implications of the HF models (which have limited forecasting properties) by projecting those HF models in the longer term chart which covers the period up to late October (above). But you have to do it in your head.
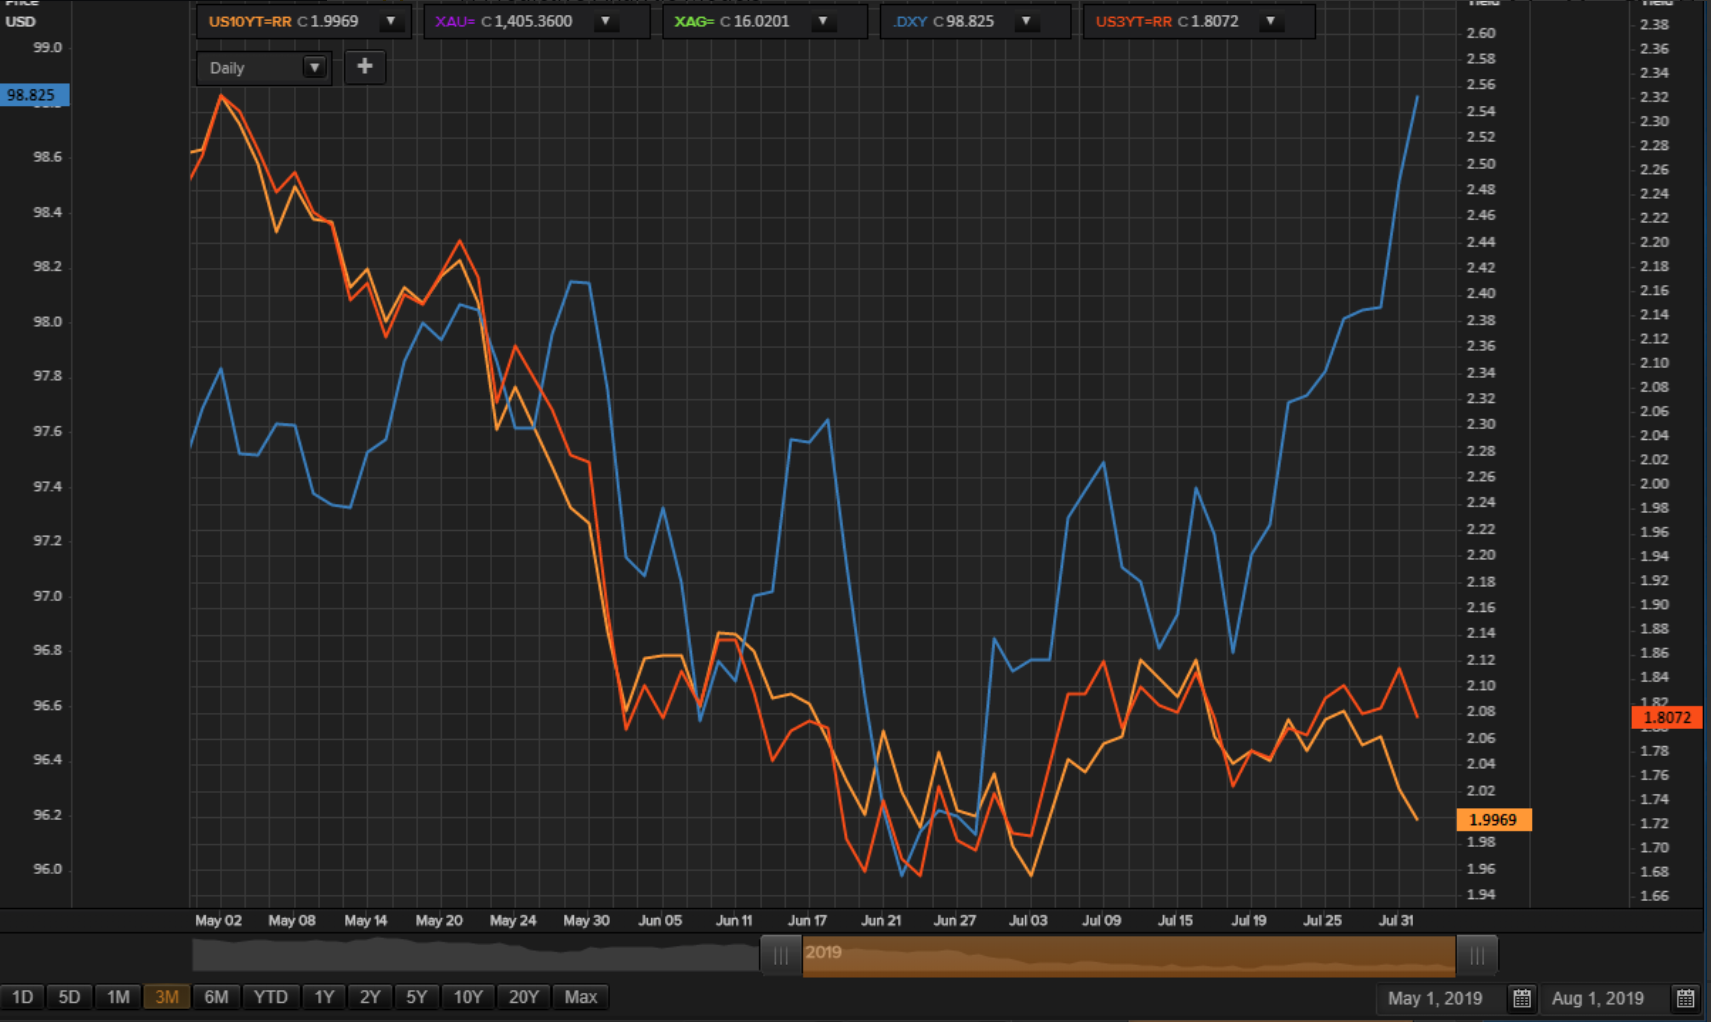
The DXY has been diverging from short term and long term yields for about 8 days now. It is noted that the DXY does this every now and then, but eventually ends up following the lead of the yields -- higher or lower. In the current case, with yields expected to fall further, then DXY should be repriced appropriately lower at some point,
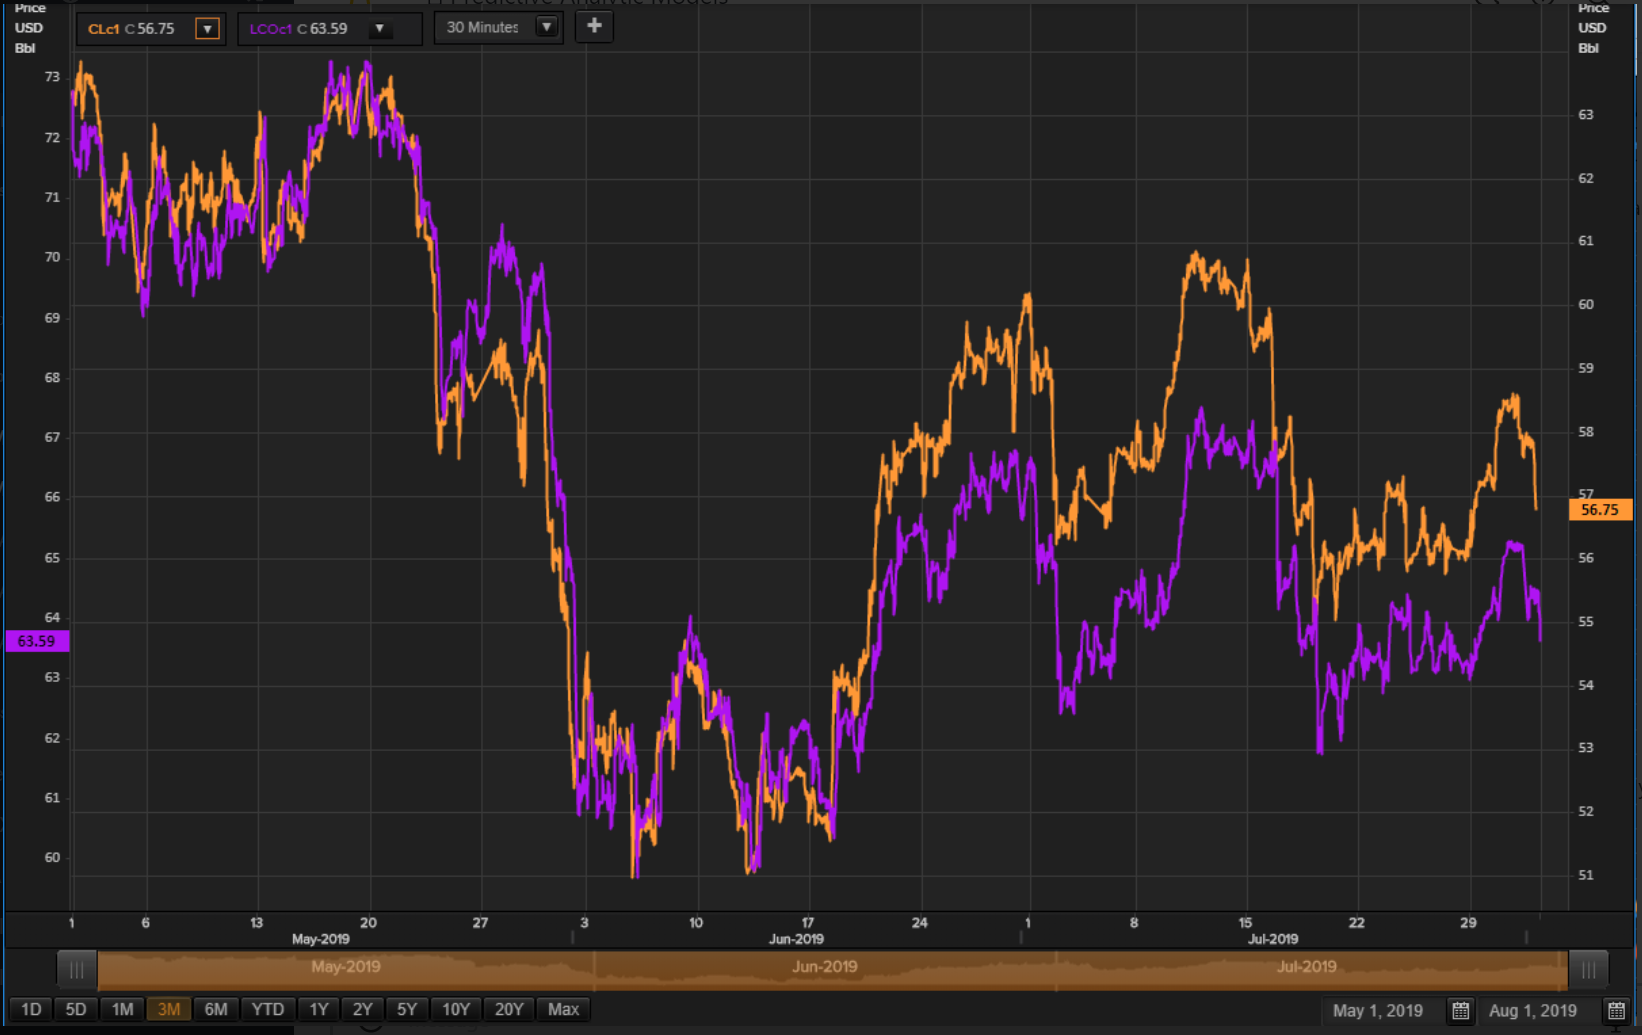
Crude oil prices are pulling back. Our thesis for higher crude prices remains nonetheless. We will just to wait out natural market fluctuations. I will extend the oil piece I wrote in the market report yesterday, and do it as a strand-alone article for PAM later in the day.
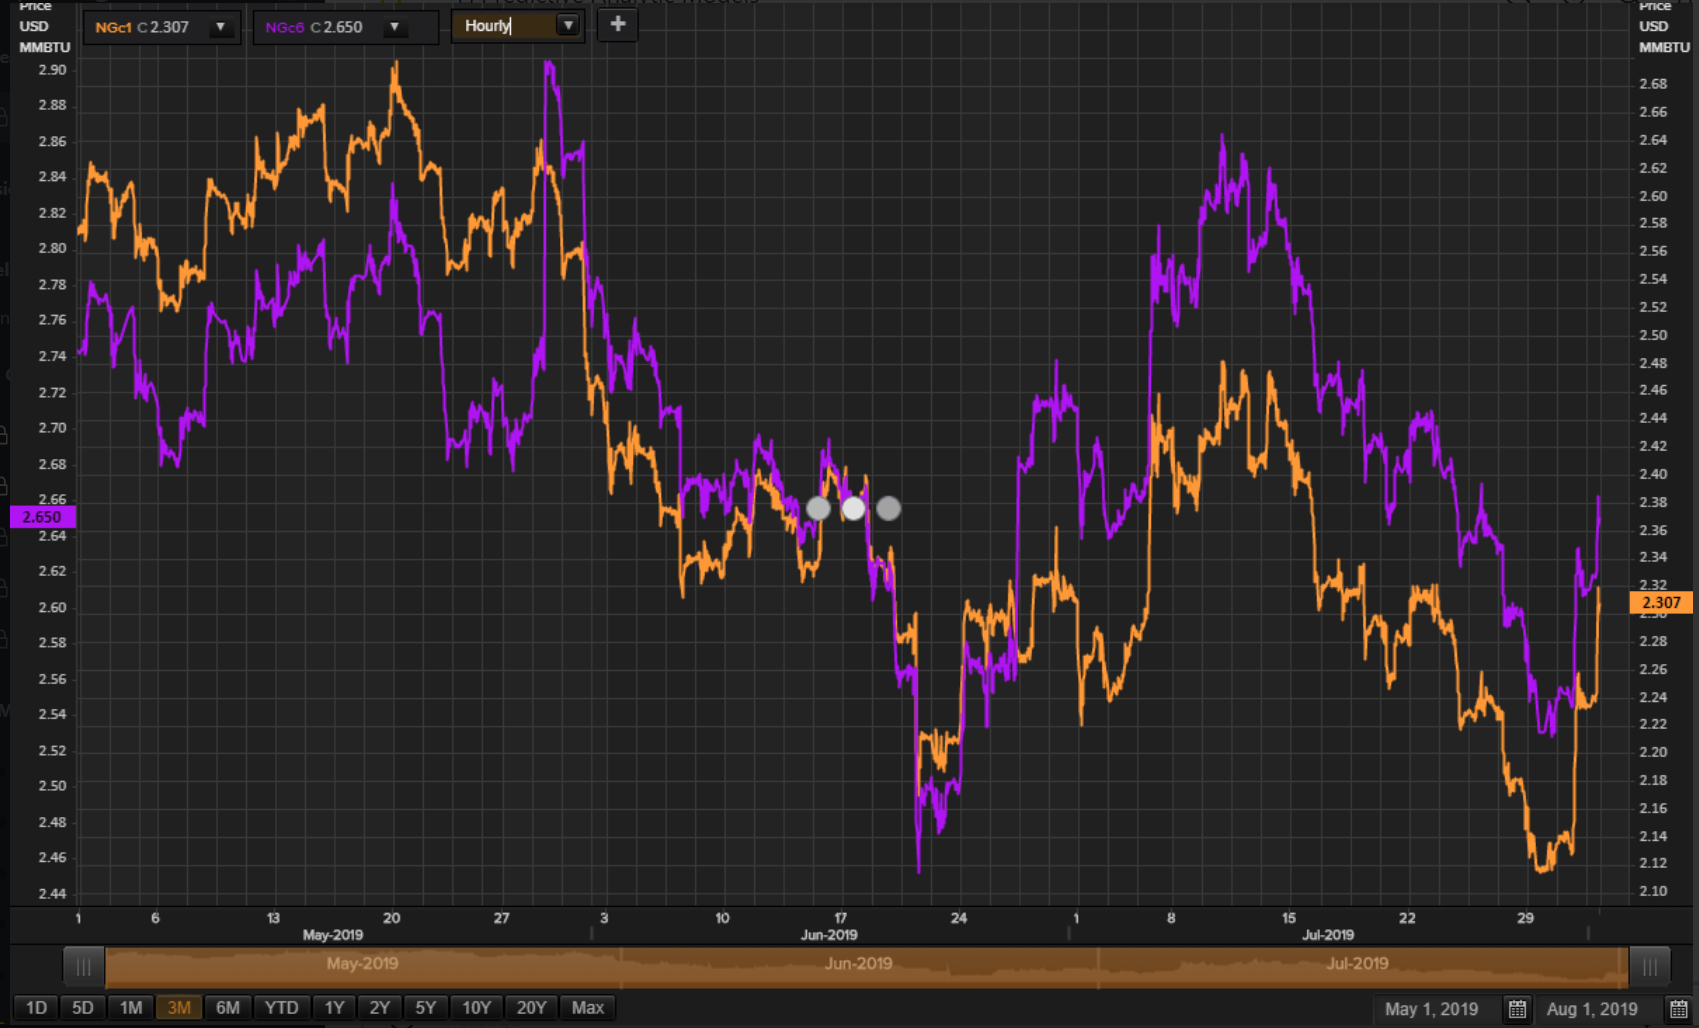
We have seen some impressive recovery in NatGas, and higher frequency wave analysis already shows five almost completed. We should see a correction of 50 pct or more as te next move in NG, and PAM will be looking to go long after that correction is deemed over.
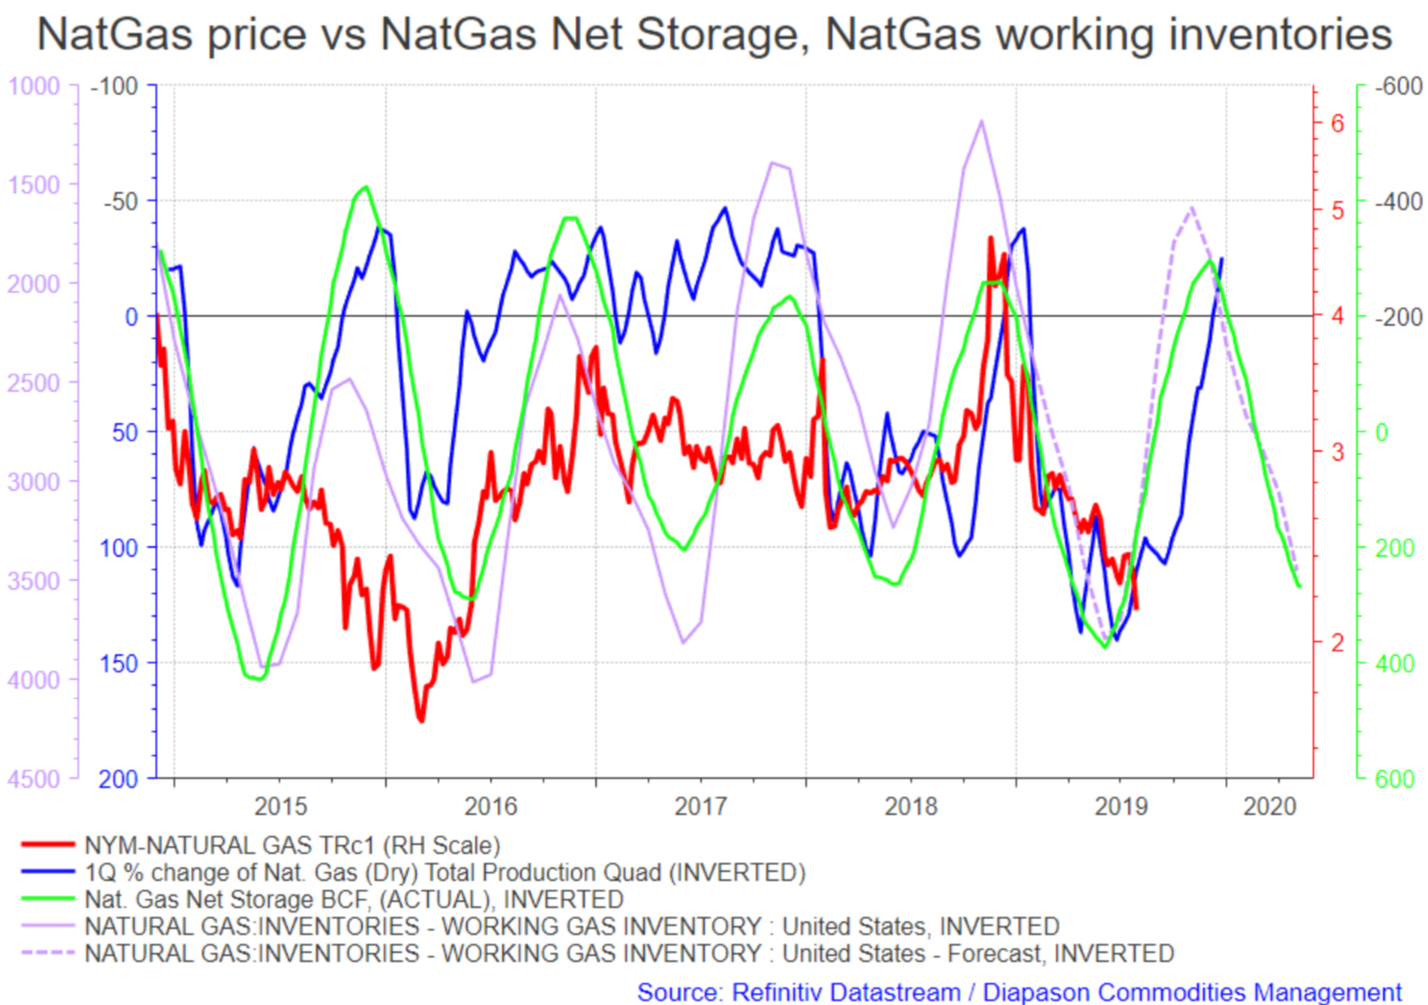
The fundamentals in the longer term outlook for NatGas also look good, and parallels that which we see in crude oil.
Finally, cryptos may have indeed broken out.
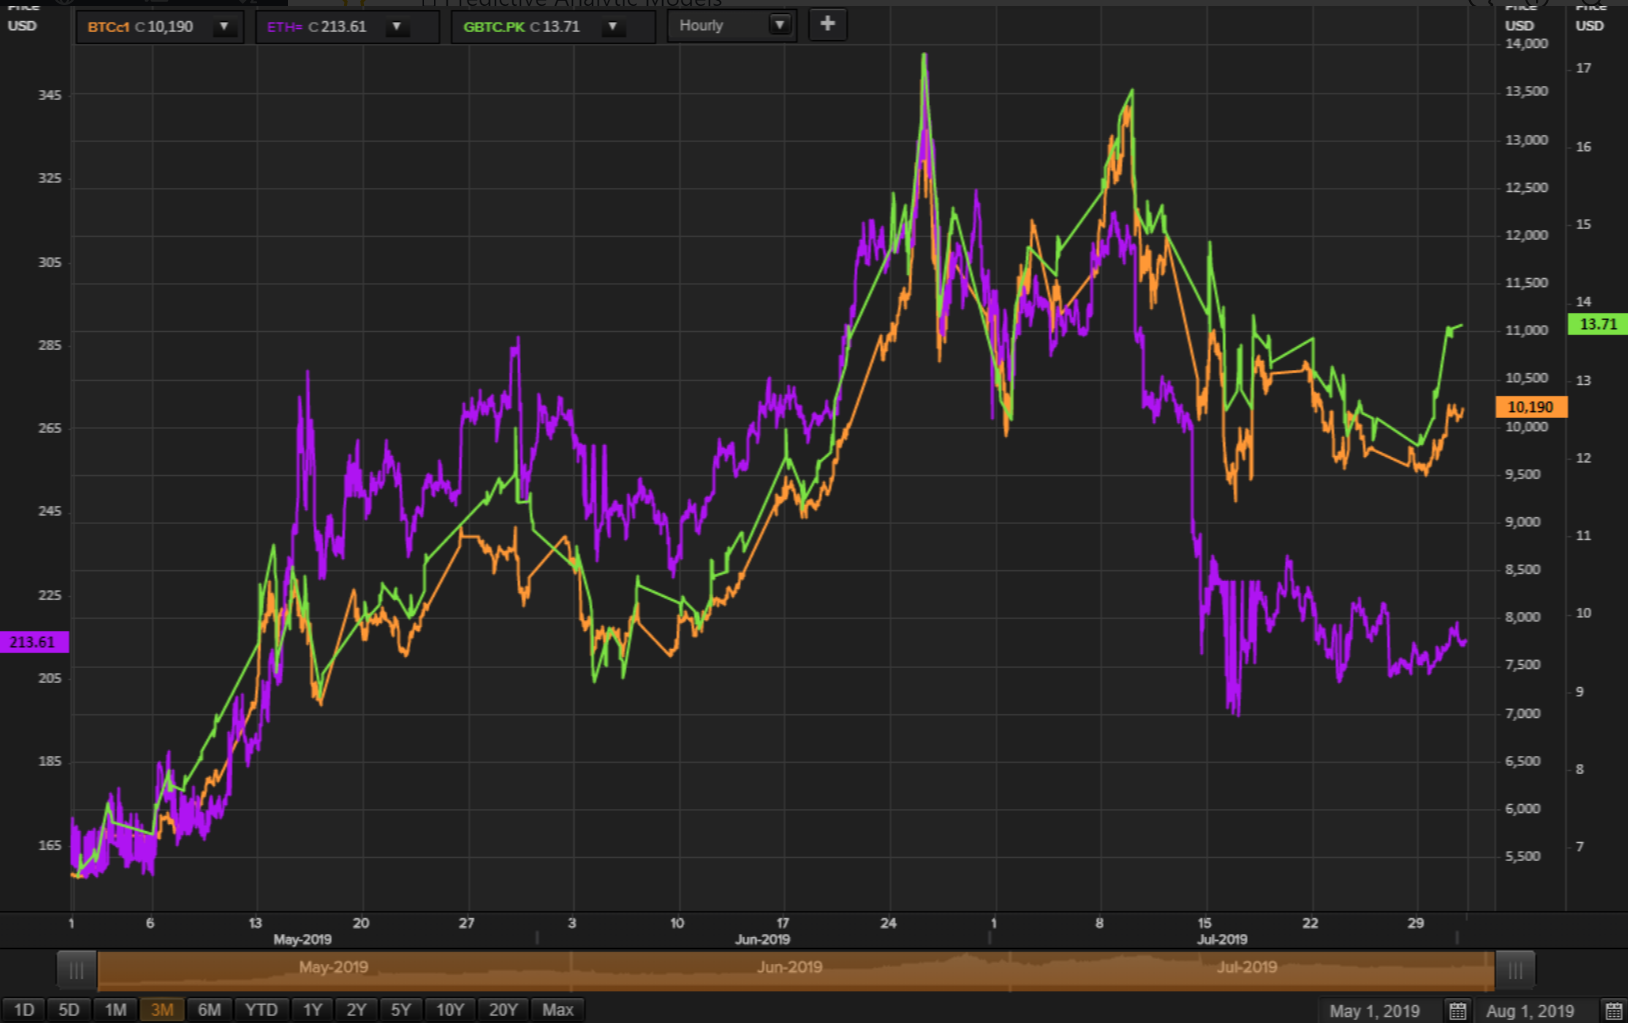
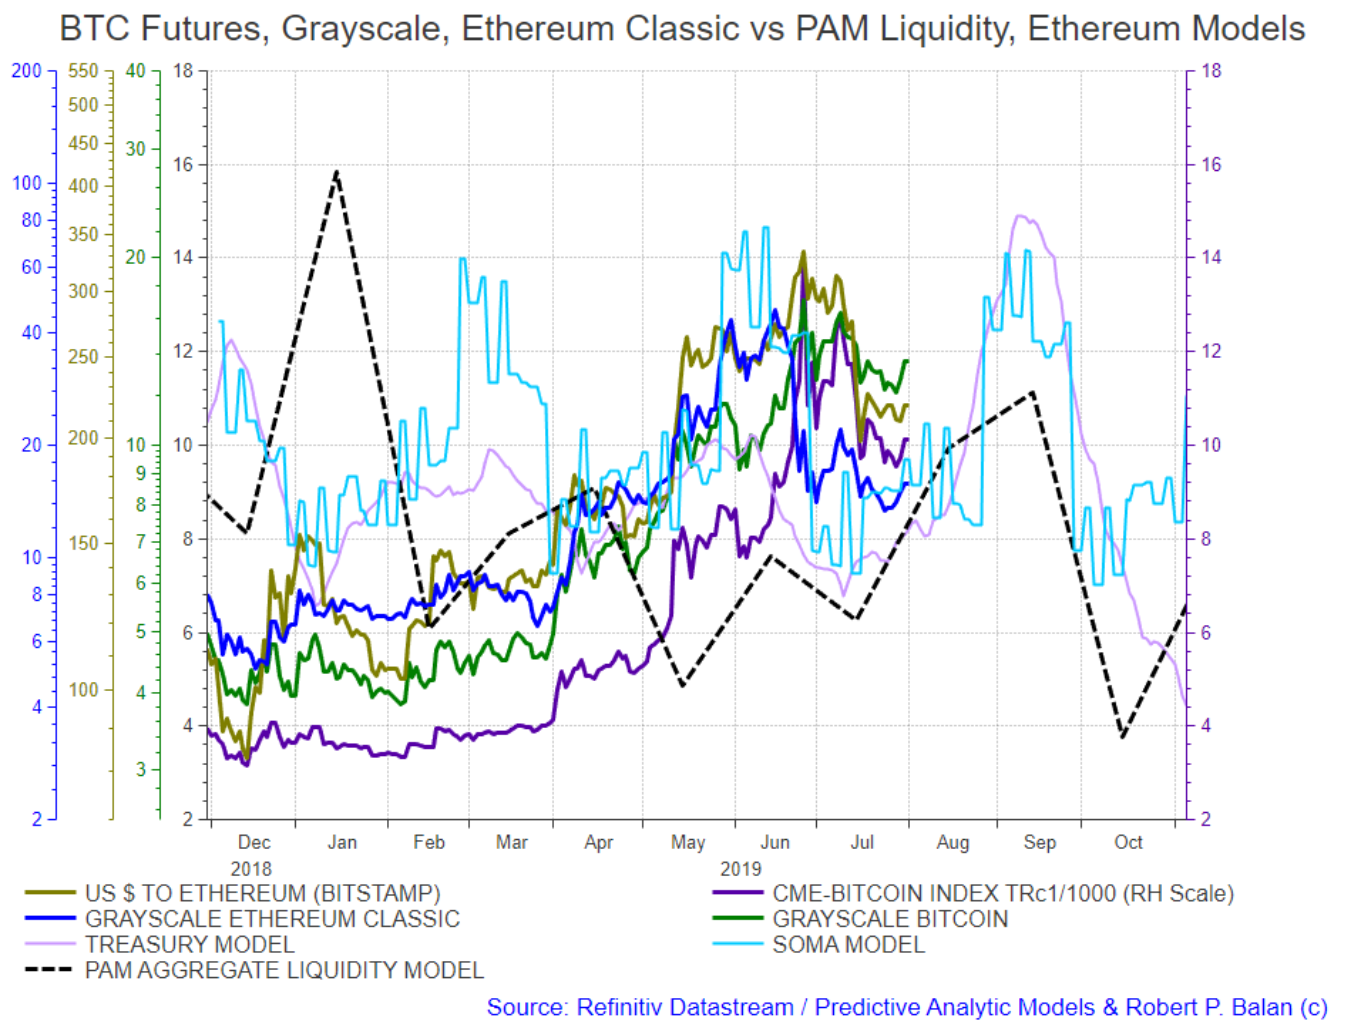
The cryptos have to navigate and up and down situation by mid-August, but that situation may occur with cryptos at higher levels.
The prize is higher crypto prices by first half of September, when the current surge of liquidity from China finally impacts the crypto markets.
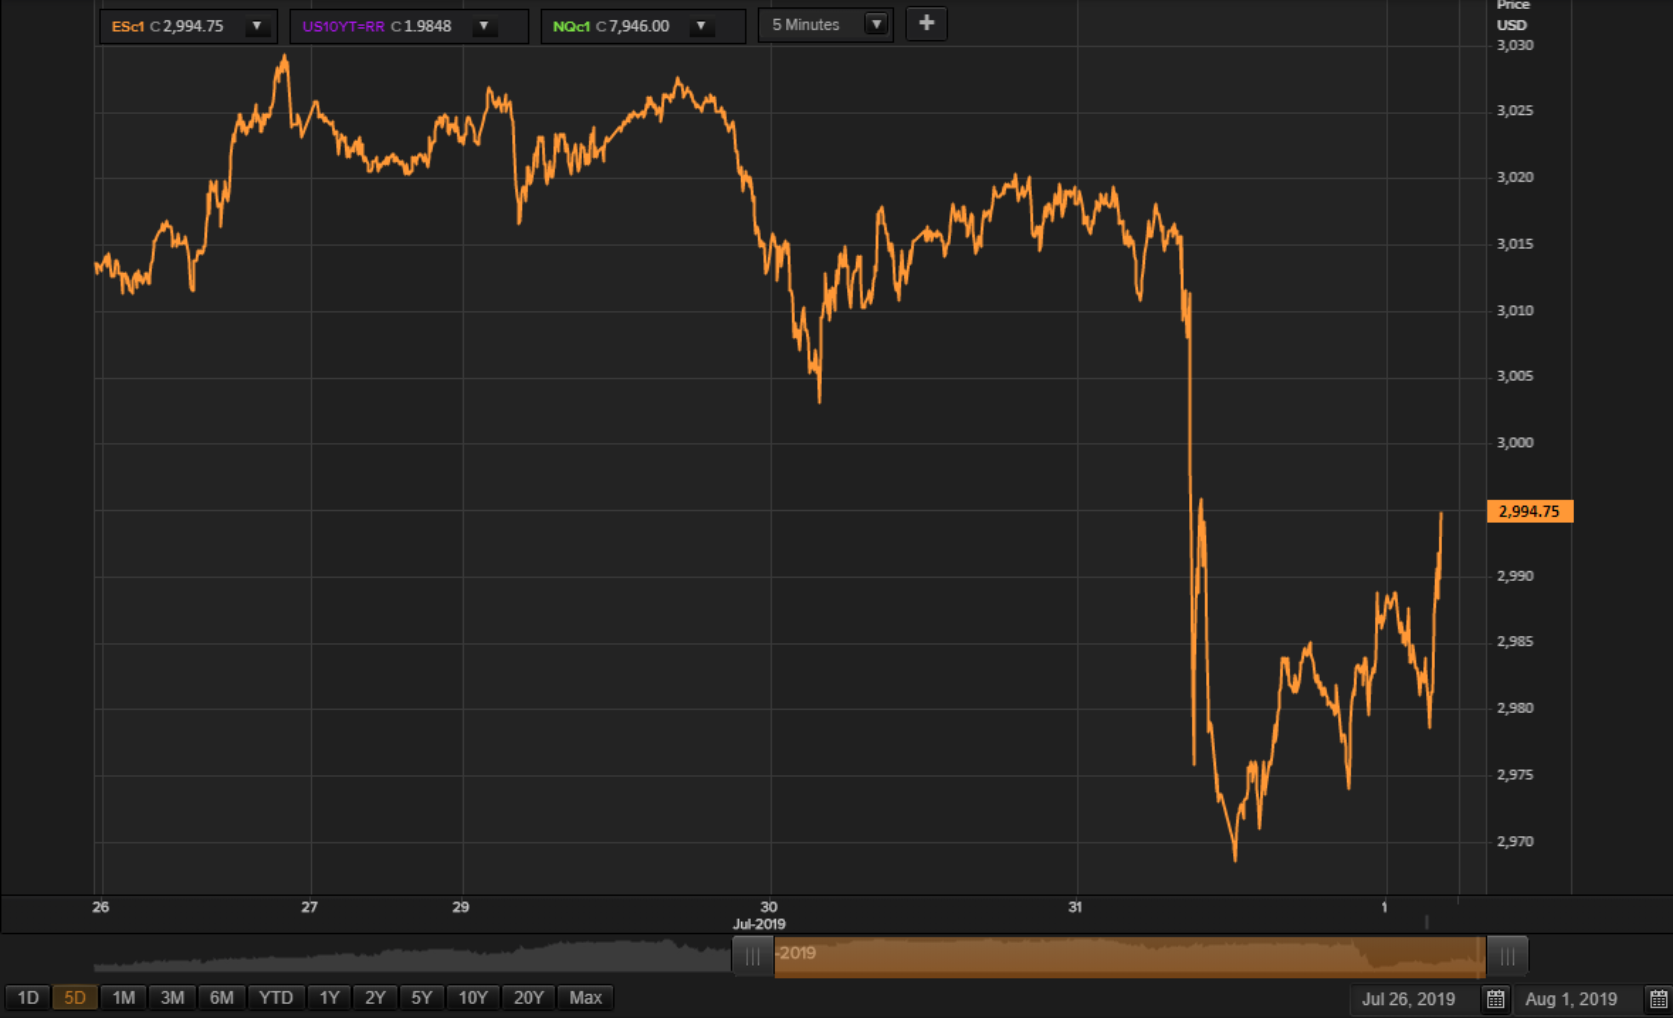
The current equity recovery is indeed looking corrective -- lets see how far it will go.
Open to discussions.
Timothy R. Kiser @timothy.r.kiserModeratorAug 1, 2019 4:45 PM
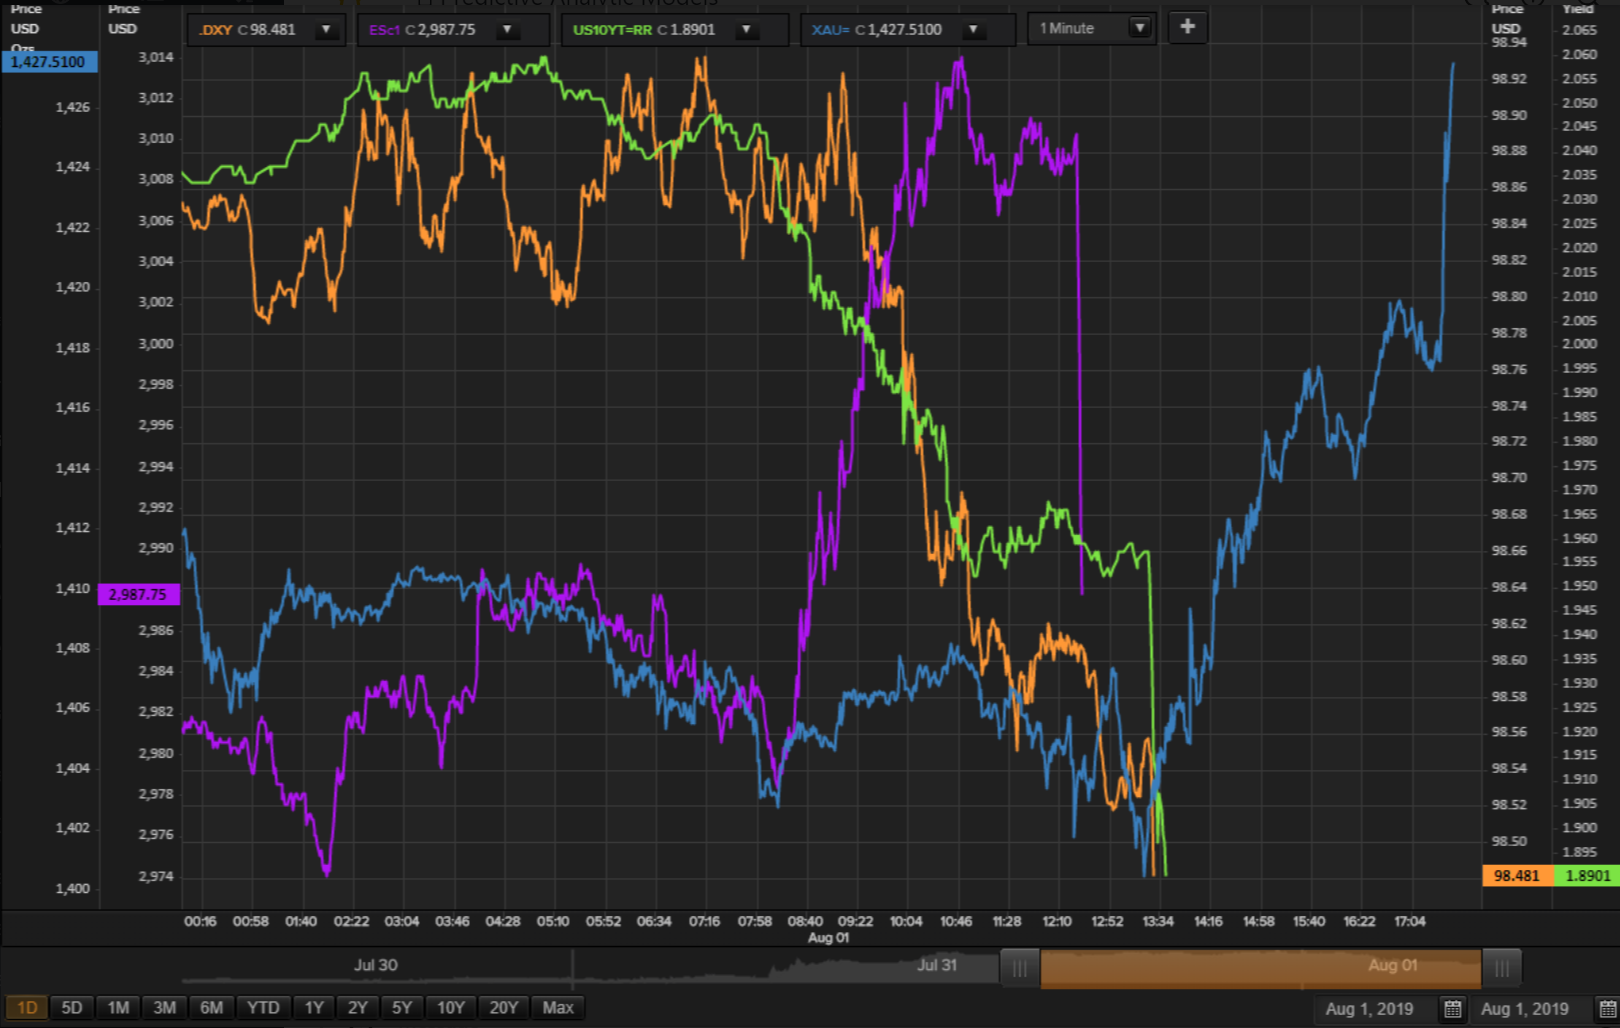
USD rise seems to be abating along with Gold's fall. Gold is now raising and DXY falling on the 1 minute chart.
Of course it can reverse in an hour or so. No prediction.
Robert P. Balan @robert.p.balanLeaderAug 1, 2019 5:32 PM
This is how much of an outlier the current DXY rally is relative to its prime movers and 5yr DXY average
Robert P. Balan @robert.p.balanLeaderAug 1, 2019 5:33 PM
This extraordinary US Dollar rally will be repriced appropriately lower accordingly, very soon.
Alan Longbon @Alan.LongbonAug 1, 2019 6:27 PM

Senate approves Trump-backed spending, debt limit bill - Reuters
The U.S. Senate on Thursday passed legislation supported by President Donald Trump
Robert P. Balan @robert.p.balanLeaderAug 1, 2019 6:28 PM
If you receive an email with this headings:Market Report At The Chat (July 18, 2019): PAM Buys PMs, Miners Oil, Refiners And Cryptos; Sells Equities On A Corrective ReboundPlease disregard - I posted that in the free PAM blog, but I forgot to exclude the PAM community from the email list. My apologies.
vjapn @vjapnAug 1, 2019 7:19 PM
Robert, any thoughts on why crude is selling off instead of rallying?
Robert P. Balan @robert.p.balanLeaderAug 1, 2019 7:21 PM
Looks like the energy sector is on brief repricing mode. The NatGas upmove could be retraced 60%, even more.
Robert P. Balan @robert.p.balanLeaderAug 1, 2019 7:25 PM
vjapn
Crude is synchronizing with NatGas
Robert P. Balan @robert.p.balanLeader
Aug 1, 2019 7:39 PM
Stocks, Yuan, Bond Yields Crash As Trump Unleashes New China Tariffs
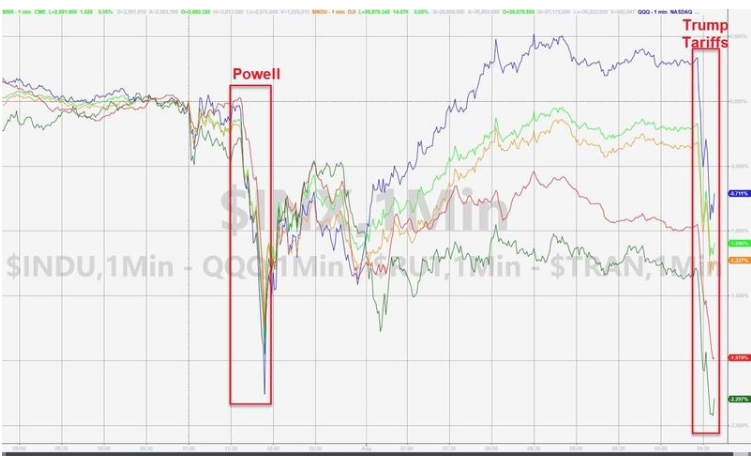
Stocks, Bond Yields Plunge As Trump Unleashes New China Tariffs
"... on September 1st, putting a small additional Tariff of 10% on the remaining 300 Billion Dollars of goods and products coming from China into our Country "
Robert P. Balan @robert.p.balanLeaderAug 1, 2019 7:40 PM
Acetaia @acetaiaAug 1, 2019 7:54 PM
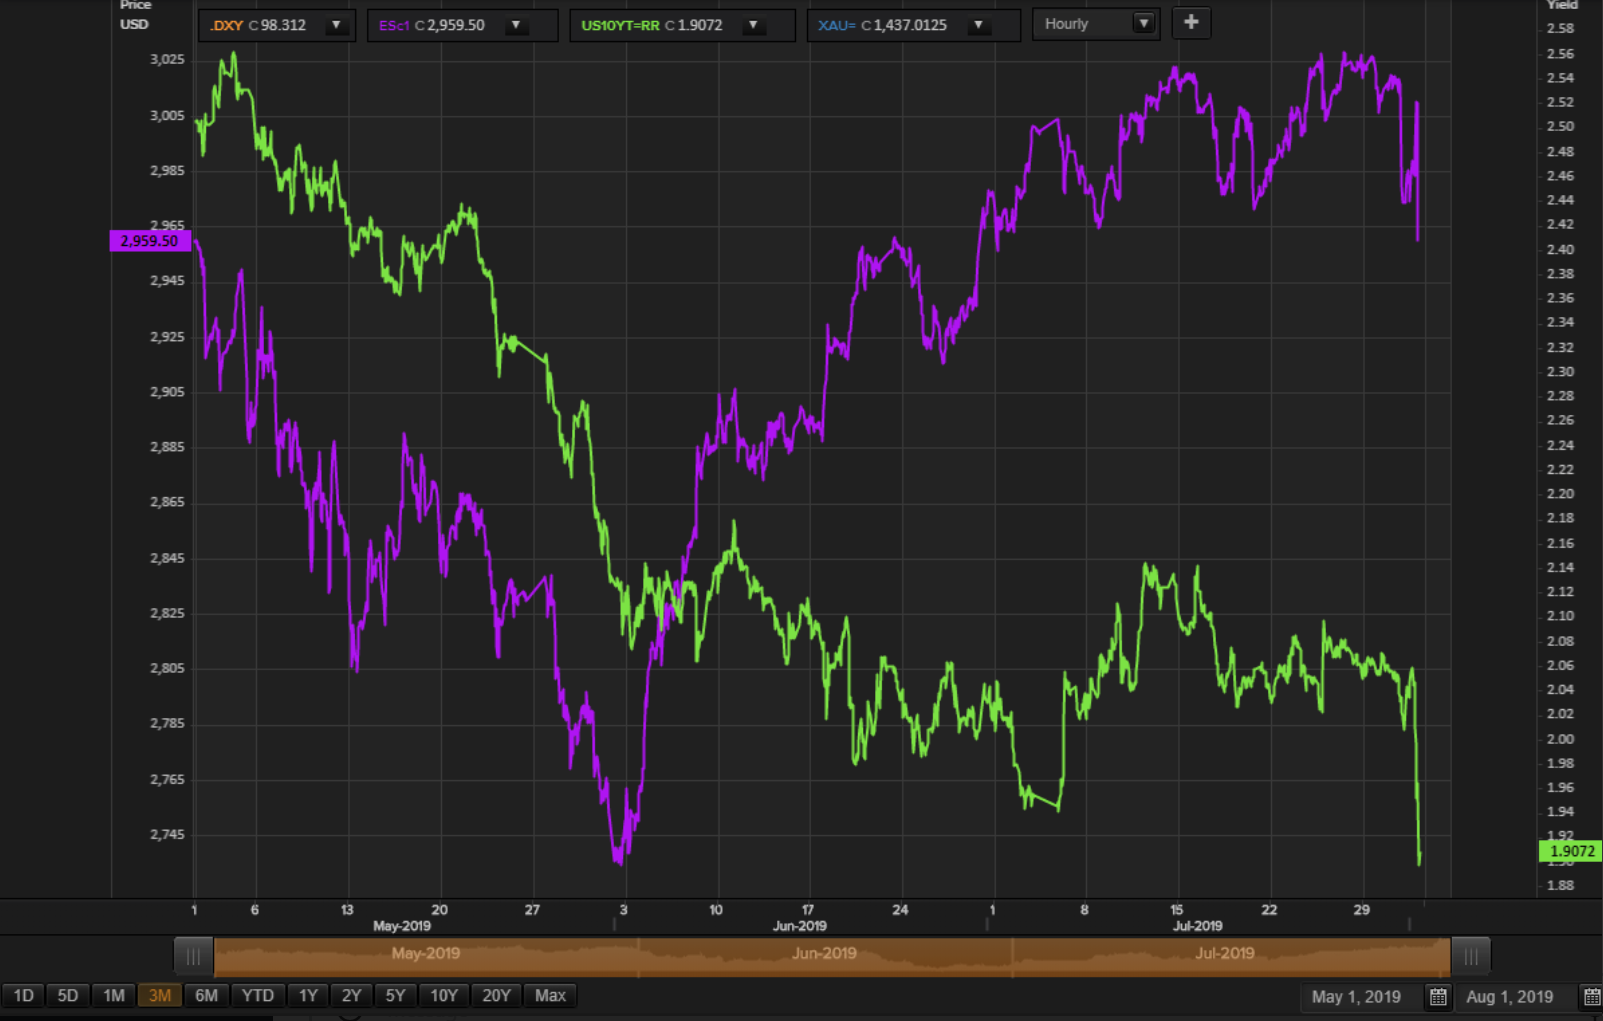
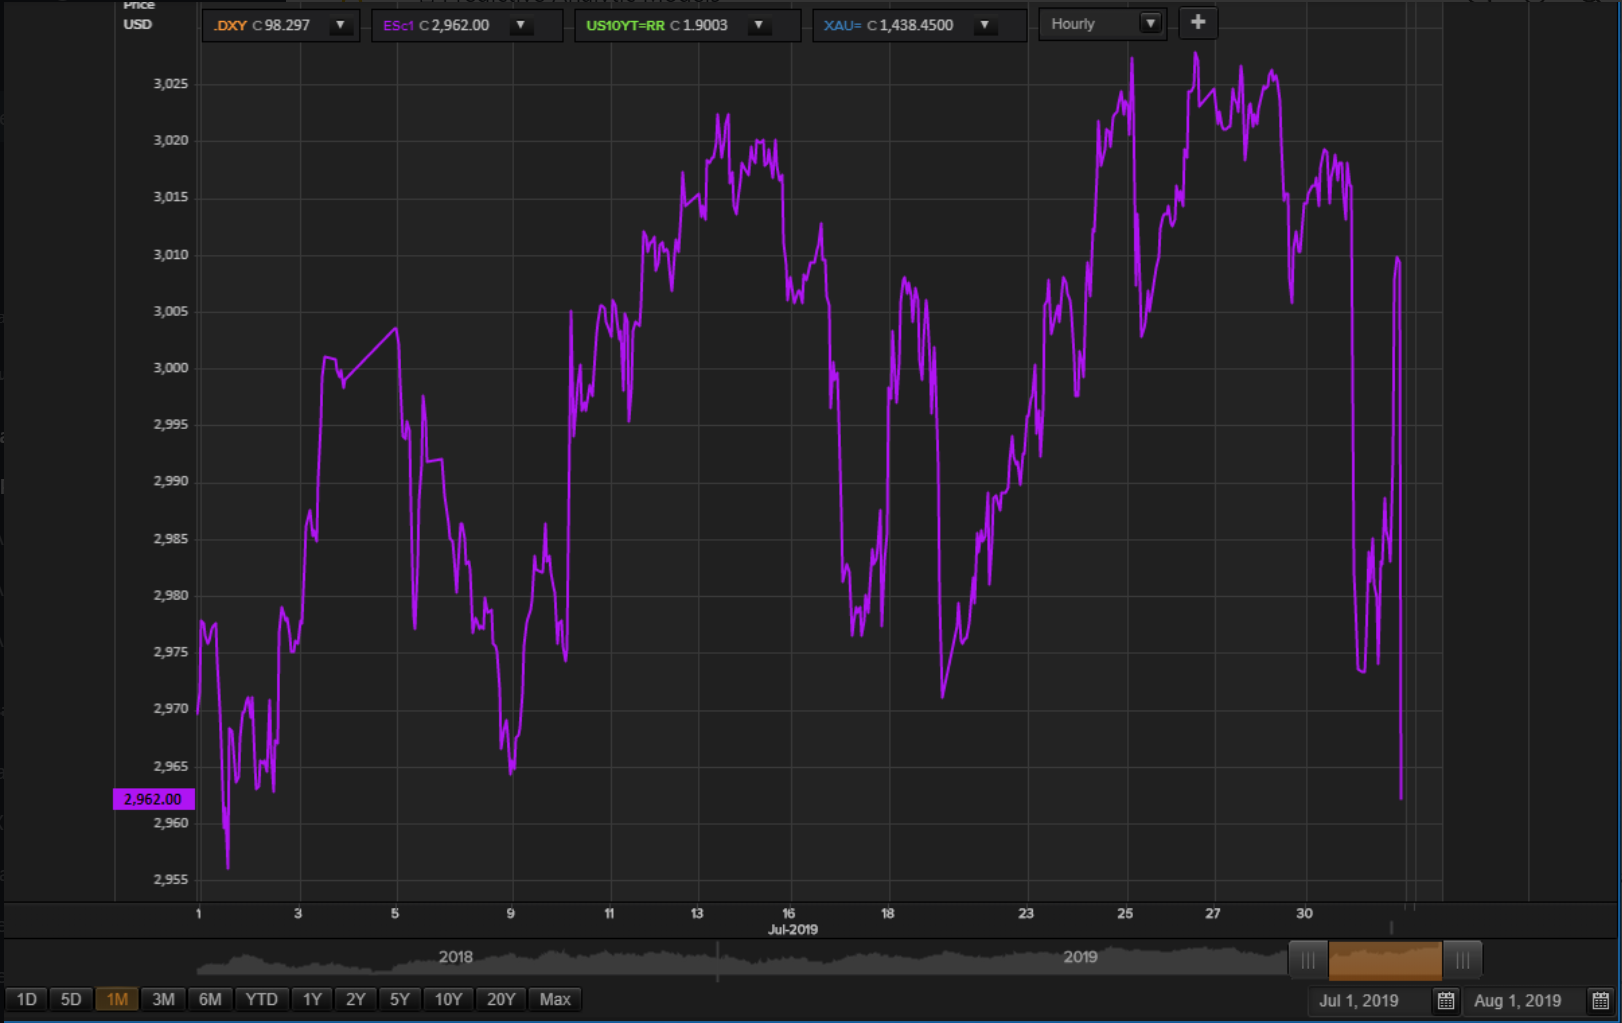
The downside Target for this move in sp 2950 ?
Robert P. Balan @robert.p.balanLeaderAug 1, 2019 8:05 PM
2950 - 2945 would do acetaia
Robert P. Balan @robert.p.balanLeaderAug 1, 2019 8:06 PM
Even 2955 looks good
vjapn @vjapnAug 1, 2019 8:08 PM
Robert, Is PAM looking to exit index shorts?
Robert P. Balan @robert.p.balanLeaderAug 1, 2019 8:11 PM
No vjapn -- but don't let that stop you if you want to exit at a low. But that said, let me speak with Mr. Kiser and see what he thinks.
Robert P. Balan @robert.p.balanLeaderAug 1, 2019 8:27 PM
SPY (S&P 500) SPXU 27.29 -$0.68 -2.43% 26.77 1.94%
QQQ (NDX 100) SDOW 49.22 $0.77 1.59% 48.18 2.16%
DIA (DJIA) SQQQ 33.12 -$0.82 -2.42% 32.74 1.16%
IWM (Russel) IWM 46.46 -$0.70 -1.48% 44.61 4.15%
TZA TZA 46.46 $0.27 0.58% 44.61 4.15%
TZA TZA 46.46 $0.27 0.58% 44.61 4.15%
TZA TZA 46.46 $0.27 0.58% 44.61 4.15%
SDOW (-3x DJIA) SDOW 49.22 -$0.21 -0.42% 48.18 2.16%
SDOW (-3x DJIA) SDOW 49.22 -$0.21 -0.42% 48.18 2.16%
SDOW (-3x DJIA) SDOW 49.22 -$0.21 -0.42% 48.18 2.16%
On second thought, the model suggests we could see the bottom of this sell-off cycle in 2 more trading days (August 5 low). We will see how it shapes up tomorrow, and decide before the weekend. Mr. Kiser is OK if we do something now. Today is within the plus or minus two trading day spread for the model inflection points.
I would like to respect the model, and see what it will give --- but you don't have to.
You may exit if you wish.
Timothy R. Kiser @timothy.r.kiserModeratorAug 1, 2019 8:43 PM
@all: PAM will hold on to the equity shorts until tomorrow but if you want to exit and take profits that is understood. Read the note above from Robert.
Acetaia @acetaiaAug 1, 2019 9:21 PM
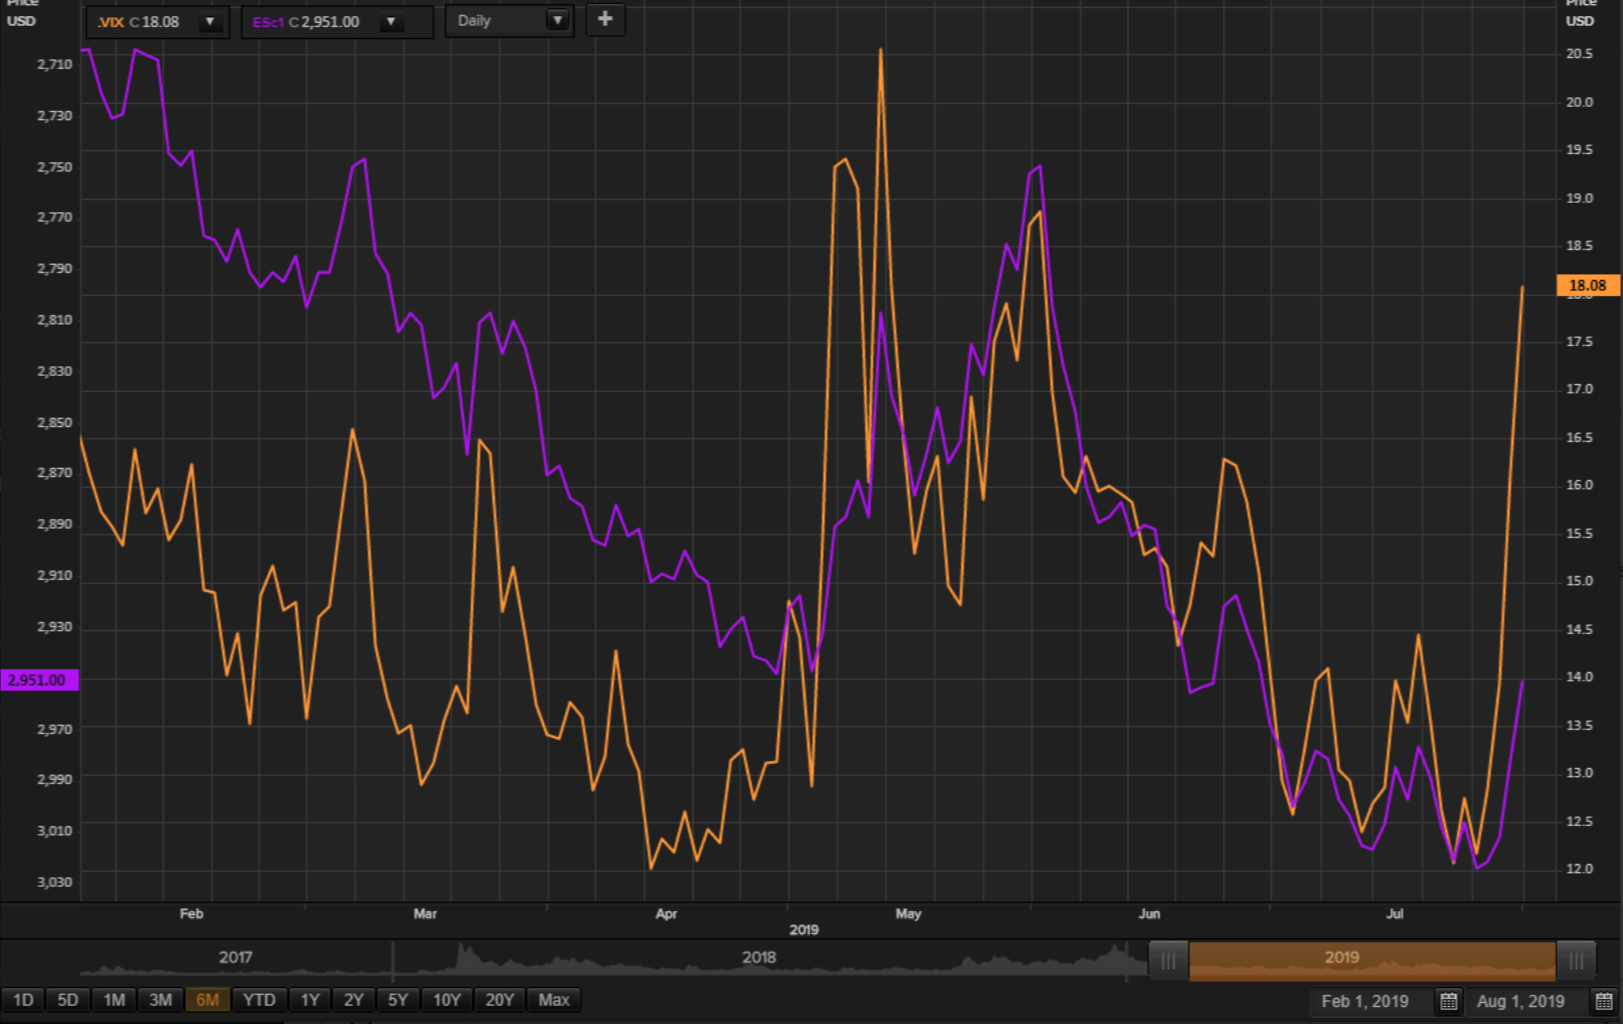
When the vix hits his previous highs between 18.8 and 19.3 could be a good indication for a bottom or what is Mr. Kiser looking for?
Robert P. Balan @robert.p.balanLeaderAug 1, 2019 9:24 PM
The SPX is lagging the VIX. Either the VIX is overbought, or SPX is undersold. Maybe we get more downside moves in the SPX underlying.
lslu @lsluAug 1, 2019 9:24 PM
looks like oil will retest $50 robert.p.balan
Robert P. Balan @robert.p.balanLeaderAug 1, 2019 9:26 PM
lslu -- this is not fundamental based, just a reaction to a tweet from the Donald. No idea how stupid the oil traders will further get, so hard to prognosticate. One thing I am sure -- this sell-off is overdone, do data behind it.
Robert P. Balan @robert.p.balanLeaderAug 1, 2019 9:31 PM
Now, Trump is putting more pressure on Powell by screwing the trade outlook, which Powell said is one reason why the Fed is cutting rates. With this more sour trade prospects, will Powell obey the dog whistle and cut again?
What a mess! This is what you get when you have a Fed chairman with no spine.
lslu @lsluAug 1, 2019 9:31 PM
no trade deal really put pressure on oil price if we look at oil price action so far.
iDoc08 @iDoc08Aug 1, 2019 9:40 PM
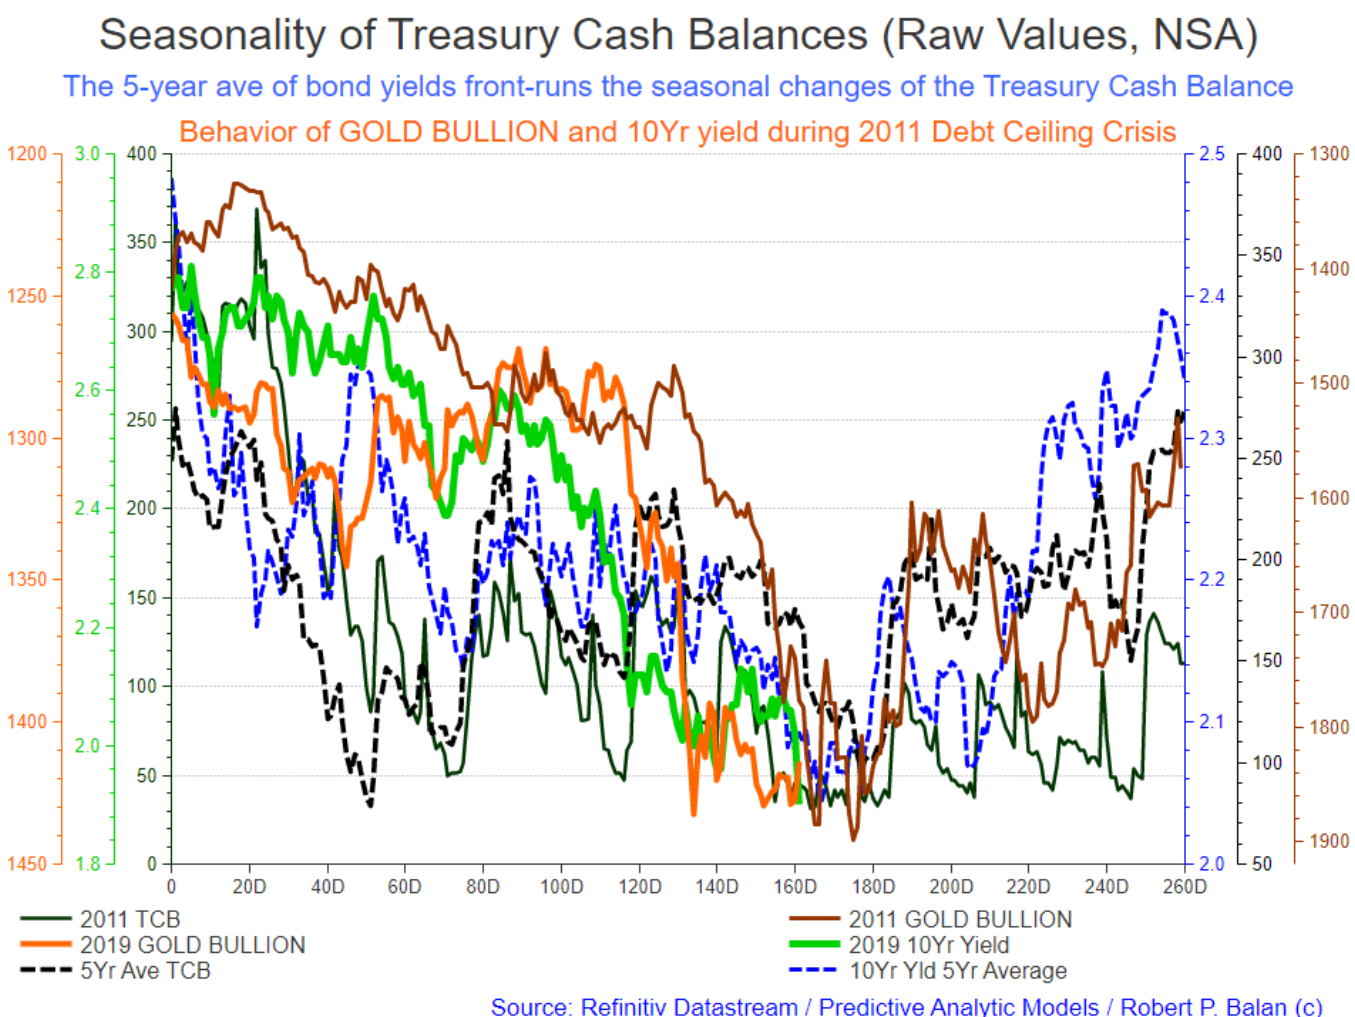
Will PAM be looking at selling gold/going short with the DCC resolution?
Robert P. Balan @robert.p.balanLeaderAug 1, 2019 9:41 PM
Let me show you a chart Doc-
Robert P. Balan @robert.p.balanLeaderAug 1, 2019 9:57 PM
Sorry for long delay. I created it for Alan Longbon earlier, but I can't find it, so I have recreate.
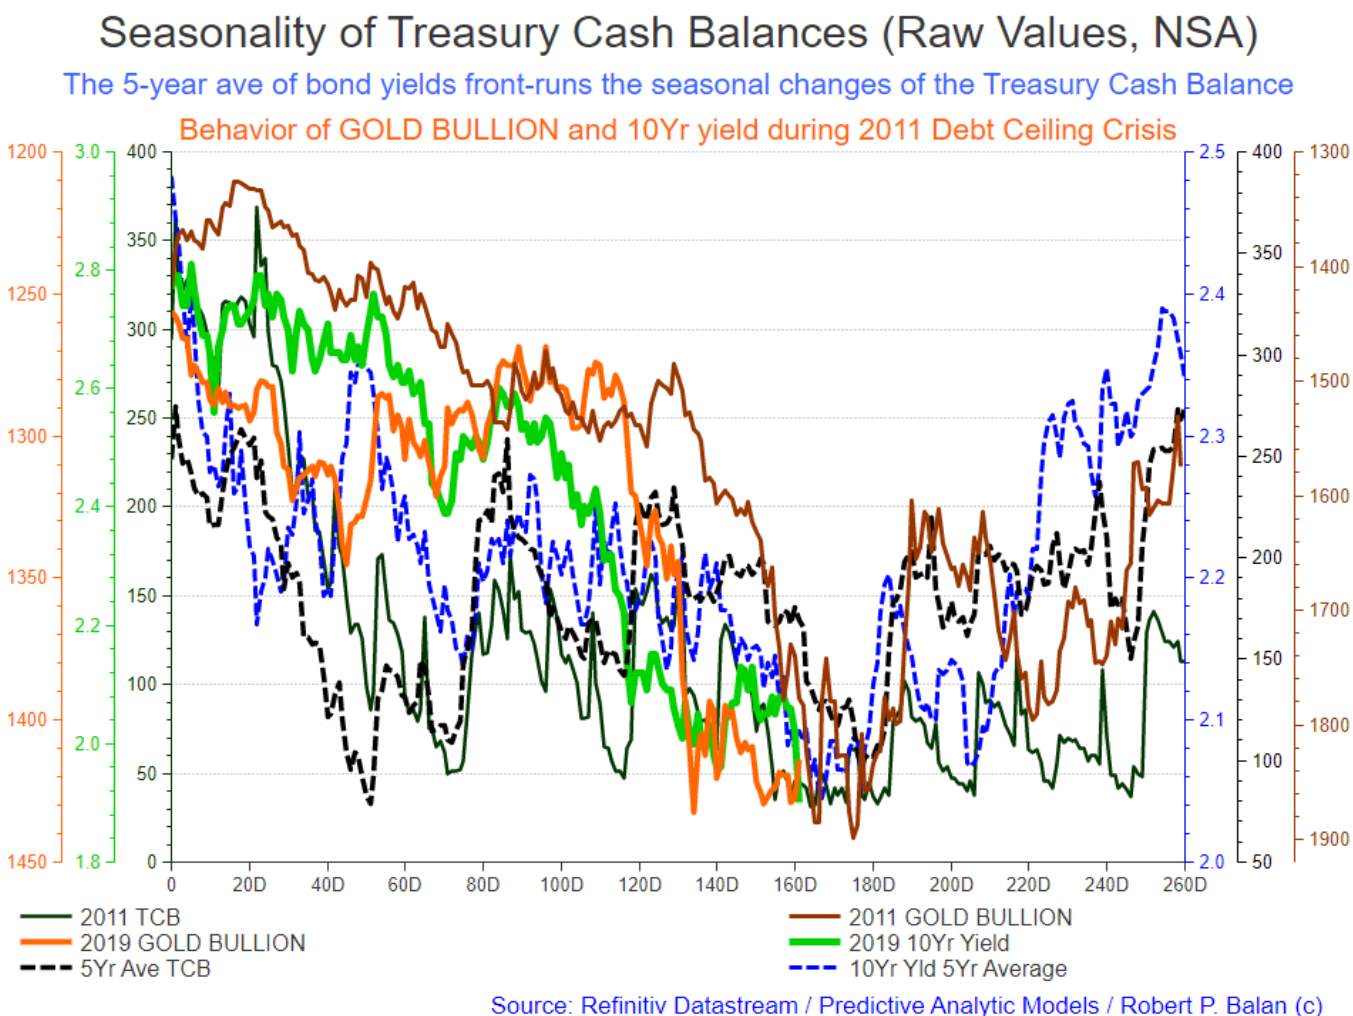
Anyway, yields will probably have two weeks more of decline, or at most four more weeks. In 2011, gold followed the 10 yr yield, and after the DCC, both rose sharply.
Alan and I expect the same behavior as well this time around.
More details here:
PAM will be sellers of gold and bonds during circa TD 180 (but we will validate this date further).
iDoc08 @iDoc08Aug 1, 2019 10:12 PM
Great, thanks Robert. i have that article bookmarked, really great work
FlyTight @flytightAug 1, 2019 11:48 PM
robert.p.balan Well what a day today! Oil and NG crash, and gold rises after a 6% plus decline in the TNX today. What more can we ask for in terms of excitement? Robert you told me last night that you anticipated yields to fall. You sure delivered deliver on that promise. And sure enough gold was about the only thing left above the water surface by the time the day was over. Good job Robert! Now tomorrow, we start again with Employment Day. Gold reacts to Employment Day just as it does to Fed Days, so look out! Care to make another prediction tonight Robert?
The Dow has dropped 600 points in two days and the NDX 125 points. Can we conclude this is the beginning of the major correction you have been expecting?
Robert P. Balan @robert.p.balanLeaderAug 1, 2019 11:56 PM
flytight We are not out of the woods yet.
FlyTight @flytightAug 1, 2019 11:58 PM
Ok, I'll behave....
Robert P. Balan @robert.p.balanLeaderAug 1, 2019 11:58 PM
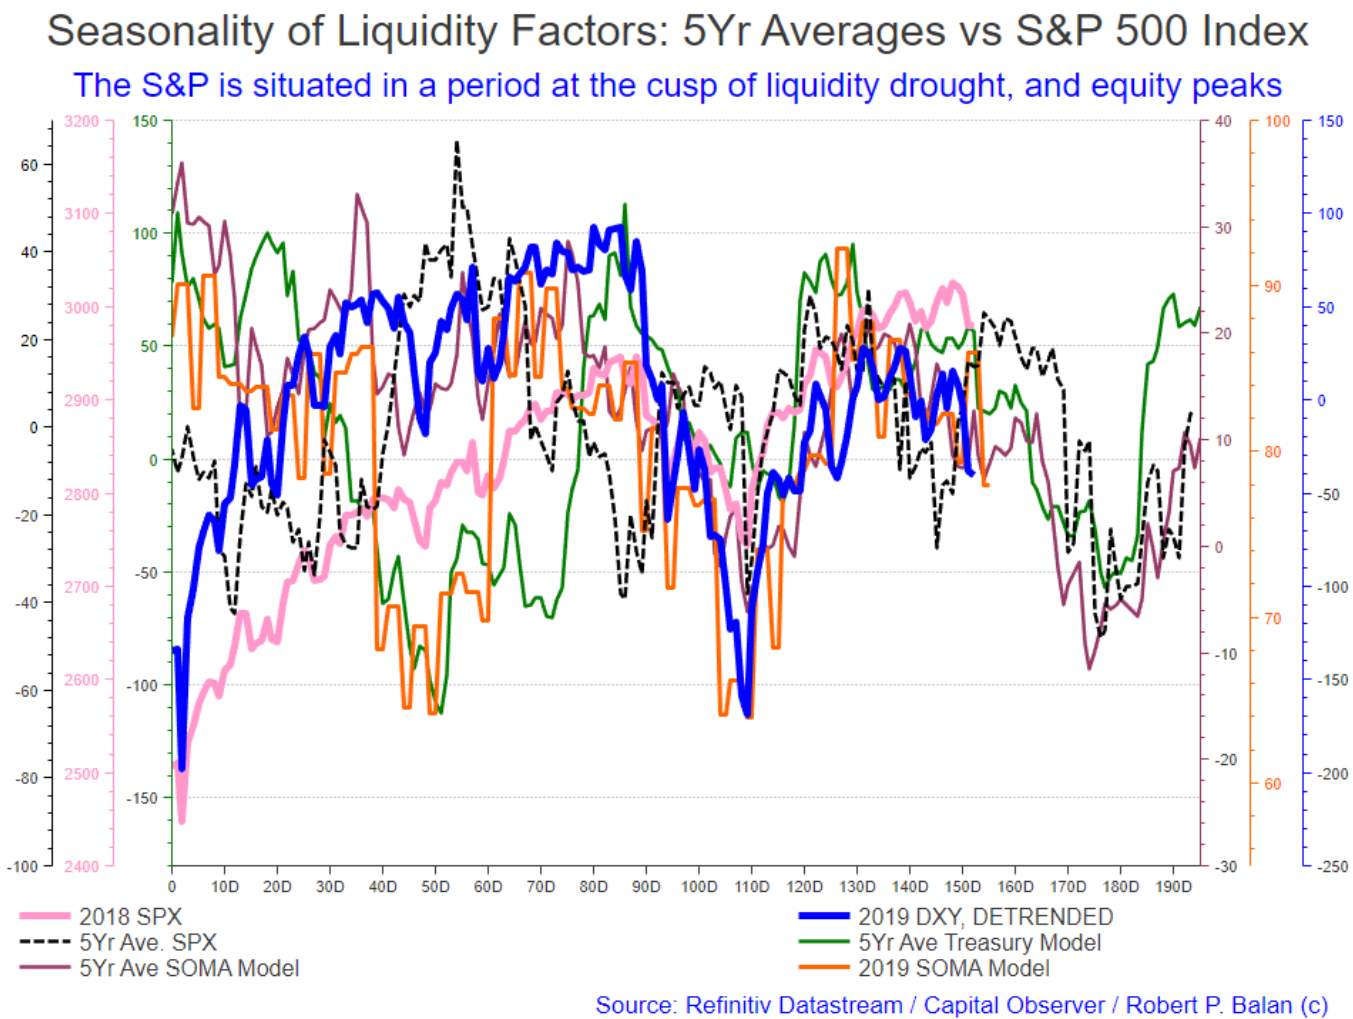
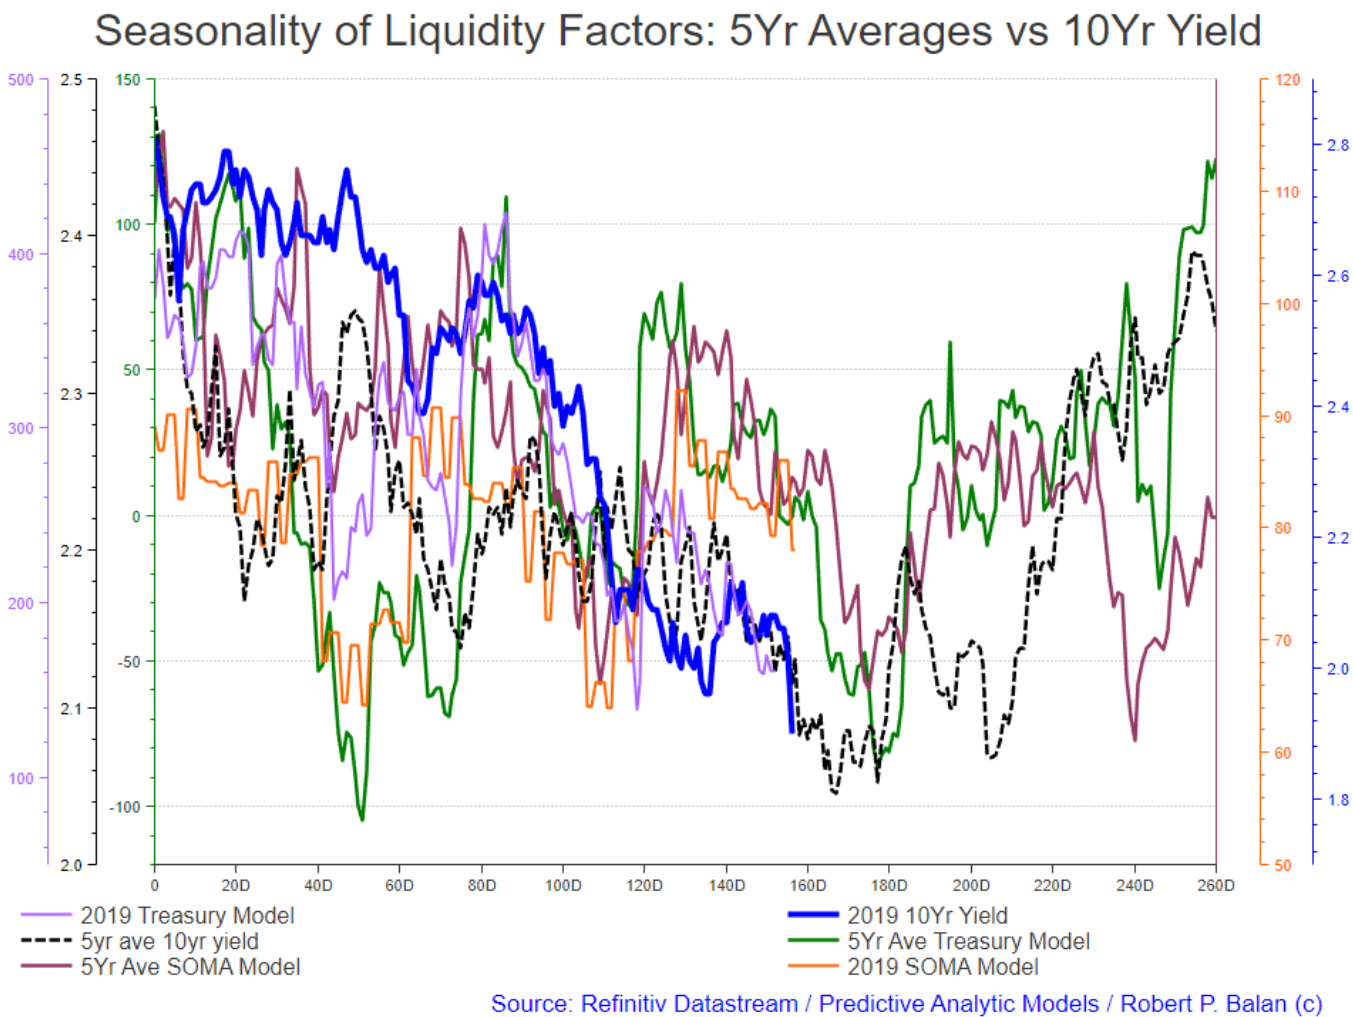
let me show you a couple of charts
Robert P. Balan @robert.p.balanLeaderAug 2, 2019 12:00 AM
Robert P. Balan @robert.p.balanLeaderAug 2, 2019 12:03 AM
Yields will likely bottom ahead of stocks. The next time, we should see yields rising for a while, and equities falling. But before Q3 is over, the Santa Rally will have stocks and yields rising together. Can hardly wait for that to happen.
FlyTight @flytightAug 2, 2019 12:11 AM
Ok I read you loud and clear (I think). I have these very same charts from a few days ago on my desk, so I am following along here. My focus remains on gold trading though. So your first chart indicates that the S&P is heading for a major fall here and by association the other three indices will follow. Have I got that right? The second chart calls for a trough in yields in about two weeks or so? And gold has been tied at the hip with yields for quite a while now (I have that chart too) So, can I conclude that gold's days are numbered and soon it will be time to short gold again? Am i reading that right Robert?
Robert P. Balan @robert.p.balanLeaderAug 2, 2019 12:15 AM
Robert P. Balan @robert.p.balanLeaderAug 2, 2019 12:16 AM
Scroll up a bit FT, and you will see the exchange between me and iDoc. The answer is yes
FlyTight @flytightAug 2, 2019 12:20 AM
Great! I must have missed that although I read the entire report for today. In any case, I can handle the day to day trading fairly well, but having high beam headlights just makes me much more relaxed, and my returns keep improving, so what more can I ask for? As always, my sincere thanks Robert and Tim. Let's see what the madmen bring us tomorrow..... Cheers!
Robert P. Balan @robert.p.balanLeaderAug 2, 2019 12:21 AM
Cheers Mate and Good Morning from Schweiz
MARKETS CLOSED
Predictive Analytic Models (PAM) provides REAL-TIME trading advice and strategies using guidance from US Treasury, Federal Reserve and term market money flows. PAM also provides LIVE modeled tools to subscribers in trading equities, bonds, currencies, gold and oil -- assets impacted by ebb and flow of systemic money. Sophisticated LIVE models to trade and invest in the oil sector are provided as well. PAM's veteran investors and seasoned traders can use PAM's proprietary tools 24X7 via PAM's SA service portal.
Try us for two-weeks, free. Please go here

Comments
Log in or sign up to join the conversation.