

The White House economic assumptions (based on February data) released today in the FY ’22 budget imply full employment output at year’s end, contrasting with 1.4% using the Survey of Professional Forecasters (from May)

Figure 1: GDP (black), FY’22 budget forecast (blue squares), Survey of Professional Forecasters May forecast (red), CBO estimate of potential GDP (gray line), all in Ch.2012$, SAAR. Source: BEA (2nd release), OMB (May 28), Philadelphia Fed, CBO (February), and author’s calculations.
The output gap (using CBO’s measure of potential) only hits 1.3% by end 2023 (instead of end-2021) using the administration’s estimates. The administration’s fairly restrained inflation forecast — 2.1% in 2021 and 2022 annual y/y — makes sense in that context.
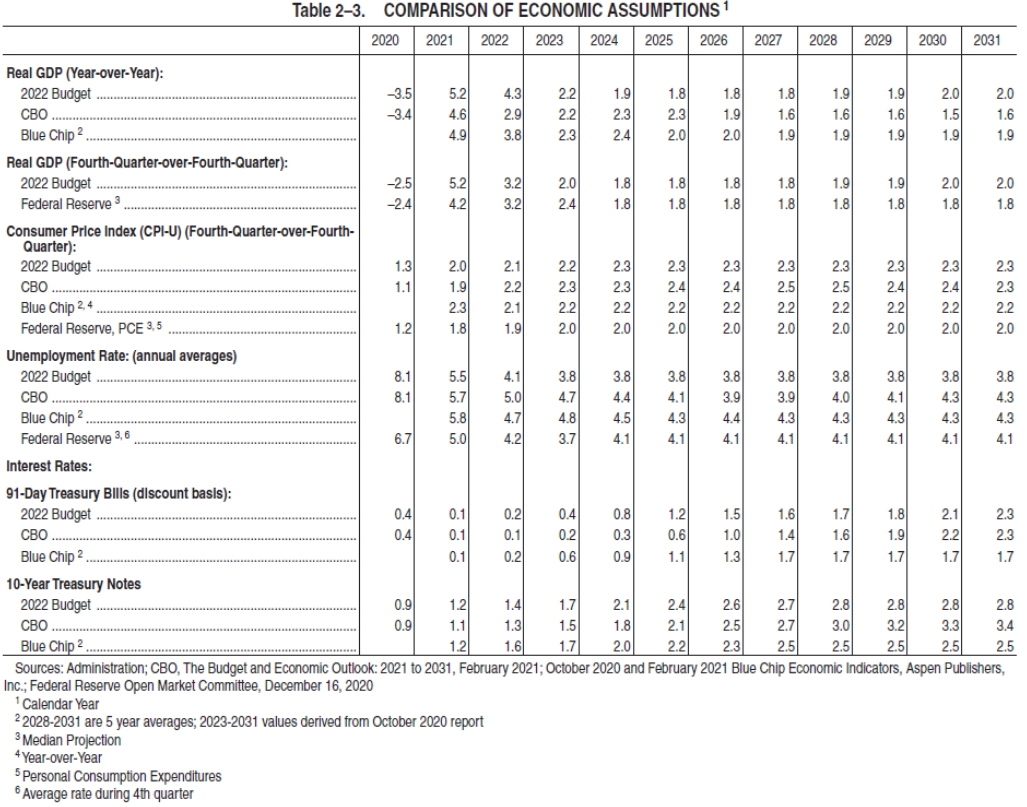
Critical in the sustainability of deficit spending is the evolution of interest rates. To some extent, the administration’s interest rate projections — based on data from February — have been overtaken by events. As shown in Analytical Perspectives Table 2-3 below, the February Administration, CBO, and Blue Chip forecasts for 2021 are comparable.
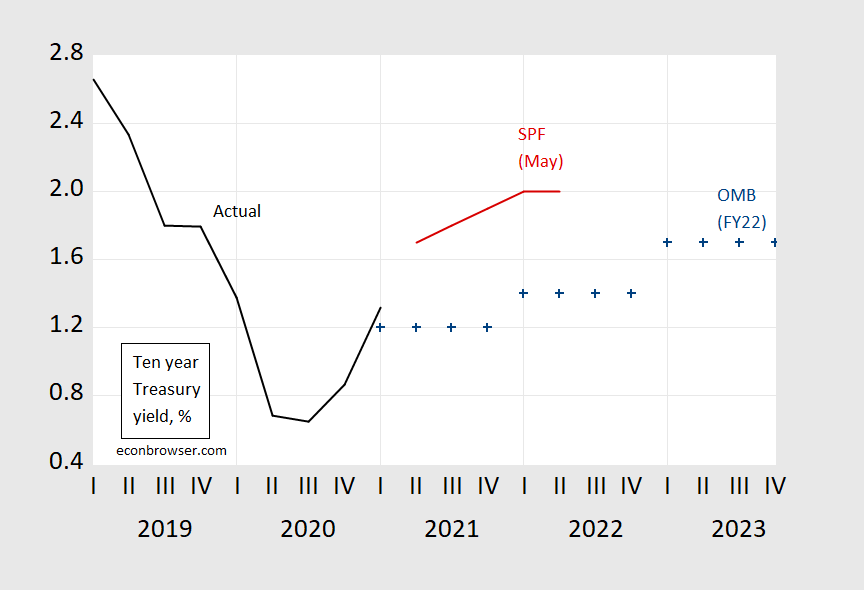
Figure 2: Ten year Treasury yields (black), FY’22 budget forecast (blue +), Survey of Professional Forecasters May forecast (red). Source: BEA (2nd release), OMB (May 28), and Philadelphia Fed.
The (May) Survey of Professional Forecasters projection is substantially higher than the White House forecast (based on February data); but as Torsten Slok (Apollo) has noted, such forecasts have typically proved to be overestimates.
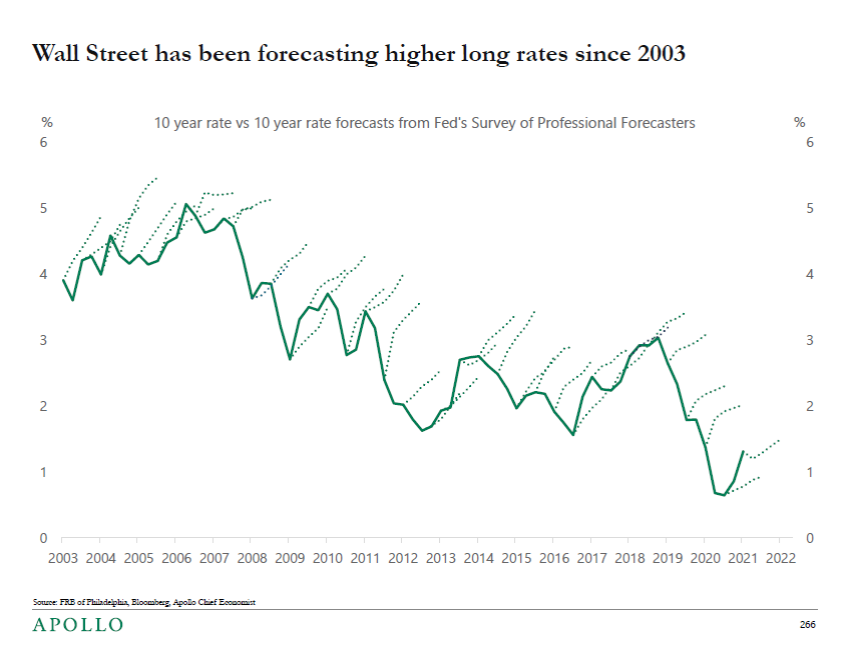
Source: Torsten Slok.
A similar characterization applies to Blue Chip, CBO forecasts of interest rates.
Forecast assumptions in Table S-9. Comparison with Fed, Blue Chip and CBO in Analytical Perspectives Table 2-3.




Comments
Log in or sign up to join the conversation.