

On May 20, 2020, Facebook (FB) broke out to a new all-time high. For almost a month after that milestone, FB churned as investors and traders blithely ignored the growing pressure of bad headlines and even worse news for the company. Social media companies have been squeezed in a no-win controversy over censorship, free speech, and alleged bias with Facebook doing a particularly bad job in navigating the tense political environment.
The complacency finally broke all at once on Friday, June 26th as fears exploded about an expanding advertiser boycott of Facebook ads. Companies which are contributing to causes of social justice are increasingly dismayed by the ads that appear adjacent to content opposed to their causes and culture. Facebook's stock lost 8.3% on heavy trading volume.
The weekend delivered a fresh onslaught of boycotters. On Monday, FB gapped down for a 2.8% loss. Next, like a light switch, buyers stepped in and hardly looked back for the rest of the day. FB closed with a 2.1% gain. Picture dust nervously settling around a blast zone.
(Click on image to enlarge)
Source: TradingView.com
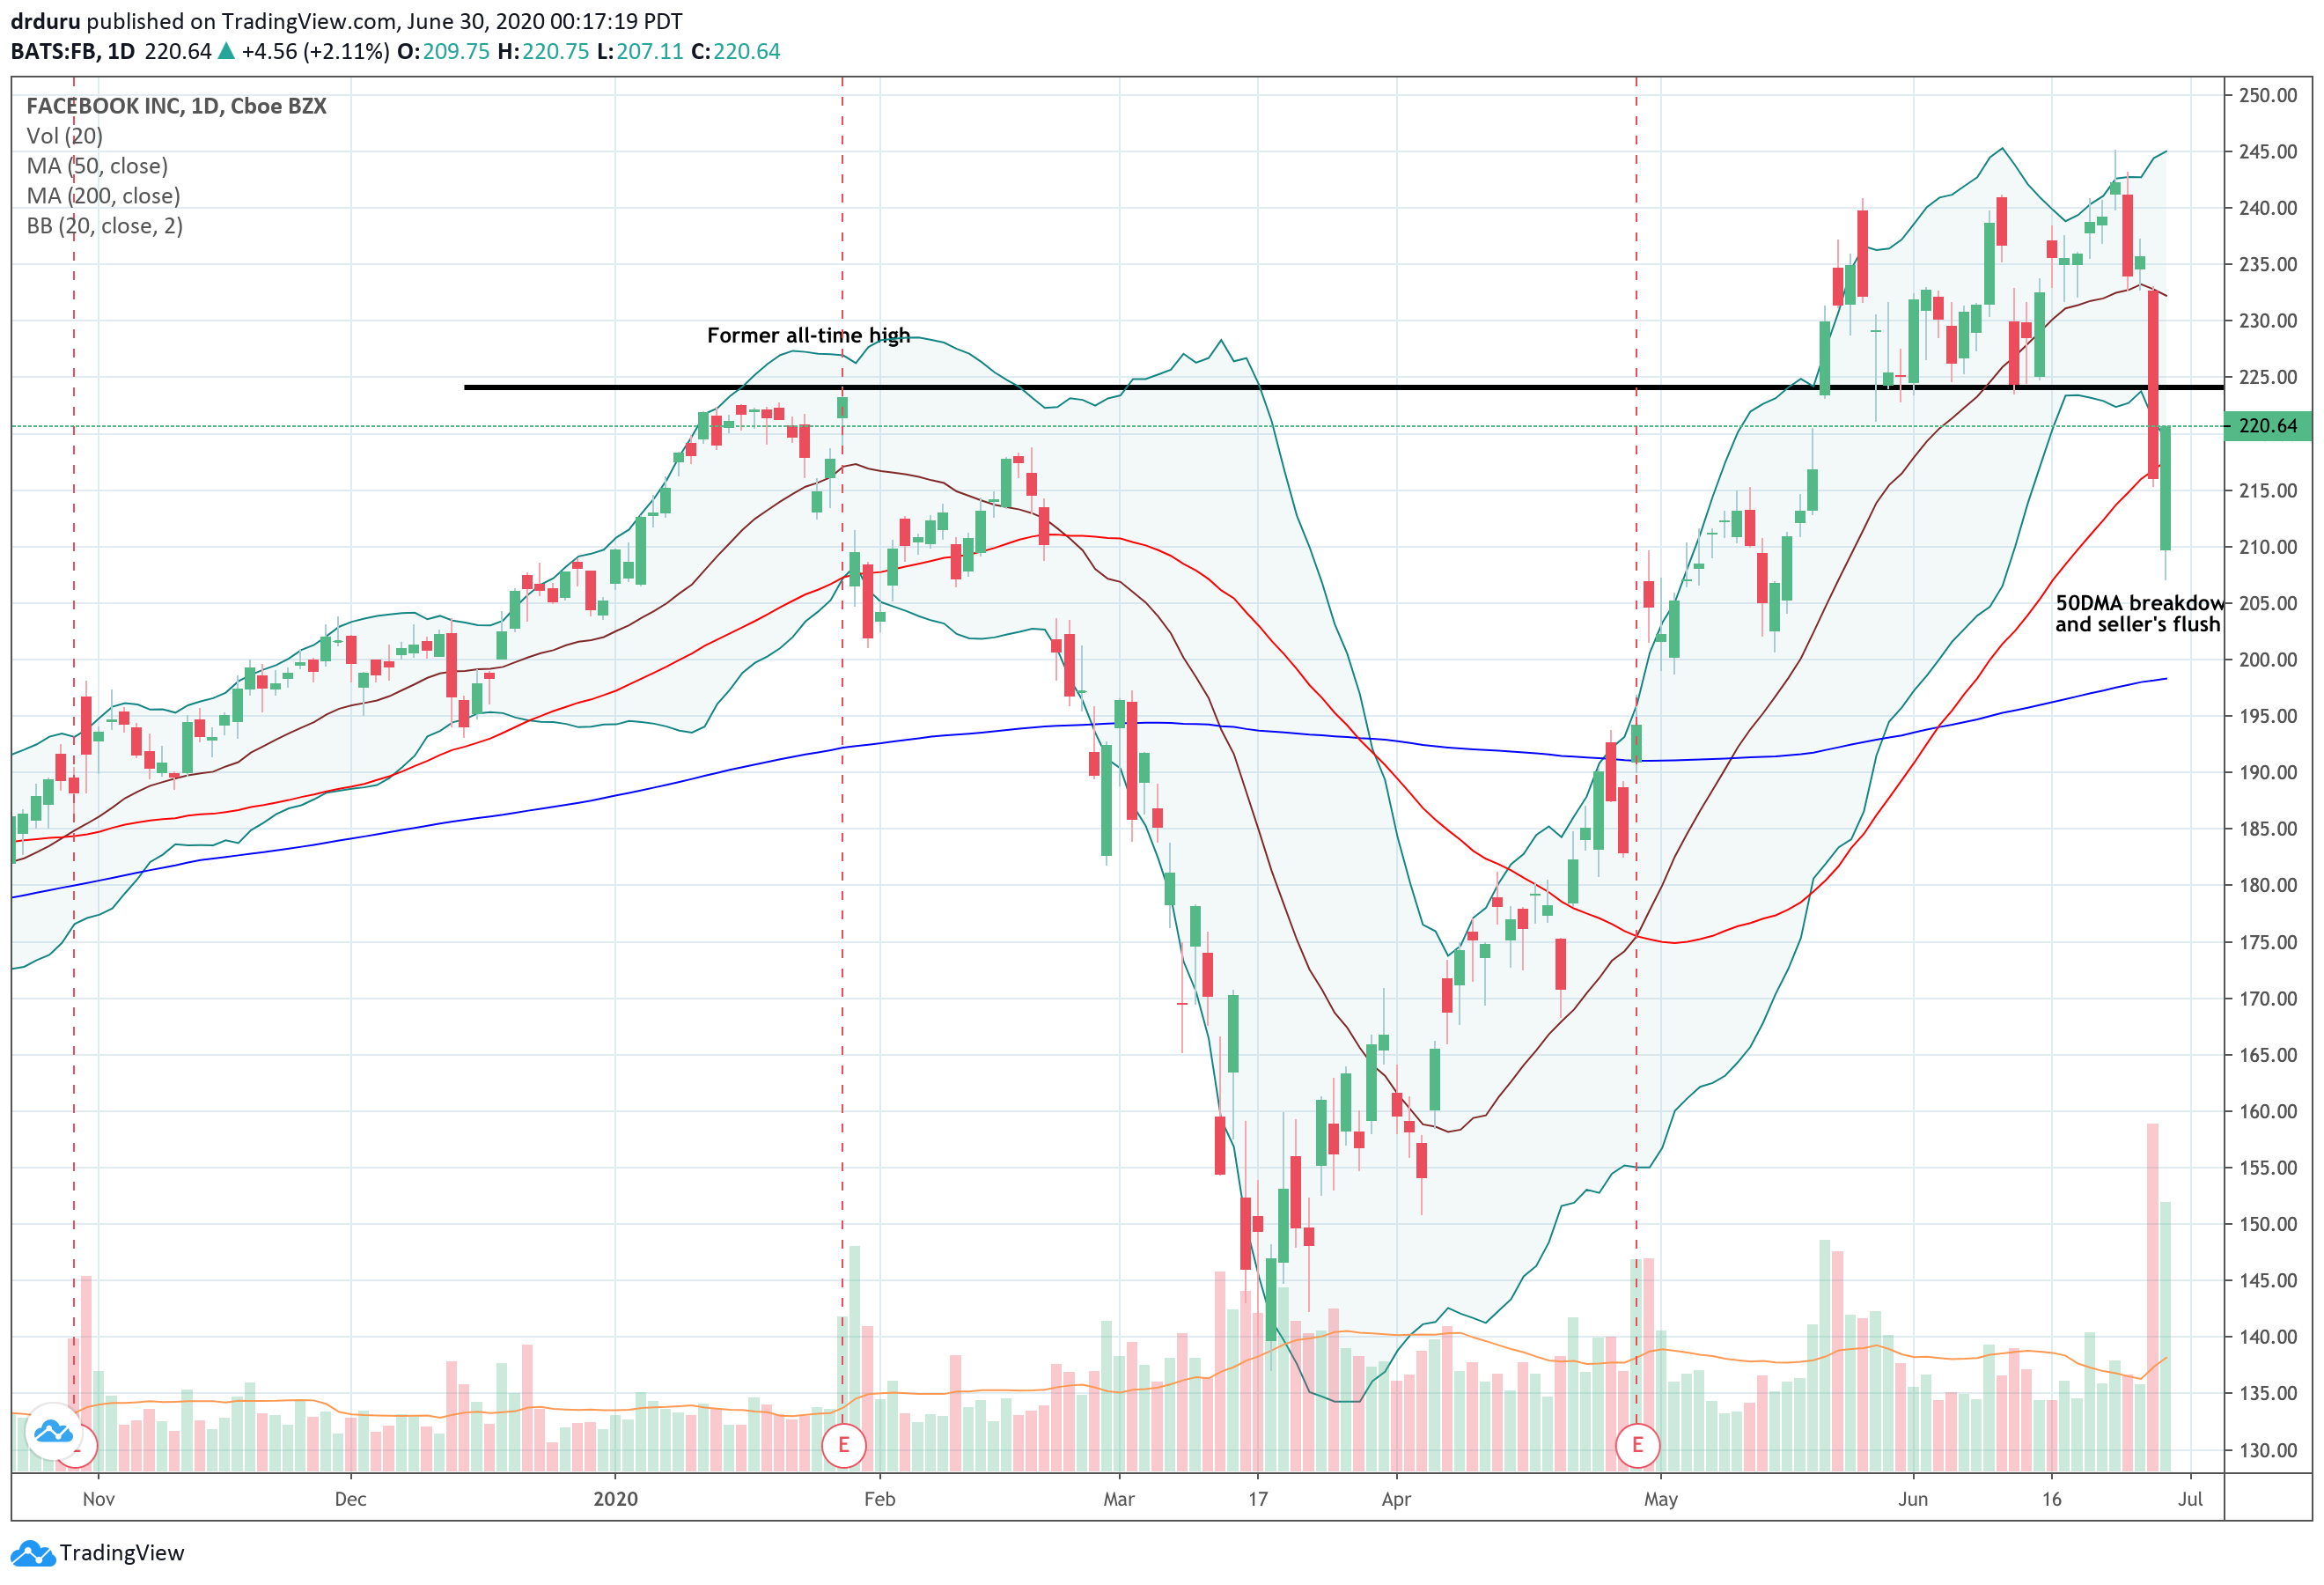
While the trading may look and feel like chaos, I see an orderly pattern that could form the basis of trades. Here are the steps I see:
- May 27 to June 15: multiple times buyers successfully defend support at the former all-time high
- June 26: breach of support from the previous all-time high accelerates selling, likely takes out stops, and generates trading volume larger than anything seen during the rolling stock market crashes in March. Part 1 complete for flushing out motivated sellers. FB finds its next level of (tentative) support at its 50-day moving average (DMA).
- June 29: A gap down likely takes out more stops and extends stock well below its lower Bollinger Band (BB). Part 2 of flushing motivated sellers over-stretches the rubber band. The snap back is so strong, FB manages to close above 50DMA support.
The high trading volume involved in these moves means that the extremes of the related pricing action carry extra significance. If FB manages to break down again, this time below Monday's intraday low of $207, the bears will be in firm control. The next hope of support will be the uptrending 200DMA which I doubt will be up to the task. Buyers face stiff resistance at the former all-time high as investors who failed to sell on the way down will get out with relief on the way back up. Only a full reversal of Friday's loss will put FB back in a firm bullish position. Such a move will signify that motivated buyers have taken control of the price action.
Aggressive traders and similarly minded speculators do not need to wait for these key levels to get challenged and broken before deciding on next moves. Options provide an interesting way to play the bounds of the extreme pricing action. Facebook will likely next report earnings on July 29th which gives a full month for the stock to make some decisive moves while traders can avoid paying up for post-earnings risk premiums.
To the downside, a weekly July 24th $210/200 put spread only costs around $2.30 at Monday's closing price. The 200DMA is slowly rising to provide support around the $200 level.
To the upside, I prefer a calendar call spread as I doubt FB will fully recover by the end of next week. The weekly July 10/July 24 $235 calendar call spread only costs around $3 at Monday's closing price. With the short side of the bet likely to expire worthless, a trader will get 2 weeks to see whether FB can complete the rest of its recovery and even return to all-time highs.
Traders can pick a side or even choose both as a hedged play. The choice depends on bear/bull biases and risk tolerances. I am targeting the hedged play to start.
Comments
Log in or sign up to join the conversation.