
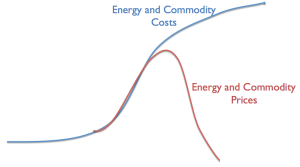
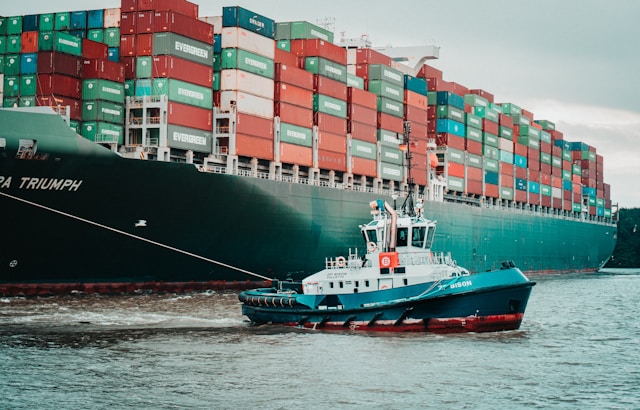
Why is the price of oil so low now? In fact, why are all commodity prices so low? I see the problem as being an affordability issue that has been hidden by a growing debt bubble. As this debt bubble has expanded, it has kept the sales prices of commodities up with the cost of extraction (Figure 1), even though wages have not been rising as fast as commodity prices since about the year 2000. Now many countries are cutting back on the rate of debt growth because debt/GDP ratios are becoming unreasonably high, and because the productivity of additional debt is falling.
If wages are stagnating, and debt is not growing very rapidly, the price of commodities tends to fall back to what is affordable by consumers. This is the problem we are experiencing now (Figure 1).
I will explain the situation more fully in the form of a presentation. It can be downloaded in PDF form: Oops! The world economy depends on an energy-related debt bubble. Let’s start with the first slide, after the title slide.
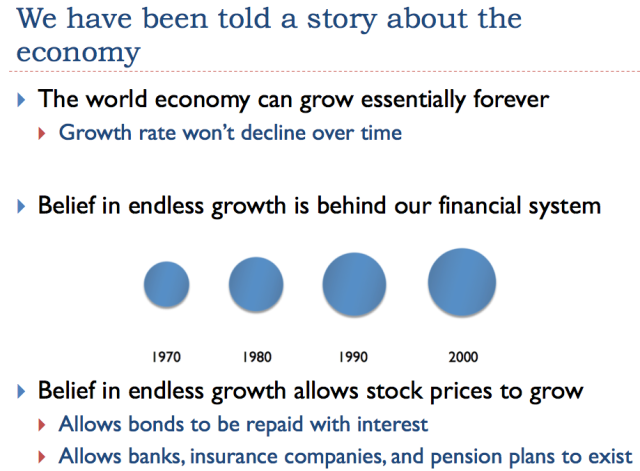
Growth is incredibly important to the economy (Slide 2). If the economy is growing, we keep needing to build more buildings, vehicles, and roads, leading to more jobs. Existing businesses find demand for their products rising. Because of this rising demand, profits of many businesses can be expected to rise over time, thanks to economies of scale.
Something that is not as obvious is that a growing economy enables much greater use of debt than would otherwise be the case. When an economy is growing, as illustrated by the ever-increasing sizes of circles, it is possible to “borrow from the future.” This act of borrowing gives consumers the ability to buy more things now than they would otherwise would be able to afford–more “demand” in the language of economists. Customers can thus afford cars and homes, and businesses can afford factories. Companies issuing stock can expect that price of shares will most likely rise in the future.
Without economic growth, it would be very hard to have the financial system that we have today, with its stable banks, insurance companies, and pension plans. The pattern of economic growth makes interest and dividend payments easier to make, and reduces the likelihood of debt default. It allows financial planners to set up savings plans for retirement, and gives people confidence that the system will “be there” when it is needed. Without economic growth, debt is more of a last resort–something that might land a person in debtors’ prison if things go wrong.
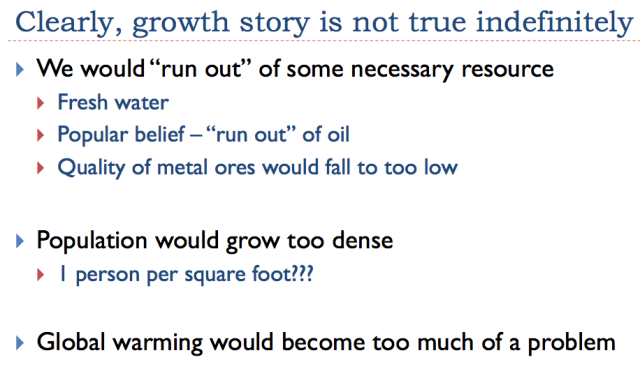
It should be obvious that the economic growth story cannot be true indefinitely. We would run short of resources, and population would grow too dense. Pollution, including CO2 pollution, would become an increasing problem.
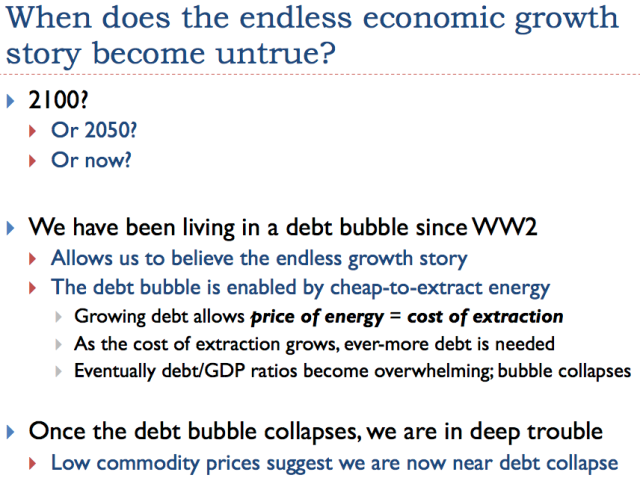
The question without an obvious answer is “When does the endless economic growth story become untrue?” If we listen to the television, the answer would seem to be somewhere in the distant future, if a slowdown in economic growth happens at all.
Most of us who read financial newspapers are aware that more debt and lower interest rates are the types of stimulus provided to the economy, to try to help it grow faster. Our current “run up” in debt seems to have started about the time of World War II. This growing debt allows “demand” for goods like houses, cars, and factories to be higher. Because of this higher demand, commodity prices can be higher than they otherwise would be.
Thus, if debt is growing quickly enough, it allows the sales price of energy products and other commodities to stay as high as their cost of extraction. The problem is that debt/GDP ratios can’t rise endlessly. Once debt/GDP ratios stop rising quickly enough, commodity prices are likely to fall. In fact, the run-up in debt is a bubble, which is itself in danger of collapsing, because of too many debt defaults.
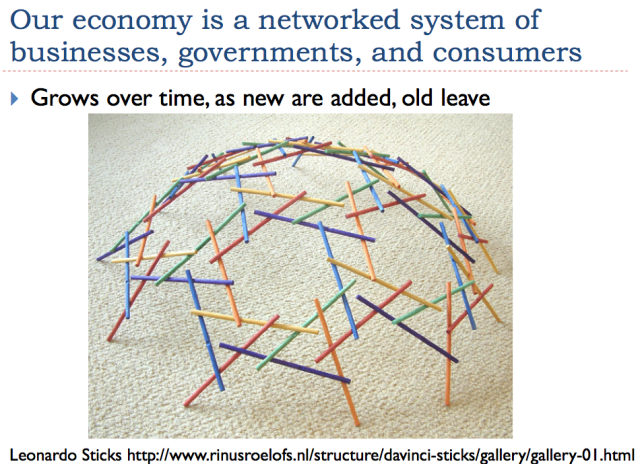
The economy is made up of many parts, including businesses and consumers. The consumers have a second role as well–many of them are workers, and thus get their wages from the system. Governments have many roles, including providing financial systems, building roads, and providing laws and regulations. The economy gradually grows and changes over time, as new businesses are added, and others leave, and as laws change. Consumers make their decisions based on available products in the marketplace and they amount they have to spend. Thus, the economy is a self-organized networked system–see my post Why Standard Economic Models Don’t Work–Our Economy is a Network.
One key feature of a self-organized networked system is that it tends to grow over time, as more energy becomes available. As its grows, it changes in ways that make it difficult to shrink back. For example, once cars became the predominant method of transportation, cities changed in ways that made it difficult to go back to using horses for transportation. There are now not enough horses available for this purpose, and there are no facilities for “parking” horses in cities when they are not needed. And, of course, we don’t have services in place for cleaning up the messes that horses leave.
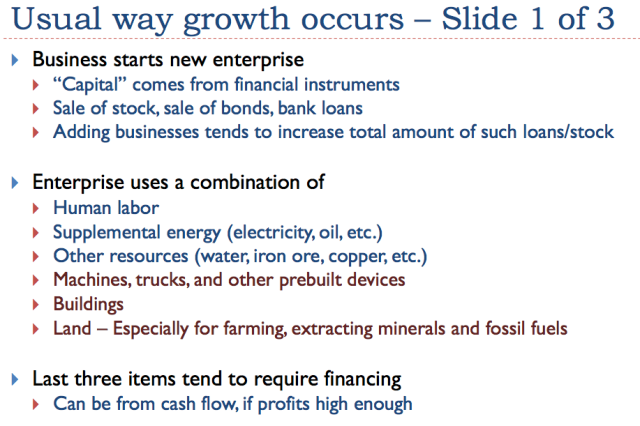
When businesses start, they need capital. Very often they sell shares of stock, and they may get loans from banks. As companies grow and expand, they typically need to buy more land, buildings and equipment. Very often loans are used for this purpose.
As the economy grows, the amount of loans outstanding and the number of shares of stock outstanding tends to grow.
Businesses compete by trying to make goods and services more efficiently than the competition. Human labor tends to be expensive. For example, a sweater knit by hand by someone earning $10 per hour will be very expensive; a sweater knit on a machine will be much less expensive. If a company can add machines to leverage human labor, the workers using those machines become more productive. Wages rise, to reflect the greater productivity of workers, using the machines.
We often think of the technology behind the machines as being important, but technology is only part of the story. Machines reflecting the latest in technology are made using energy products (such as coal, diesel and electricity) and operated using energy products. Without the availability of affordable energy products, ideas for inventions would remain just that–simply ideas.
The other thing that is needed to make technology widely available is some form of financing–debt or equity financing. So a three-way partnership is needed for economic growth: (1) ideas for inventions, (2) inexpensive energy products and other resources to make them happen, and (3) some sort of financing (debt/equity) for the undertaking.
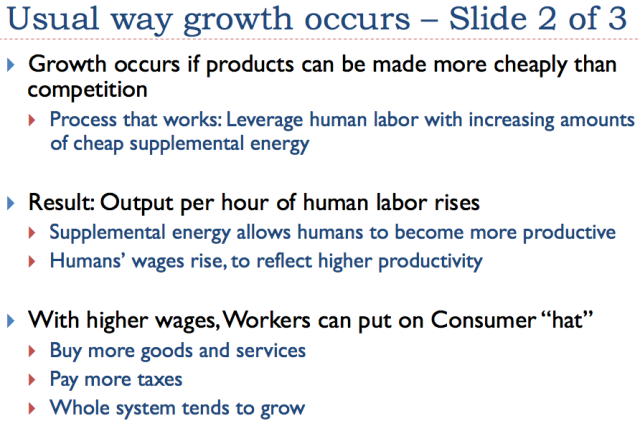
Workers play two roles in the economy; besides making products and services, they are also consumers. If their wages are rising fast enough, thanks to growing efficiency feeding back as higher wages, they can buy increasing amounts of goods and services. The whole system tends to grow. I think of this as the normal “growth pump” in the economy.
If the “worker” growth pump isn’t working well enough, it can be supplemented for a time by a “more debt” growth pump. This is why debt-based stimulus tends to work, at least for a while.
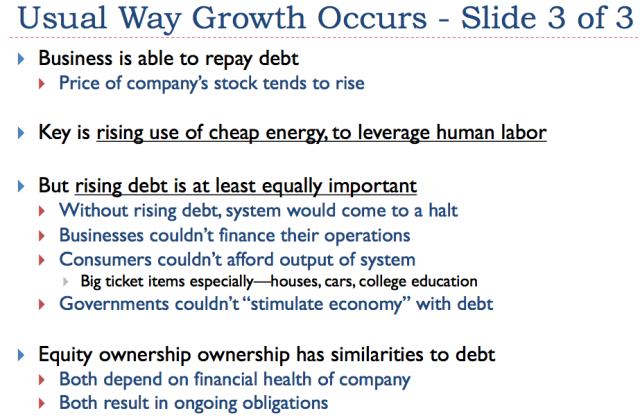
There are really two keys to economic growth–besides technology, which many people assume is primary. One key is the rising availability of cheap energy. When cheap energy is available, businesses find it affordable to add machines and equipment such as trucks to allow workers to be more productive, and thus start the economic growth cycle.
The other key is availability of debt, to finance the operation. Businesses use debt, in combination with equity financing, to add new plants and equipment. Customers find long-term debt helpful in financing big-ticket items such as homes and cars. Governments use debt for many purposes, including “stimulating the economy”–trying to get economic growth to speed up.

Slide 9 illustrates how workers play a key role in the economy. If businesses can create jobs with rising wages for workers, these workers can in turn use these rising wages to buy an increasing quantity of goods and services.
It is the ability of workers to afford goods like homes, cars, motorcycles, and boats that helps the economy to grow. It also helps to keep the price of commodities up, because making these goods uses commodities like iron, steel, copper, oil, and coal.
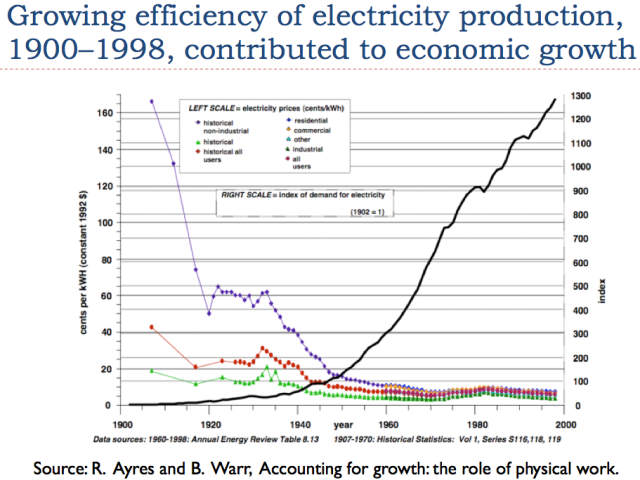
In the 1900 to 1998 period, the price of electricity production fell (shown by the falling purple, red, and green lines) as the production of electricity became more efficient. At the same time, the economy used an increasing quantity of electricity (shown by the rising black line). The reason that electricity use could grow was because electricity became more affordable. This allowed businesses to use more of it to leverage human labor. Consumers could use more electricity as well, so that they could finish tasks at home more quickly, such as washing clothes, leaving more time to work outside the home.

If we compare (1) the amount of energy consumed worldwide (all types added together) with (2) the world GDP in inflation-adjusted dollars, we find a very high correlation.
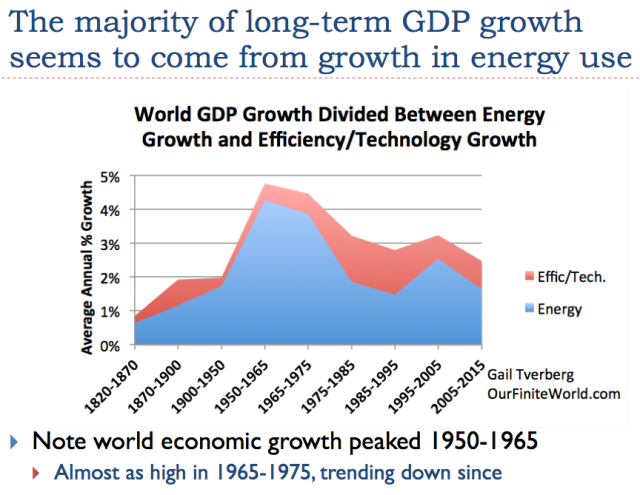
In Slide 12, GDP (represented by the top line on the chart–the sum of the red and the blue areas) was growing very slowly back in the 1820 to 1870 period, at less than 1% per year. This growth rate increased to a little under 2% a year in the 1870 to 1900 and 1900 to 1950 periods. The big spurt in growth of nearly 5% per year came in the 1950 to 1965 period. After that, the GDP growth rate has gradually slowed.
On Slide 12, the blue area represents the growth rate in energy products. We can calculate this, based on the amount of energy products used. Growth in energy usage (blue) tends to be close to the total GDP growth rate (sum of red and blue), suggesting that most economic growth comes from increased energy use. The red area, which corresponds to “efficiency/technology,” is calculated by subtraction. The period of time when the efficiency/technology portion was greatest was between 1975 and 1995. This was the period when we were making major changes in the automobile fleet to make cars more fuel efficient, and we were converting home heating to more fuel-efficient heating, not using oil.
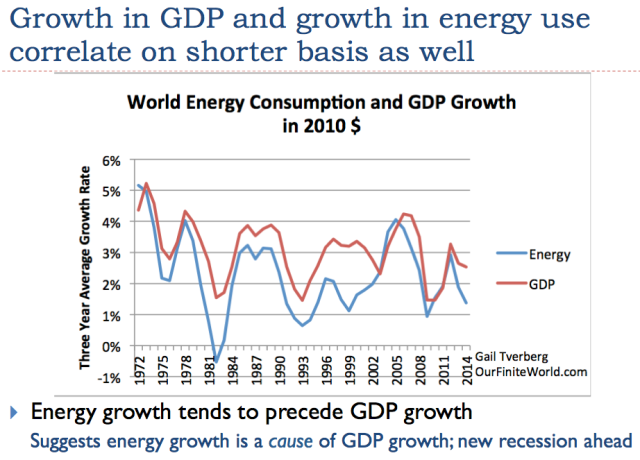
If we look at economic growth rates and the growth in energy use over shorter periods, we see a similar pattern. The growth in GDP is a little higher than the growth in energy consumption, similar to the pattern we saw on Slide 12.
If we look carefully at Slide 13, we see that changes in the growth rate for energy (blue line) tends to happen first and is followed by changes in the GDP growth rate (red line). This pattern of energy changes occurring first suggests that growth in the use of energy is acause of economic growth. It also suggests that lack of growth in the use of energy is a reason for world recessions. Recently, the rate of growth in the world’s consumption of energy has dropped (Slide 13), suggesting that the world economy is heading into a new recession.
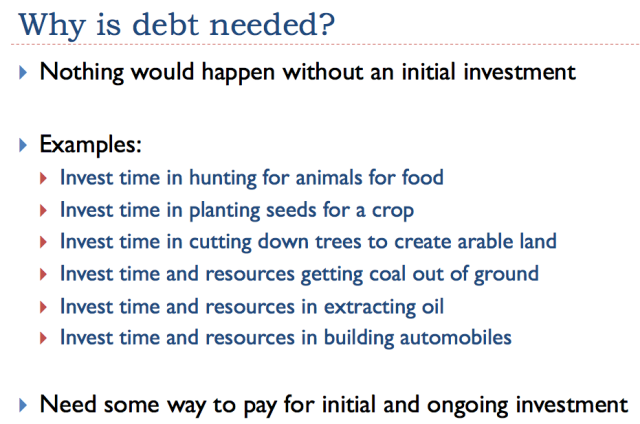
There is nearly always an investment of time and resources, in order to make something happen–anything from the growing of food to the mining of coal. Very often, it takes more than one person to undertake the initial steps; there needs to be a way to pay the other investors. Another issue is the guarantee of payment for resources gathered from a distance.
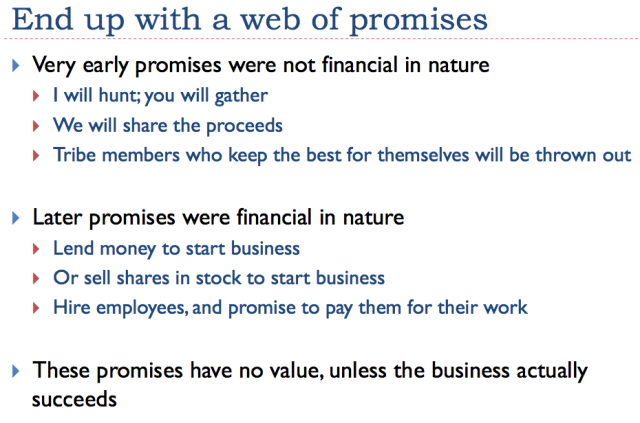
We rarely think about how all-pervasive promises are. Many customs of early tribes seem to reflect informal rules regarding the sharing of goods and services, and penalties if these rules are not followed.
Now, financial promises have to some extent replaced informal customs. The thing that we sometimes forget is that the bonds companies offer for sale, and the stock that companies issue, have no value unless the company issuing the stock or bonds is actually successful. As a result, the many promises that are made are, in a sense, contingent promises: the bond will be repaid, if the company is still in business (or if the company is dissolved, if the amount received from the sale of assets is great enough). The future value of a company’s stock also depends on the success of the company.

Governments become an important part of the web of promises. Governments collect their assessments through taxes. As an economy grows, the amount of government services tends to increase, and taxes tend to increase.
The roles of governments and businesses vary somewhat depending on the type of economy of a country. In a sense, this type of variation is not important. It is the functioning of the overall networked system that is important.

There was a very large run up in US debt about the time of World War II, not just in the US, but also in the other countries involved in World War II.
Adding the debt for World War II helped pull the US out of the lingering effects of the Depression. Many women started working outside the home for the first time. There was a ramp-up of production, aimed especially at the war effort.

What does a country do when a war is over? Send the soldiers back home again, without jobs, and the women who had been working to support the war effort back home again, also without jobs? This was a time period when non-government debt ramped up in the US. In fact, it seems to have ramped up elsewhere around the world as well. The new debt helped support many growing industries at the time–helping rebuild Europe, and helping build homes and cars for citizens in the US. As noted previously, both energy use and GDP soared during this time period.
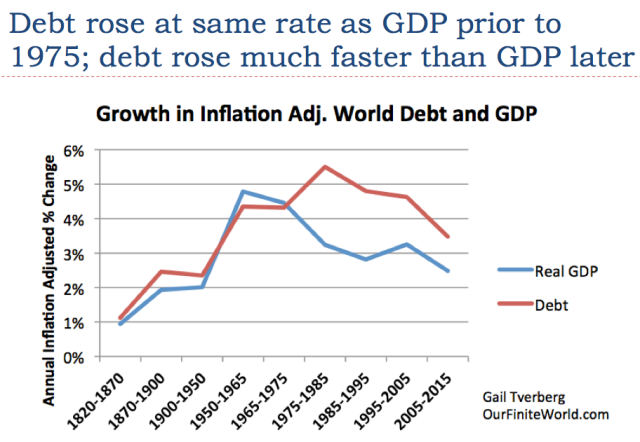
I haven’t found very good records of debt going back very far, but what I can piece together suggests that the rate of debt growth (total debt, including both government and private debt) was similar to the rate of growth of GDP, up until about 1975. Then, debt began growing much more rapidly than GDP.
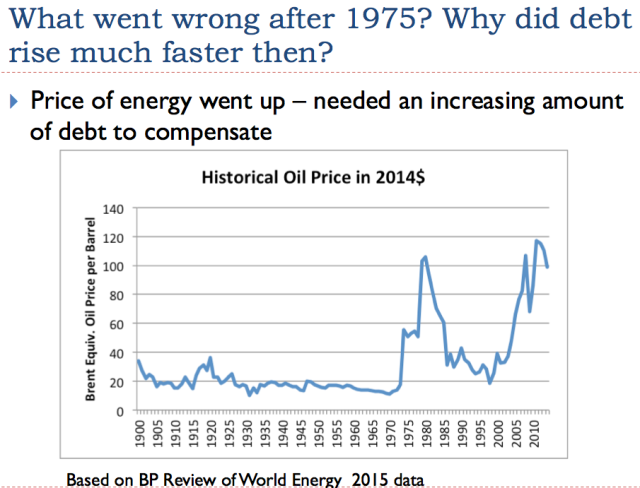
The big issue that led to a big increase in the need for debt in the early 1970s was an increase in the price of oil. Oil is the single largest source of source of energy. It is used in many important ways, including making food, transporting coal, and extracting metals. Thus, when the price of oil rises, so does the price of many other goods.
As we noted on Slides 11, 12, and 13, it is the growing quantity of energy consumption that is important in providing economic growth. The natural tendency with high energy prices is to cut back on energy-related consumption.Increasing debt, if it is at a sufficiently low interest rate, helps counteract this natural tendency toward less energy usage. For example, the availability of debt at a low interest makes it possible for more consumers to purchase big-ticket items like houses, cars, and motorcycles. These products indirectly lead to the growing consumption of energy products, because energy is used in making these big-ticket items and because they use energy in their continuing operation.
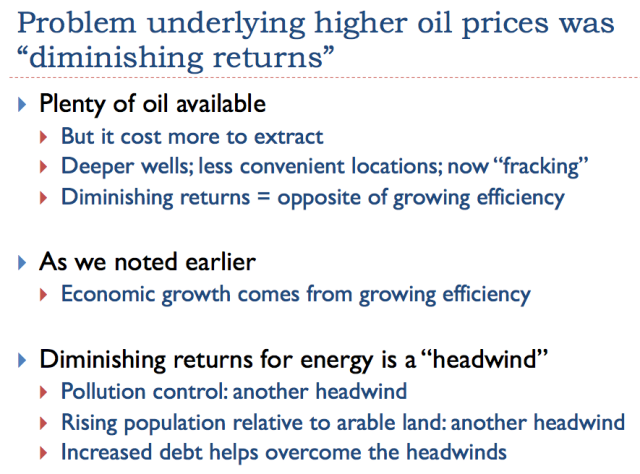
Many people have been concerned about what they call “peak oil”–the idea that oil supply would suddenly drop because we reach geological limits. I think that this is a backward analysis regarding how the system works. There is plenty of oil available, if only the price would rise high enough and stay high for long enough.

Comments
Log in or sign up to join the conversation.