

I'm not sure what you can do with this nor can I say there's a sound link to the inputs to the real economy and the valuation models professional investors use but here goes.
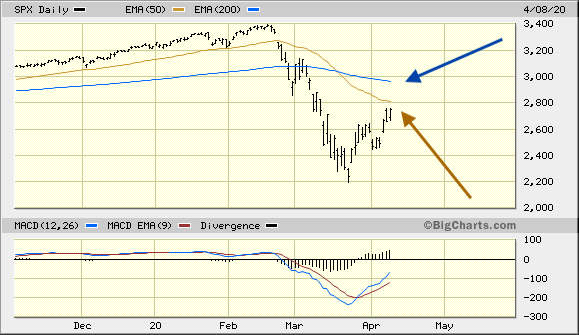
There's a Wall Street axiom that says at the start of a bear market the counter rallies that occur tend to retrace 1/2 to 2/3 of the initial decline. Assuming we are in a bear market and not a correction within a bull market (there is a substantial difference), the roughly 1200 point decline in the S&P 500 (from 3400 to 2200) would be temporarily met with roughly a 600 to 800 point rally. What is really intriguing about this in the current situation is this: a 1/2 retracement would bring the S&P 500 to its 50 day moving average (gold arrow) and a 2/3 rally brings it to its 200 day moving average (blue arrow). Today's early rally puts SPX right at its 50 day moving average. Next stop?
Wall Street abounds with hard to explain axioms. This has to be at the top of the list. Fibonacci, anyone?



Comments
Log in or sign up to join the conversation.