

OIL PRICE TALKING POINTS
Crude remains batter going into the end of May, with the price of oil slipping to a fresh monthly-low ($56.88) amid the ongoing trade dispute between the U.S. and China, the two largest consumers of oil.
OIL PRICES REMAIN BATTERED AS MONTHLY OPENING RANGE CRACKS
The current environment may keep oil prices under pressure as the International Monetary Fund (IMF)insists ‘consumers in the US and China are unequivocally the losers from trade tensions,’ but the Organization of the Petroleum Exporting Countries (OPEC) appears to be in no rush to boost production as the outlook for world demand remains unchanged.
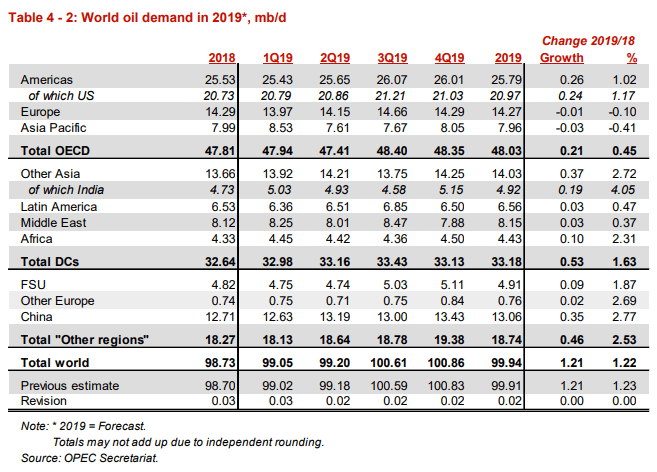
Keep in mind, OPEC’s most recent Monthly Oil Market Report (MOMR) notes that ‘for 2019, world oil demand growth is now forecast to increase by 1.21 mb/d, also unchanged from last month’s assessment, with total world consumption anticipated to reach 99.94 mb/d.’ The updates suggest OPEC and its allies will continue to regulate the energy market as the group pledges to keep ‘inventories under control,’ and the alliance may keep oil prices afloat in 2019 even though the U.S. and China struggle to reach a trade deal.
With that said, it remains to be seen if the OPEC and its allies will respond to the weakening outlook for global growth, but recent price action raises the risk for a larger correction as the price of oil fails to retain the opening range for May.
OIL DAILY CHART
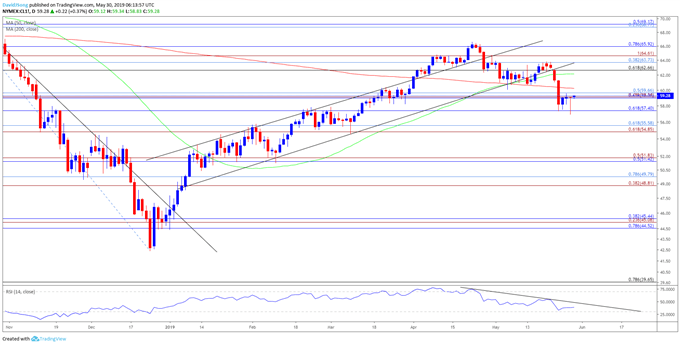
- Keep in mind, a ‘golden cross’ formation appears to have taken shape as the 50-Day SMA ($61.10) crosses above the 200-Day SMA ($60.39), but the difference in slope undermines the potential for a bullish signal.
- Downside targets remain on the radar as crude fails to preserve the upward trend from earlier this year, with lack of momentum to push back above the $59.00 (61.8% retracement) to $59.70 (50% retracement) raising the risk for a larger correction.
- In turn, a break/close below the $57.40 (61.8% retracement) opens up the Fibonacci overlap around 54.90 (61.8% expansion) to $55.60 (61.8% retracement), with the next area of interest coming in around $51.40 (50% retracement) to $51.80 (50% expansion).
- Will keep a close eye on the Relative Strength Index (RSI) despite the failed attempt to push into oversold territory as the oscillator extends the bearish formation carried over from the previous month.



Comments
Log in or sign up to join the conversation.