

(Click on image to enlarge)
Crude Daily
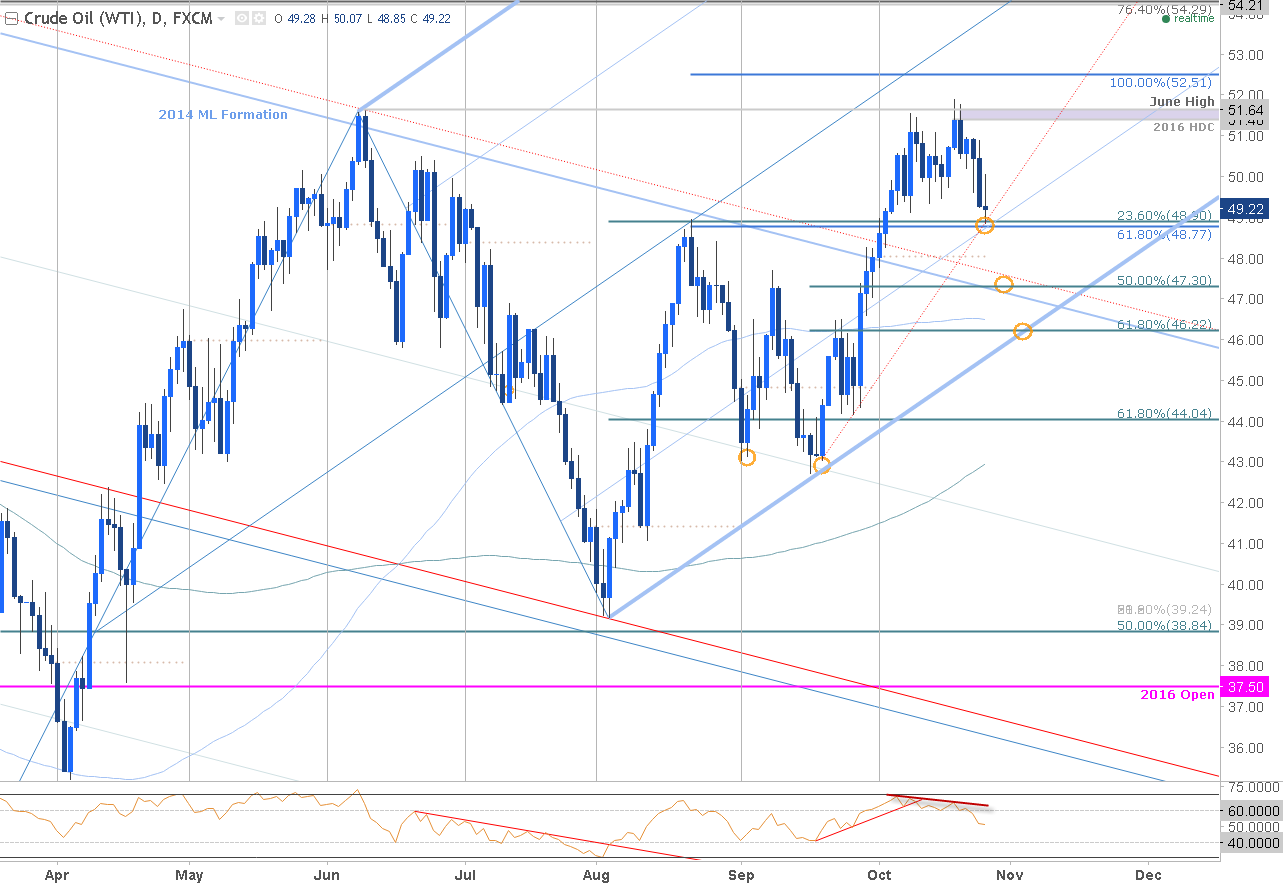
Chart Created Using TradingView
Technical Outlook: Crude prices reversed off the June highs last week on building bearish divergence with the subsequent pullback testing initial support at 48.78/90 in early U.S. trade. While this level may offer some near-term support, the broader focus remains lower while below this week’s high with a break lower targeting the monthly open at 48.04, 47.30 & key confluence support into 46.22/34.
Crude 120min
(Click on image to enlarge)
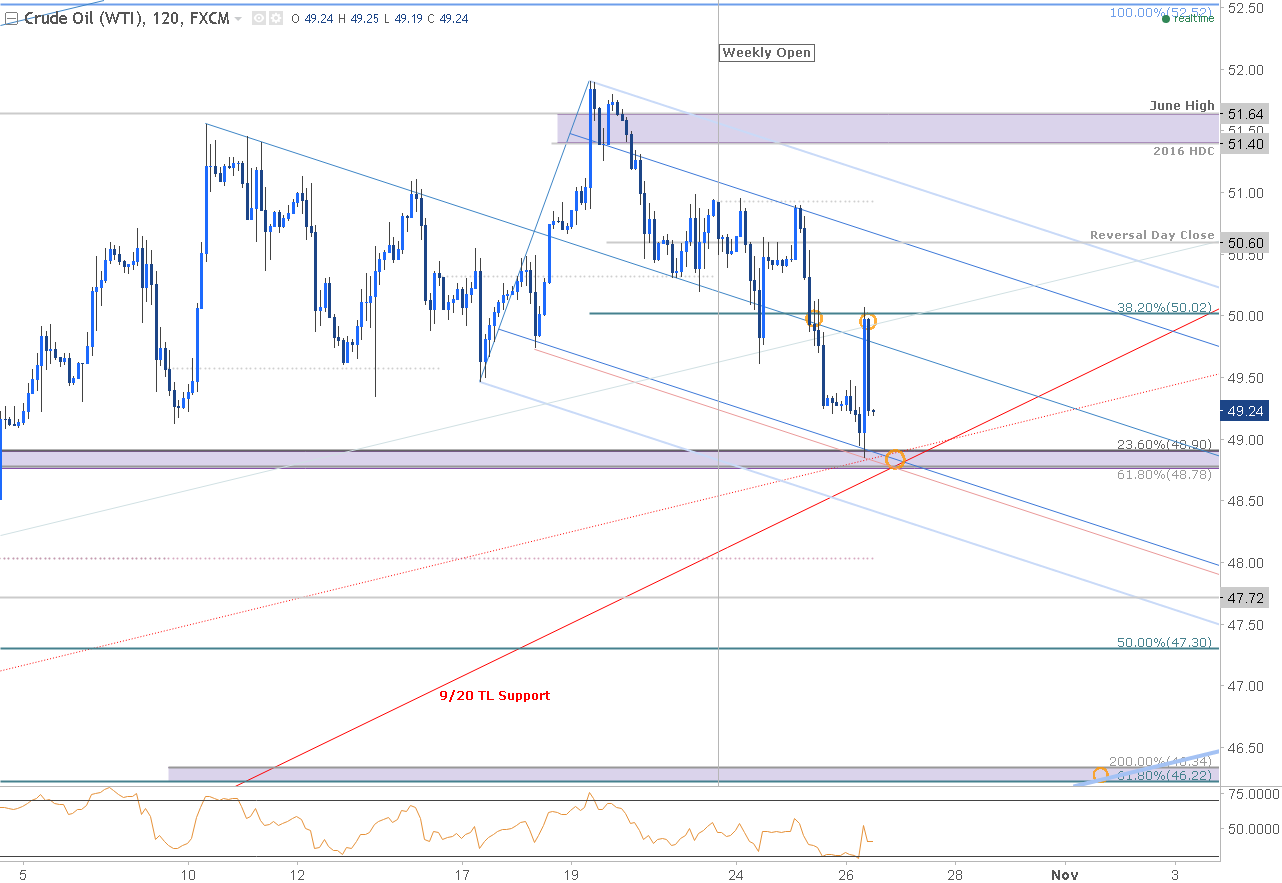
Notes: A closer look at near-term price action highlights this descending pitchfork formation extending off the monthly highs with a sliding parallel extending off the 10/18 low catching today’s low. We’ve been tracking this setup closely for the past several weeks on SB Trade Desk and our focus remains weighted to the downside while within this formation.
Interim resistance now stands at 50 backed by the reversal day close at 50.60 with our bearish invalidation level set to the weekly opening range high, which converges on the upper parallel at 50.96. From a trading standpoint, I would be looking to fade strength while sub-50.60 with a break of near-term confluence support eyeing subsequent targets into the lower parallel (46.22/34).
(Click on image to enlarge)
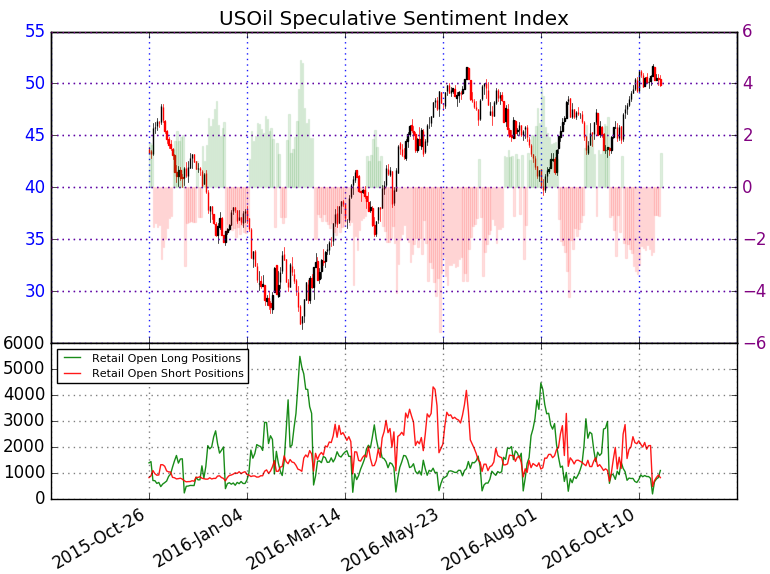
- A summary of the DailyFX Speculative Sentiment Index (SSI) shows traders are net long crude- the ratio stands at +1.34 (57% of traders are long)- weak bearish reading
- Long positions are 29.4% higher than yesterday and 36.3% above levels seen last week.
- Short positions are 6.5% lower than yesterday and 57.2% below levels seen last week.
- Open interest is 11.1% higher than yesterday but 29.9% below its monthly average.
- The recent dynamic suggests that the long bias is at risk here while below the June highs at 51.64. That said, the near-term focus remains lower and we’ll be watching for a build in long positioning to offer a warning that the pullback may be nearing completion.



Comments
Log in or sign up to join the conversation.