

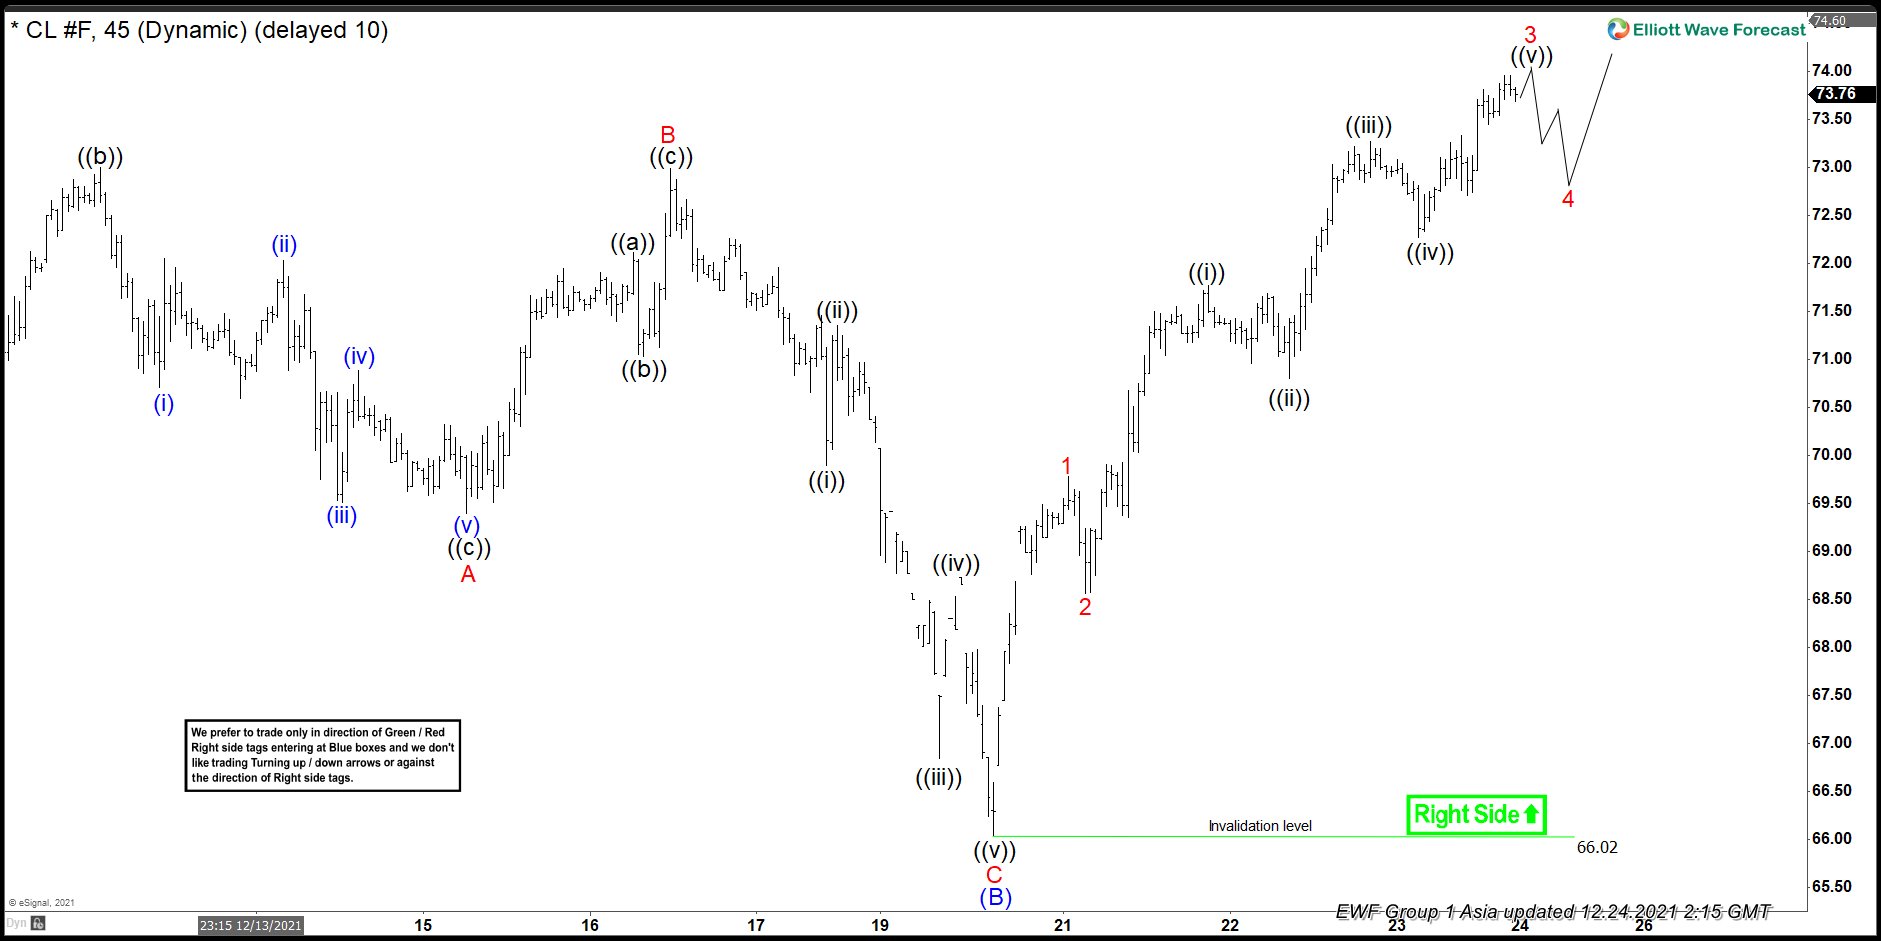
The Elliott Wave view in oil suggests that it is correcting the cycle from the Oct. 25, 2021 peak. It appears to be looking for more upside towards the $76.77- $83.57 area to form a wave ((B)) connector. From there, the instrument is expected to fall lower in a bigger ((C)) leg to complete the correction. The shorter cycle suggests that the decline in wave (B) unfolded as a flat structure, where the first leg ended in wave A at the $69.39 low.
Up from there, oil saw another 3 swings before it bounced & ended wave B at the $72.99 high. Down from there, it declined 5 waves lower where lesser degree wave ((i)) ended at $69.89. Wave ((ii)) ended at the $71.35 high, wave ((iii)) ended at $66.84, wave ((iv)) ended at $68.73, and wave ((v)) ended at $66.02, thus completing wave C of (B).
From there, we believe that (C) leg higher has started an impulse sequence where wave 1 ended at the $69.78 high and where wave 2 ended at the $68.56 low. For the near-term, as long as it remains above the $66.02 low, one can expect oil to extend higher for a few more pushes higher, targeting the $76.77- $83.57 area to complete the (C) leg higher.
Oil: One-Hour Elliott Wave Chart


Comments
Log in or sign up to join the conversation.