

The Advance Report on Manufacturers’ Shipments, Inventories, and Orders released today gives us a first look at the latest durable goods numbers. Here is the Bureau's summary on new orders:
New orders for manufactured durable goods in October increased $11.0 billion or 4.8 percent to $239.4 billion, the U.S. Census Bureau announced today. This increase, up four consecutive months, followed a 0.4 percent September increase. Excluding transportation, new orders increased 1.0 percent. Excluding defense, new orders increased 5.2 percent.
Transportation equipment, also up four consecutive months, led the increase, $9.5 billion or 12.0 percent to $88.2 billion.
The latest new orders number at 4.8% (4.81% to two decimal places) month-over-month (MoM) was substantially above the Investing.com consensus of 1.5%. The series is up 2.1% year-over-year (YoY).
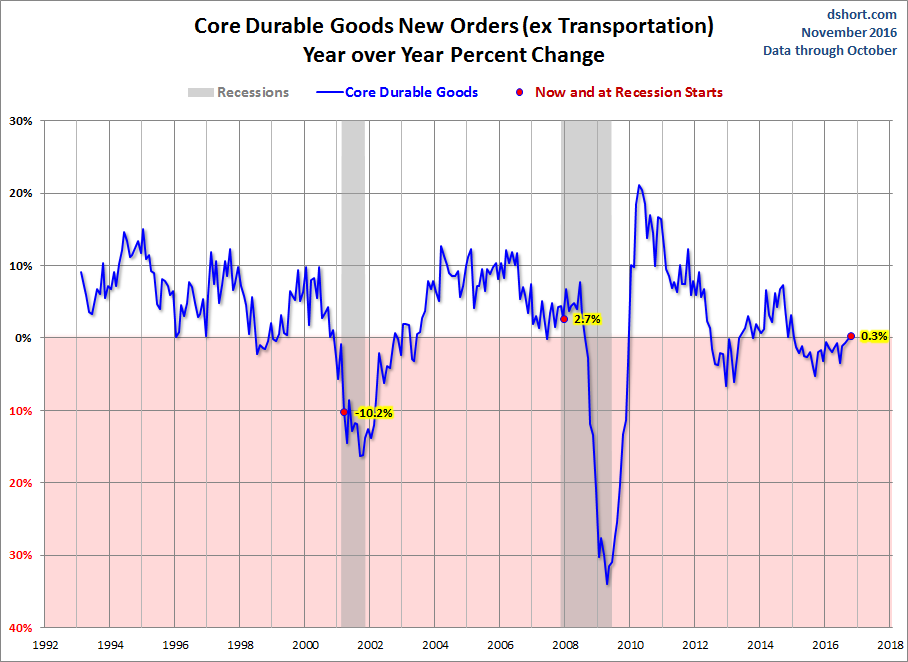
If we exclude transportation, "core" durable goods came in at 1.0% MoM, which beat the Investing.comconsensus of 0.2%. The core measure is only up to a fractional 0.3% YoY.
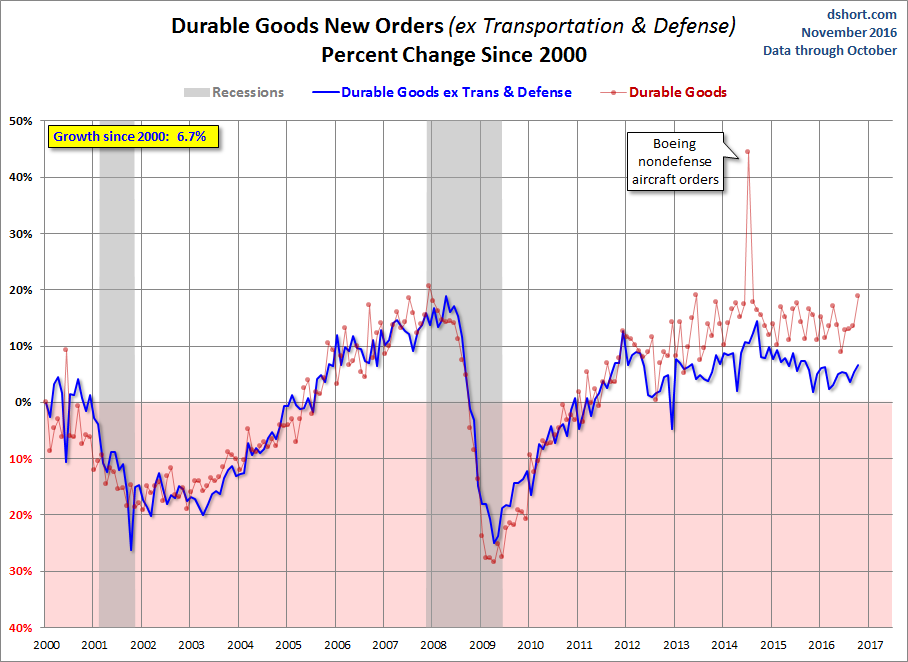
If we exclude both transportation and defense for an even more fundamental "core", the latest number is up 1.3% MoM but only up 1.0% YoY.
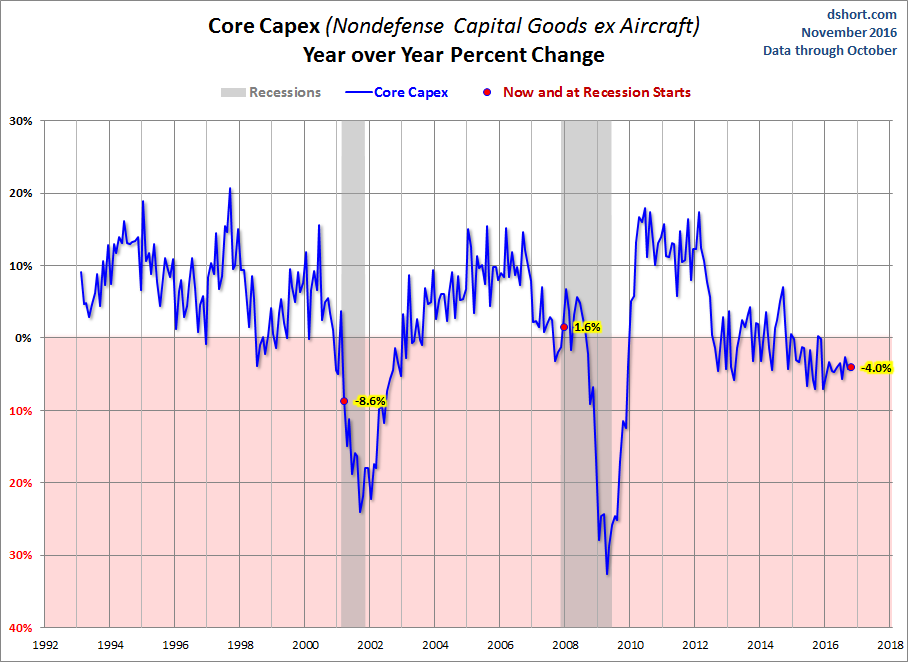
Core Capital Goods New Orders (nondefense capital goods used in the production of goods or services, excluding aircraft) is an important gauge of business spending, often referred to as Core Capex. It rose 0.4% MoM but is down 4.0% YoY.
For a look at the big picture and an understanding of the relative size of the major components, here is an area chart of Durable Goods New Orders minus Transportation and Defense with those two components stacked on top. We've also included a dotted line to show the relative size of Core Capex.
(Click on image to enlarge)

The next chart shows year-over-year percent change in Durable Goods. We've highlighted the value at recession starts and the latest value for this metric.
(Click on image to enlarge)

The next chart shows year-over-year percent change in Core Durable Goods (i.e., excluding transportation).
(Click on image to enlarge)
The next chart shows the growth in Core Durable Goods overlaid on the headline number since the turn of the century. This overlay helps us see the substantial volatility of the transportation component.
(Click on image to enlarge)

Here is a similar overlay, this time excluding Defense as well as Transportation (an even more "core" number).
(Click on image to enlarge)
Core Capital Goods
The next two charts take a step back in the durable goods process to show Manufacturers' New Orders for Nondefense Capital Goods Excluding Aircraft, a series often referred to as Core Capex. Here is the year-over-year Core Capex.
(Click on image to enlarge)
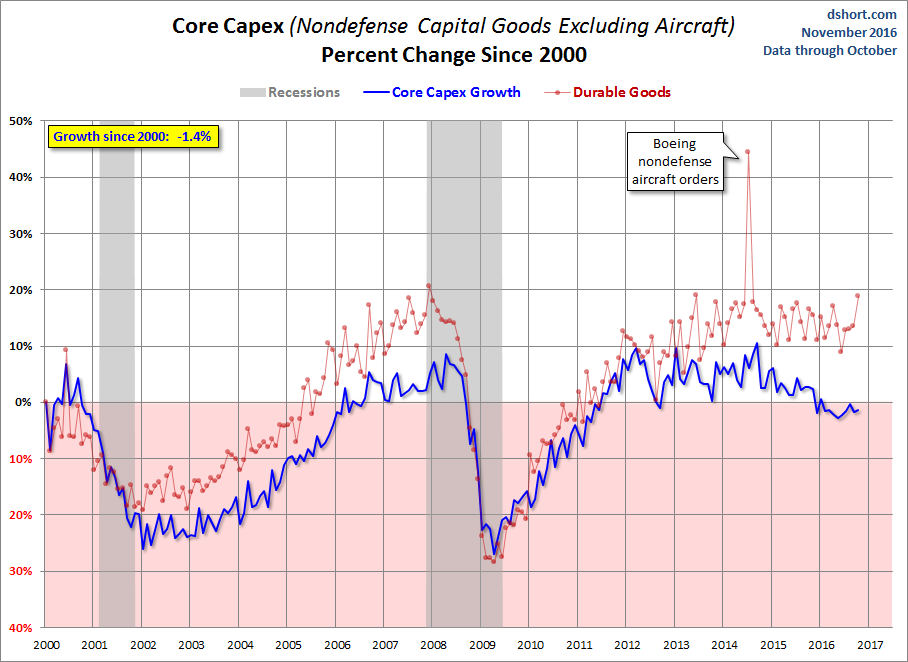
The next chart is an overlay of Core Capital Goods on the larger series showing the percent change of the two since the turn of the century.
(Click on image to enlarge)
In theory, the durable goods orders series should be one of the most important indicators of the economy's health. However, its volatility and susceptibility to major revisions suggest caution in taking the data for any particular month too seriously.



Comments
Log in or sign up to join the conversation.