


Kiwi is reversing quite aggressively to the downside, and as we discussed in April’s flashback analysis, the broader structure was already showing signs of exhaustion near key resistance. Price on the 4-hour time frame has now broken the trend line support connected from the April lows, confirming that the three-wave recovery structure appears to be completed.
The move likely finished wave D precisely at our first resistance near the 0.5960 level, which aligned with the expectations outlined in our April update.
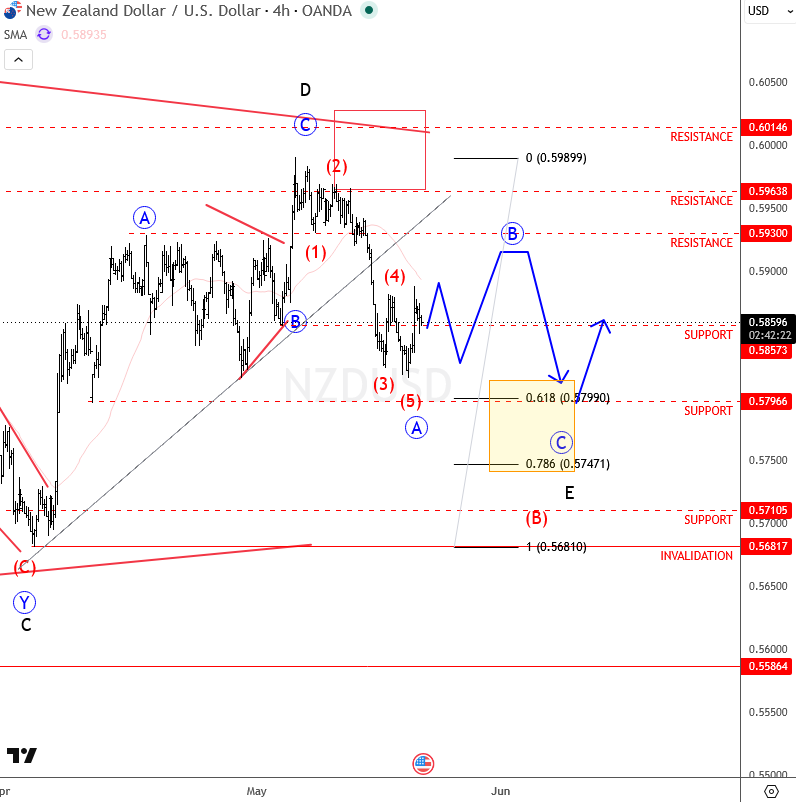
The reversal lower that we are tracking now looks like a developing wave E decline, but wave E should unfold in a minimum of three waves. Because of that, it’s very possible that this weakness continues much lower toward the 61.8% or even the 78.6% Fibonacci retracement levels, located around the 0.5750 – 0.5800 area.
Those remain the next major support zones to watch for a potential rebound, but only after a full three-wave decline completes from the recent swing highs.
For now, it still appears that we are only in the first leg of the current selloff, meaning further weakness is likely after any temporary B-wave recovery rallies.



Comments
Log in or sign up to join the conversation.