


The Kiwi (NZDUSD) remains within a larger sideways triangle range that still looks like a bullish ABCDE triangle pattern within wave (B) before we see a larger wave (C) recovery, as we discussed previously.
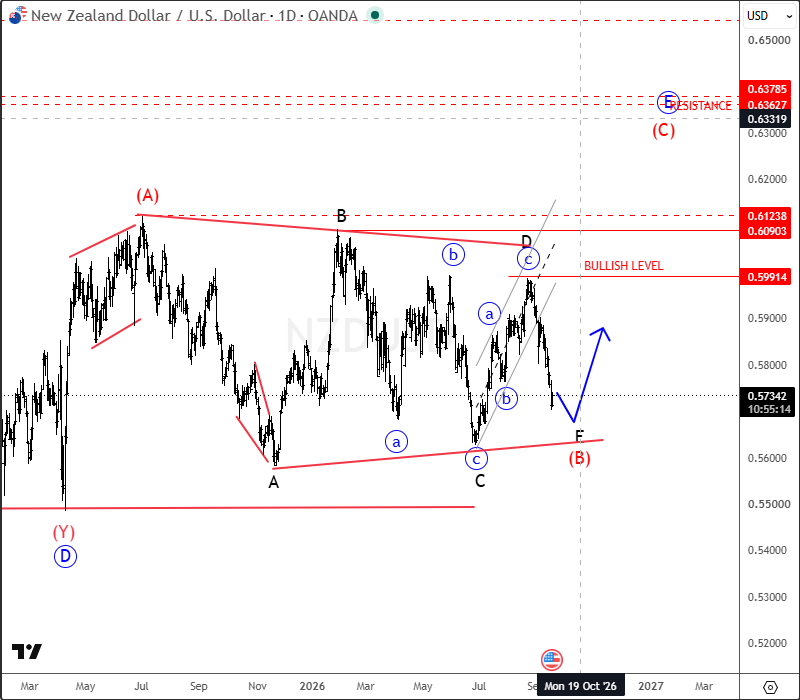
NZDUSD has turned aggressively to the downside over the last couple of weeks after coming very close to the 0.6000 resistance area that we discussed before. That was a wave D high, and it looks like we are now already trading deeper into wave E, which could be slowly approaching some attractive support levels near the lower side of the large triangle shown on our daily chart.
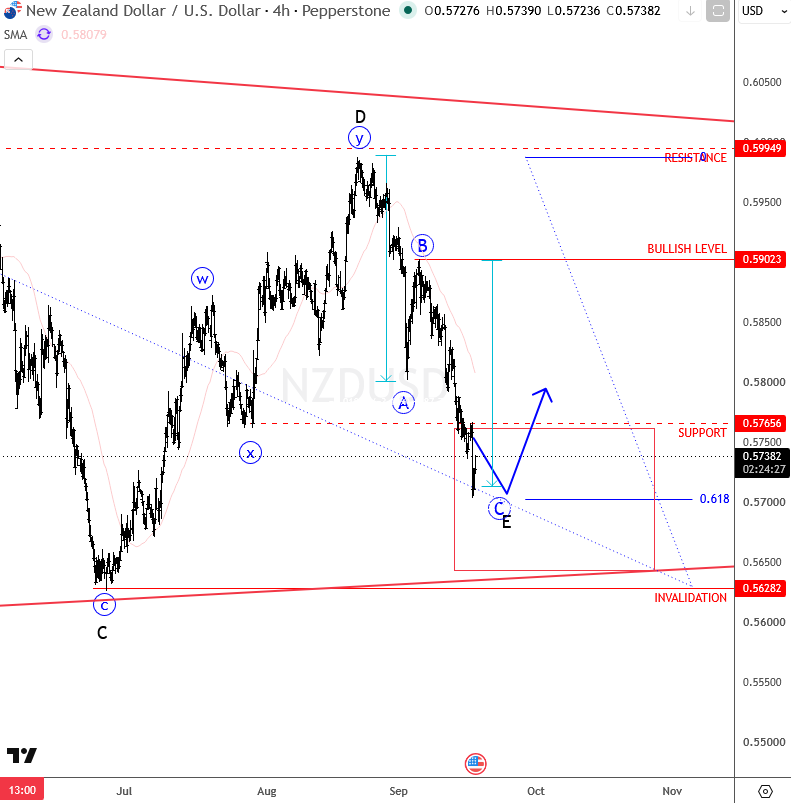
On the 4-hour chart, key support for wave C of an ABC decline within wave E comes in around the 0.5650–0.5700 area, where we may see some stabilization. However, we would need to see an impulsive recovery back toward 0.5900 to confirm that the pair is really bottoming and that the current weakness is completing near the lower side of the triangle range.


Comments
Log in or sign up to join the conversation.