


NZDCAD appears to be forming a head and shoulders reversal pattern on the daily time frame, with the left shoulder near 0.8180, the head at the July-August peak around 0.8280, and the right shoulder now taking shape closer to 0.8210.
The neckline connecting the swing lows sits around the 0.8130-0.8140 area, currently being tested as price pulls back from the right shoulder high.
A confirmed break below this neckline could validate the reversal pattern and set off a measured move selloff of the same height as the formation, potentially dragging price down toward the 0.8030-0.8040 region or lower.
If the neckline holds as support instead, NZDCAD could see a bounce back toward the right shoulder highs or the 0.8210-0.8220 area.
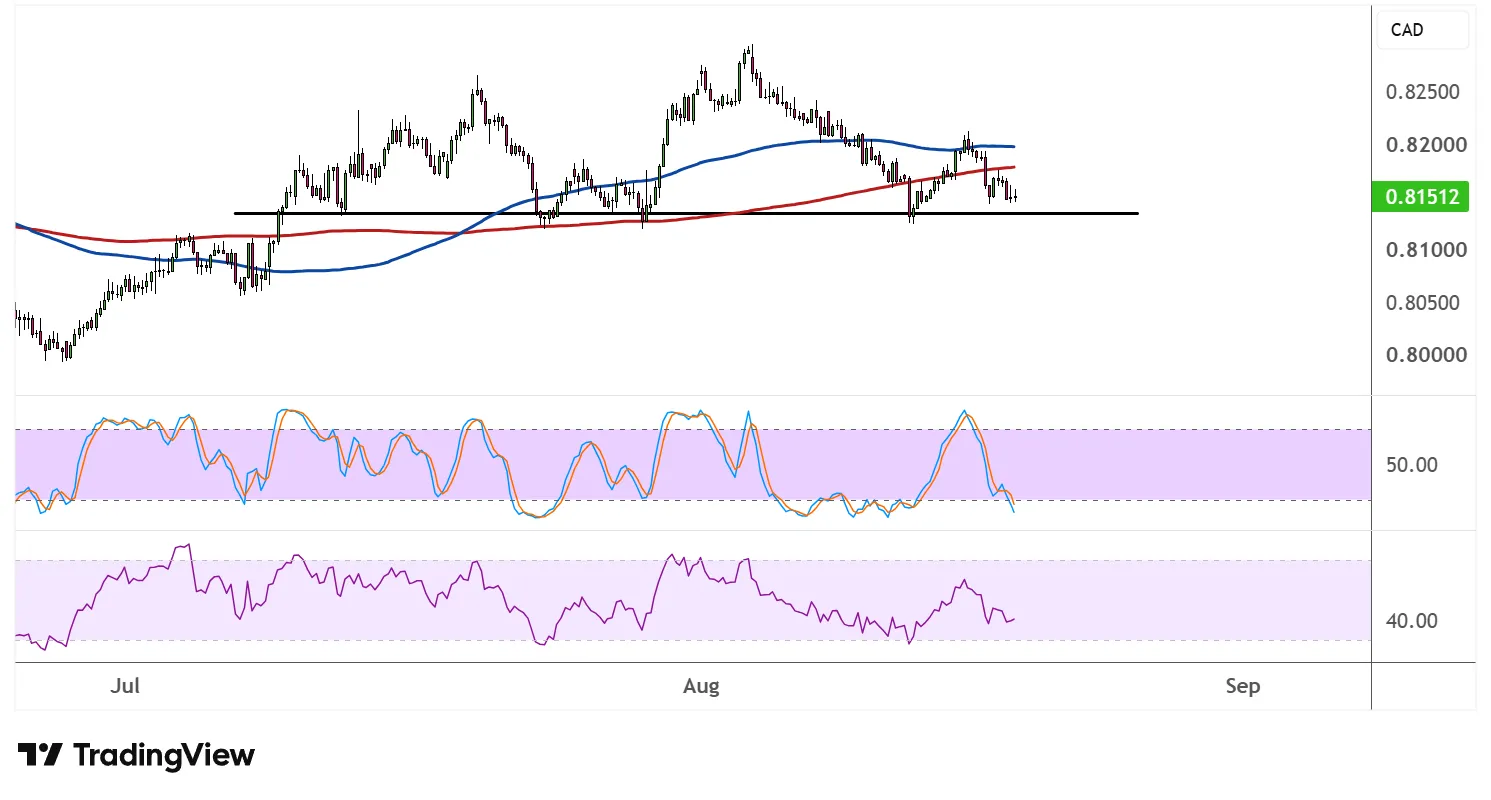
The 100 SMA has recently crossed below the 200 SMA, suggesting that the path of least resistance could be shifting to the downside or that sellers may be gaining the upper hand. Price is also trading below both moving averages, which could reinforce their role as dynamic resistance on any recovery attempts.
Stochastic has been sliding from the overbought zone and still has room to fall before reaching oversold territory, indicating that bearish momentum could continue building in the near term. RSI, meanwhile, is also pointing lower with some distance left before hitting oversold levels, so price could keep following suit while sellers remain in control.
NZDCAD traders may want to keep an eye on any catalysts from New Zealand or Canadian data releases that could accelerate a break of the neckline. A decisive close below this level, accompanied by rising volume or bearish momentum, would likely embolden sellers to pursue the pattern’s full downside target, while a bounce off the neckline could keep the broader range intact for now.
The Canadian dollar barely reacted to the release of stronger than expected CPI data earlier this week, as the focus appears to be on the FOMC minutes and the deadline of US tariffs on Canada.



Comments
Log in or sign up to join the conversation.