

NZDCAD has been trending higher above a broad ascending trend line since April, with the pair recently printing a swing high at 0.8269 before retreating sharply to test key support levels.
Price is currently hovering near the 50% Fibonacci retracement at 0.8136, and whether this floor holds could determine whether the longer-term uptrend resumes or gives way to a deeper correction.
The 38.2% Fib at 0.8167 has already been tested and broken to the downside, suggesting that sellers have retained some momentum from the recent peak. The 50% level at 0.8136 is the next line in the sand, and a failure to hold here could open the door to the 61.8% Fib at 0.8104.
A more significant correction could eventually bring the 100% retracement level at 0.8002 into focus, which also coincides with the trend line and could serve as the ultimate floor for a bullish pullback.
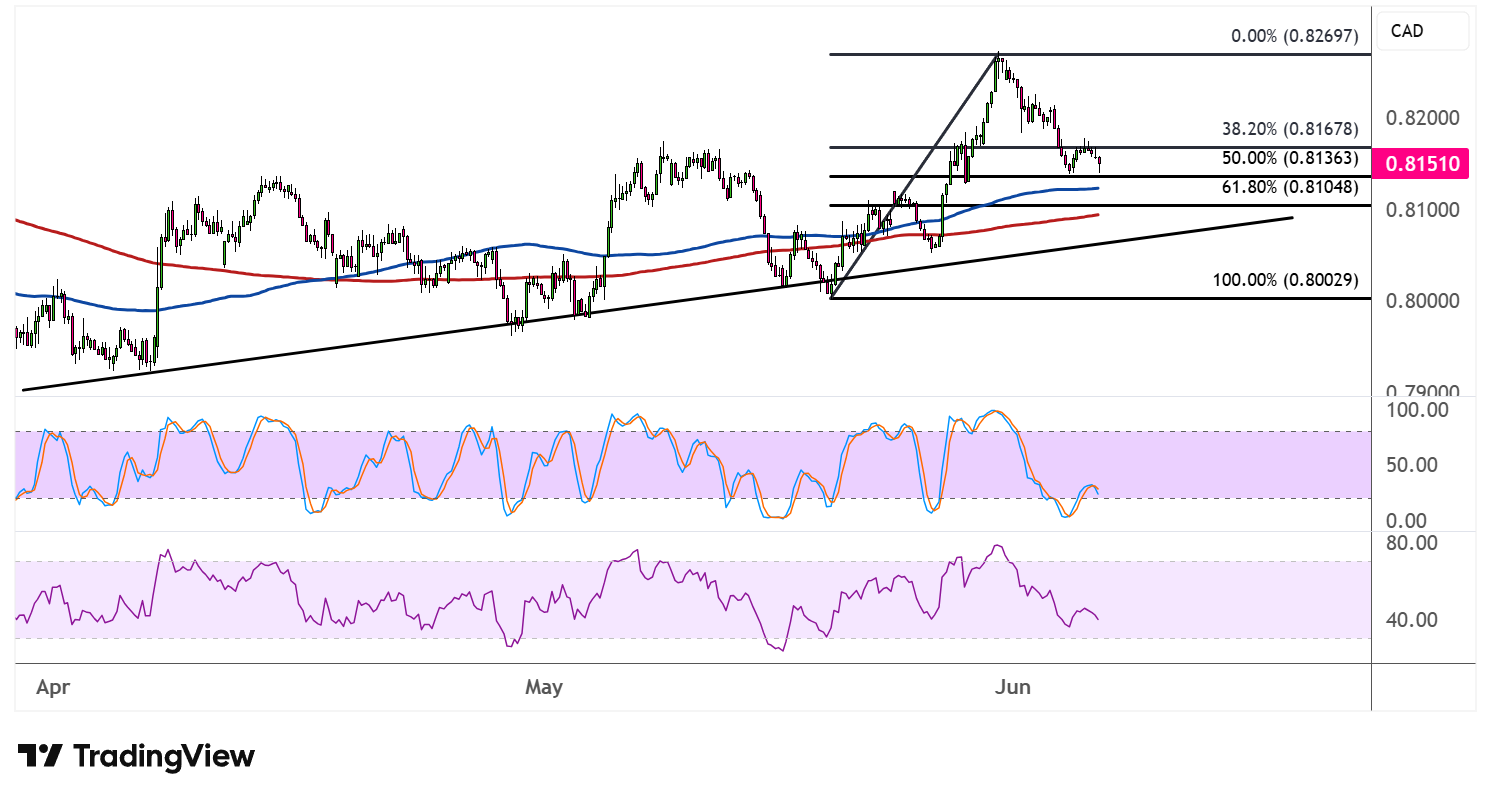
The 100 SMA is above the 200 SMA to confirm that the path of least resistance is to the upside or that the climb is more likely to gain traction than to reverse. Price is currently testing the 100 SMA dynamic support, so a bounce from this area could reinforce the bullish bias.
The gap between the moving averages, however, appears to be narrowing slightly, so a sustained break below could shift the tone.
Stochastic has dipped into the oversold zone, reflecting exhaustion among sellers and raising the possibility that a bullish reversal could be near. The oscillator appears to be turning up, which would suggest that buyers are starting to return.
RSI, on the other hand, still has some room to slide before reaching the oversold area, so the pullback could extend a little further before buyers fully take control.
If any of the Fibonacci levels hold as a floor, NZDCAD could resume the rally back toward the swing high at 0.8269 or higher. The Kiwi could take cues from overall market sentiment, while the Canadian dollar could find direction after Canada’s employment report is released later today.



Comments
Log in or sign up to join the conversation.