

Nvidia (NVDA) reported earnings last week on Wednesday, beating expectations of analysts as well as following its peers in "FANGMAN" (Facebook (FB), Amazon (AMZN), Netflix (NFLX), Google (GOOGL), Microsoft (MS), Apple (AAPL) and Nvidia).
But unlike Amazon, Apple or Facebook, which pushed to new highs after earnings smashed expectations, its stock saw a drop – what happened?
Nvidia's data numbers stand out, but short-term the FED matters
Numbers from Nvidia showed that for the first time in the history of the company, its data center business outperformed the gaming unit while the company's CEO Jensen Huang said he expects a major second half of the current fiscal year in the video game market.
Nvidia reported earnings per share at $2.18 against $1.97 expected and revenue at $3.87 billion against $3.65 billion expected. In fact, overall revenue rose 50% on an annualized basis and grew 39% in the prior quarter.
And while the company's gaming business produced $1.65 billion in revenue (+26% (YoY)), it ended up with $1.75 billion data center revenue, up 167%.
But while data center numbers, including sales of graphics processing units powering artificial intelligence workloads for business use and, thus, continuing the supply of products to cloud providers such as Amazon, the stock dropped – how can that be?
There are a few points to consider here:
- Shortly before Nvidia published its earnings, the FED statement pointed out that some FOMC members were worried about yield curve control since this could result in excessive balance sheet growth.
- The expectation of such a rate cap was one potential driver for the recent rally in growth stocks
- Thus in Nvidia, a short-term bounce once Equities see a correction, seems likely.
However, we think that the FED will sooner rather than later act here, stopping a potential rotation from growth stocks into value stocks which would result in elevated volatility in Equities, by implementing such a rate cap.
While we still see Nvidia Longs as an attractive mid- to long-term candidate which should be (and likely is due to its FANGMAN membership) part of any tech-oriented portfolio, a short-term corrective move lower in the stock price could be imminent.
How to trade NVDA in this environment?
With trading significantly above its SMA(200), the mode remains technically bullish longer term, but a sharper drop seems also likely from a technical perspective.
A drop below 430.00, especially below 390.00 USD, would neutralize the picture.
Still, we consider a re-test of the region around 400.00 USD an interesting region for pro-cyclical long engagements from a risk-reward perspective:
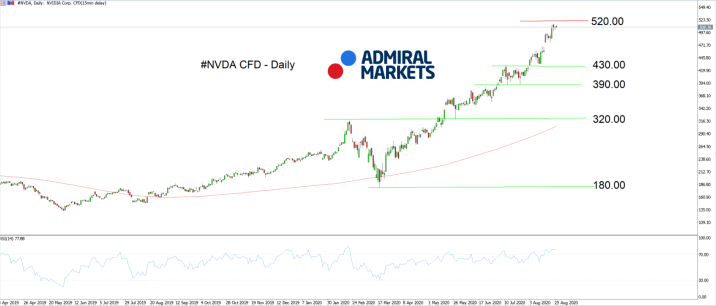
Source: Admiral Markets MT5 with MT5SE Add-on #NVDA chart (between April 03, 2019, to August 26, 2020). Accessed: August 26, 2020, at 2:00 PM GMT - Please note: Past performance is not a reliable indicator of future results, or future performance.
In 2015, NVDA increased by 64.39%. In 2016, it increased by 223.85%. In 2017, it increased by 81.28%. In 2018, it fell by -31.01% and in 2019, it increased by 76.25%, meaning that after five years, it was up by 1068.9%.



Comments
Log in or sign up to join the conversation.