


Nvidia fell 9.5% in the two sessions after Jensen Huang admitted an affair on November 8, 2026, while AMD gained about 15%. The viral “affair rally” charts offer no evidence that these events cause stock gains. In our chart comparison, Alphabet (GOOGL) and Microsoft (MSFT) outperformed the Nasdaq 100, though Microsoft was close to the index. In April 2025, NVDA held inside a Blue Box marked on our April 27 chart at $101.78 to $76.16, then advanced to $243.73 in October 2026.
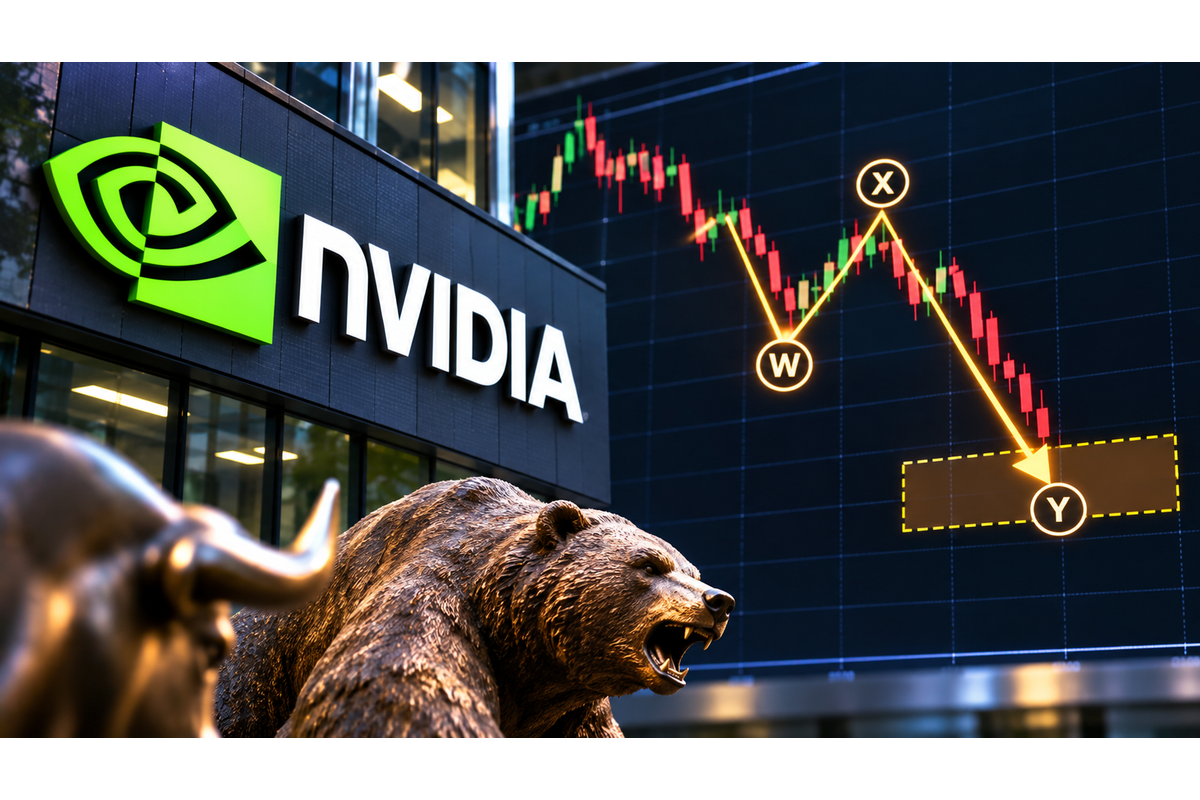
Key question: What does the latest NVDA sell-off show, and what can the 2025 Blue Box chart tell us?
Key Takeaways
NVDA closed at $168.89 on November 10, 2026, about 9.5% below its prior Friday close.
AMD gained over the same two sessions; the comparison alone does not establish why either stock moved.
The April 27, 2025 daily update showed a $101.78 to $76.16 Blue Box after the April low.
NVDA later reached $243.73 in October 2026, approximately 139.5% above the top of that box.
Four historical stock comparisons cannot establish that personal events caused long-term returns. Market forecasts can fail.
Here is Nvidia on the weekly chart, as it stands today.
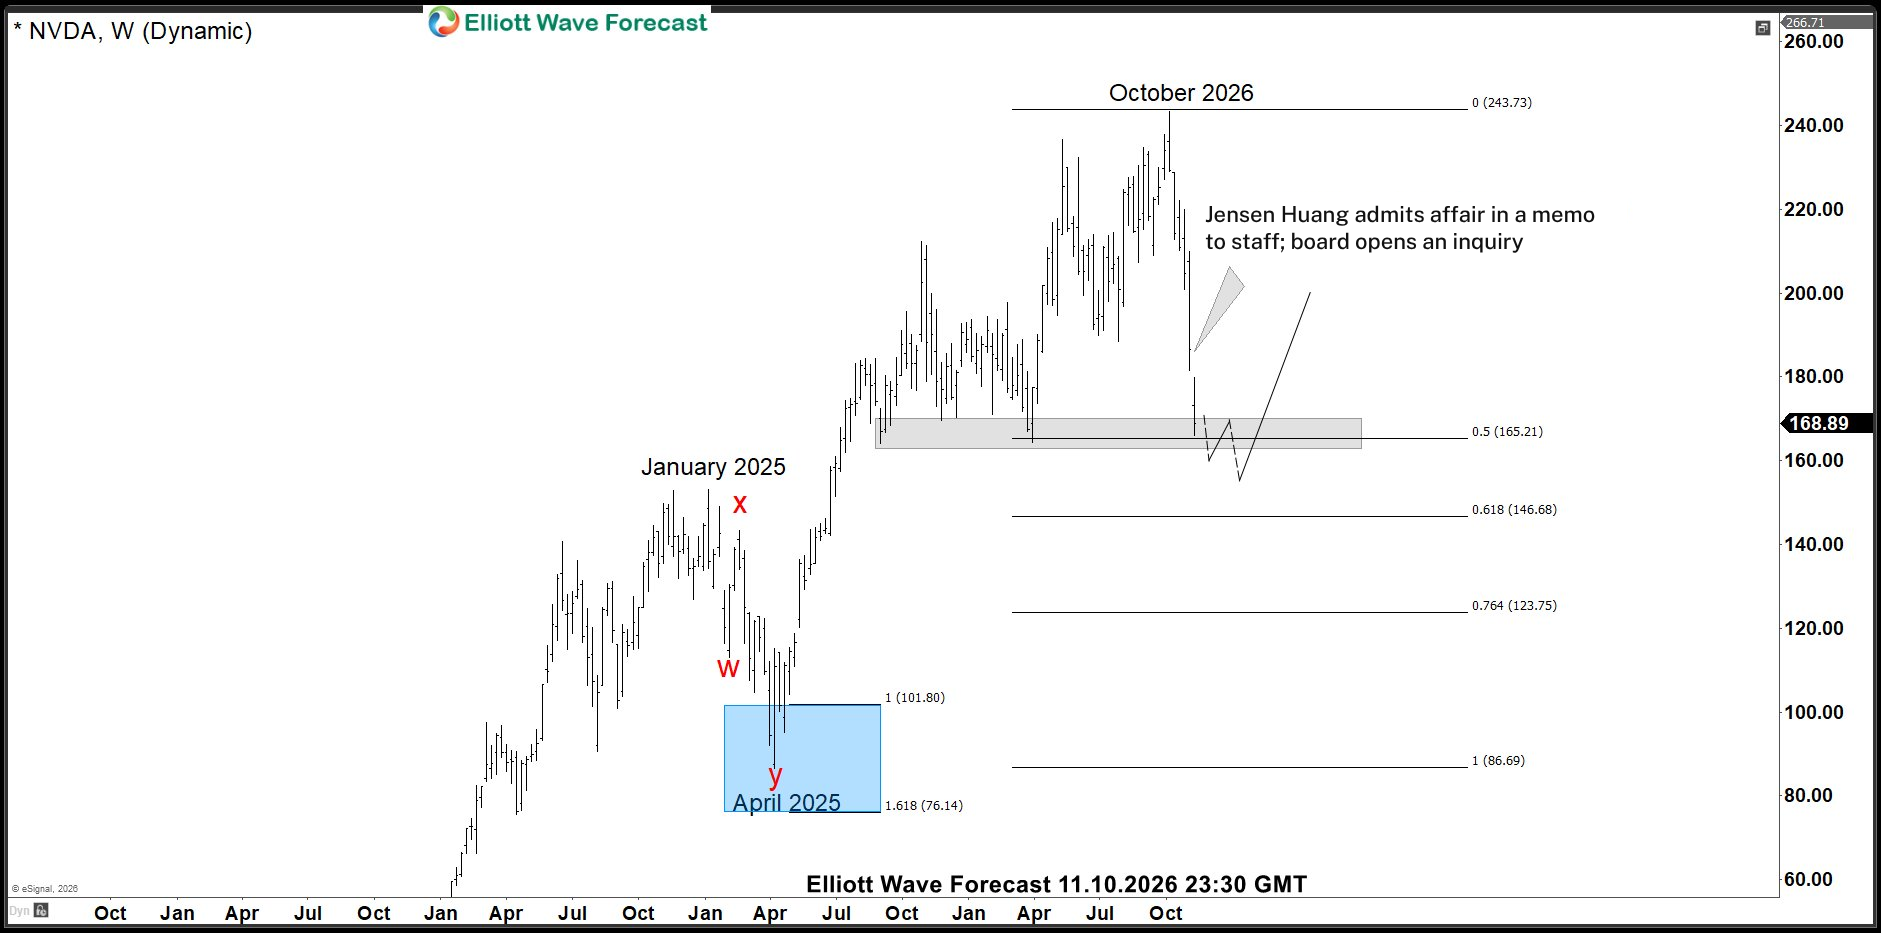
Today: NVDA weekly, November 10, 2026. The Blue Box at the bottom left is where the last panic ended.
Look at the blue box at the bottom left. That is where NVDA’s last big panic ended, in April 2025. We will come back to it.
What Happened This Week
On Sunday, November 8, Jensen Huang admitted an extramarital affair in a memo to staff. The woman is someone US intelligence reportedly believes could be a Chinese spy, and Nvidia’s board has opened an independent review.
NVDA fell from $186.64 at Friday’s close to $168.89 on Tuesday: 9.5% in two sessions. The rest of the chip sector didn’t follow. AMD gained about 15% over the same two sessions.
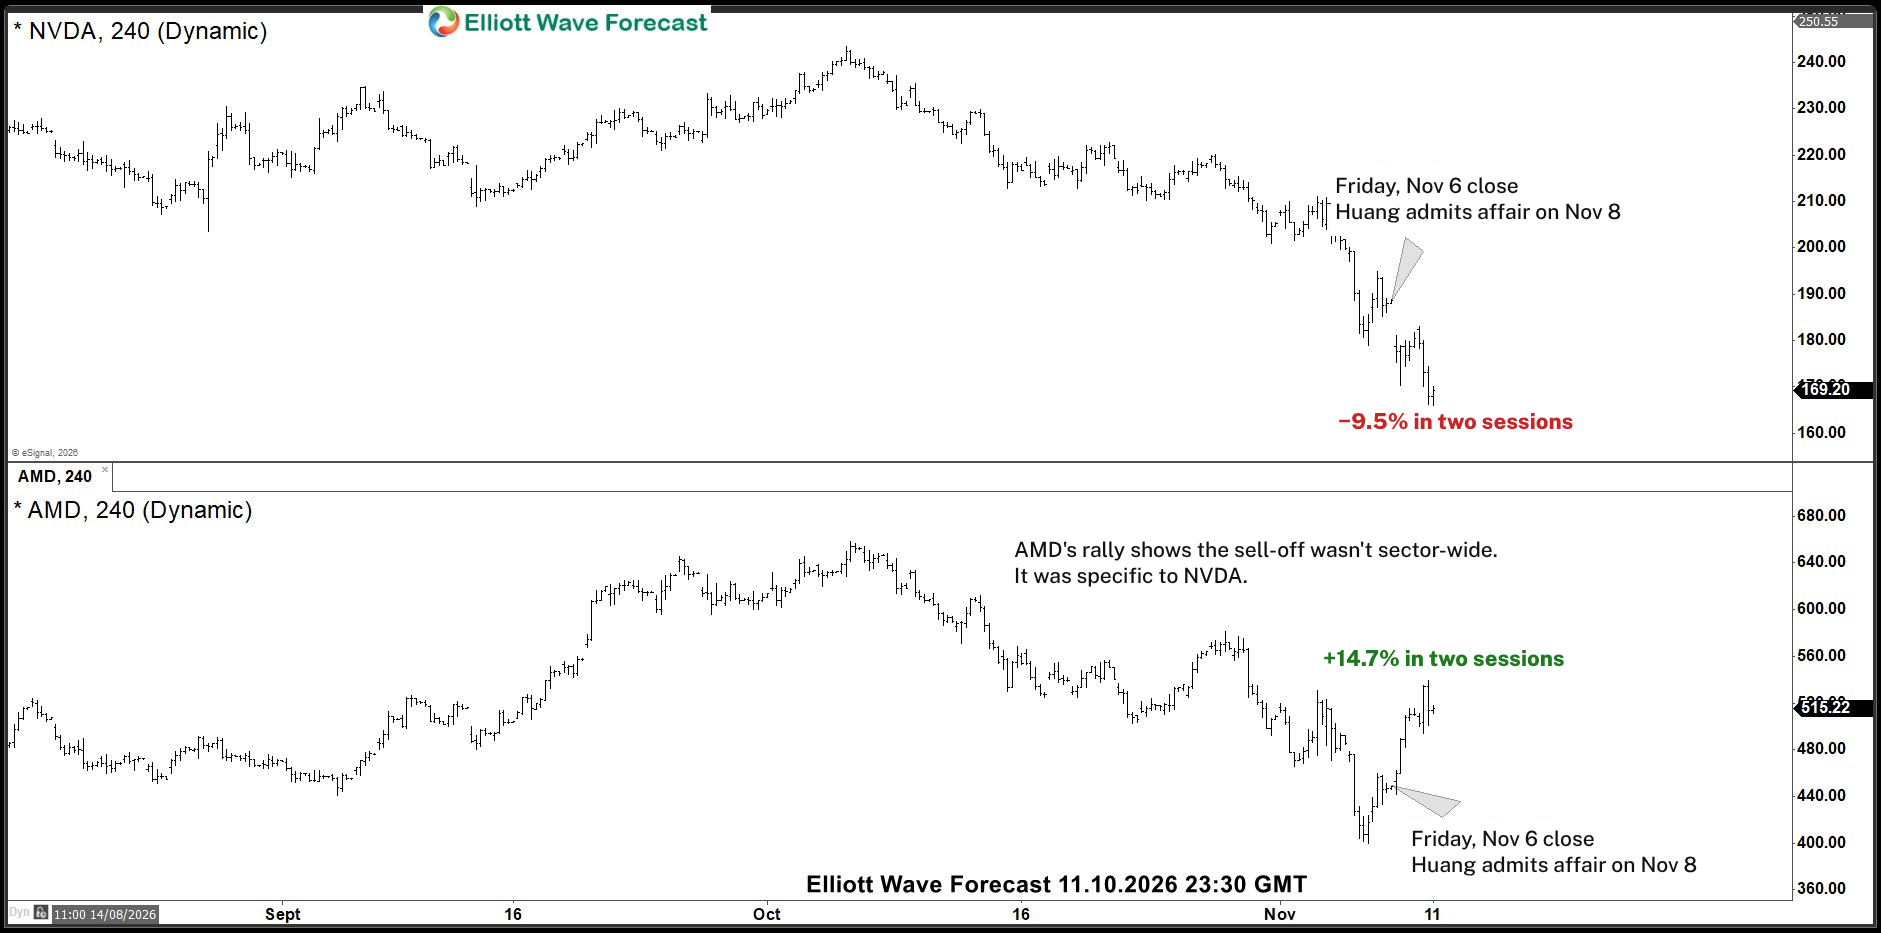
NVDA vs AMD, four-hour charts through November 10, 2026. AMD also benefited from a separate analyst upgrade.
Some analysts highlighted key-person risk, although investors may have considered several factors.
The “Affair Rally” Charts Going Viral
Graphics circulating on X and Instagram claim tech stocks rally after their leaders’ relationships make headlines, pointing to big gains at Alphabet, Amazon (AMZN) and Microsoft since each story broke. What they leave out is the market.
Stock (news) | Stock since | Nasdaq 100 since | Result |
|---|---|---|---|
Alphabet (Aug 2013) | +1,254% | +811% | Beat the index |
Microsoft (May 2021) | +115% | +109% | Beat by 6 points |
Amazon (Jan 2019) | +226% | +323% | Lagged by 97 points |
Intel (Jun 2018) | +9% | +282% | Lagged by 274 points |
The charts show eSignal price comparisons through November 10, 2026, using different start dates for each case. The Nasdaq 100 comparison uses futures. Results can vary with the start date, futures construction, corporate-action adjustments, and treatment of dividends.
In these chart comparisons, Alphabet outperformed by 443 percentage points and Microsoft by approximately 6 points. Amazon and Intel lagged. These are price comparisons across different periods, not evidence that the events caused returns.
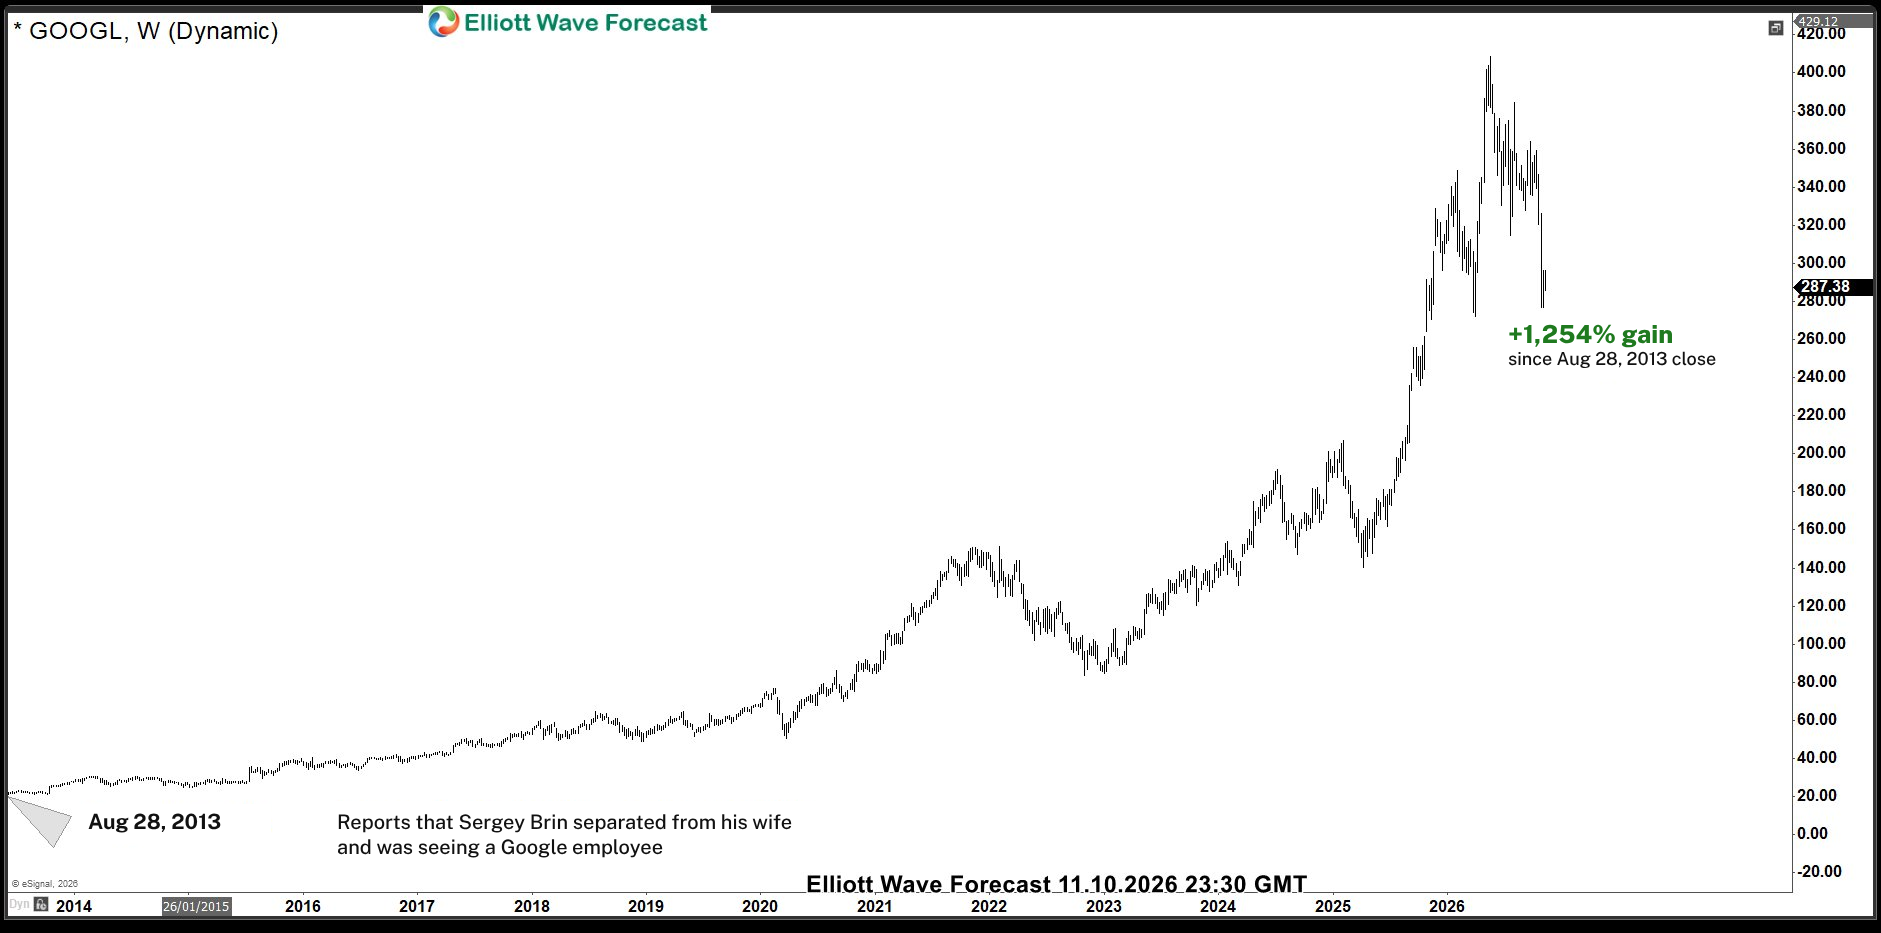
Alphabet: +1,254% since the August 28, 2013 close.
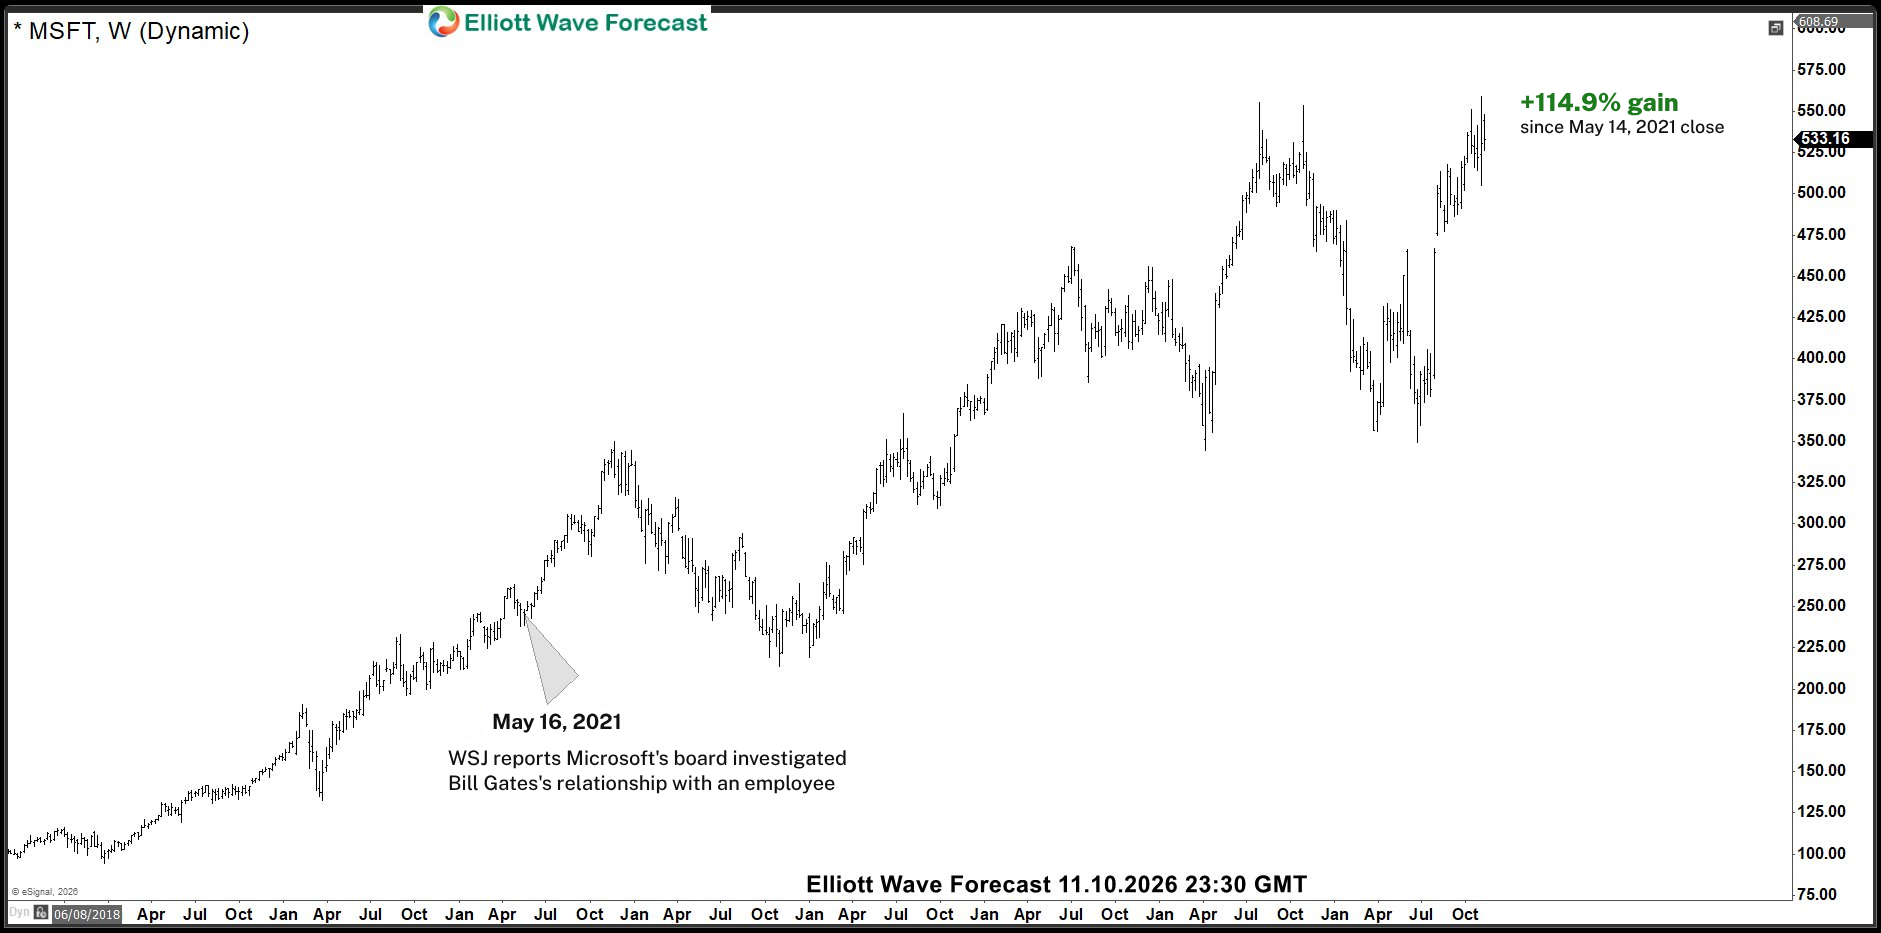
Microsoft: +114.9% since the May 14, 2021 close, close to the Nasdaq 100.
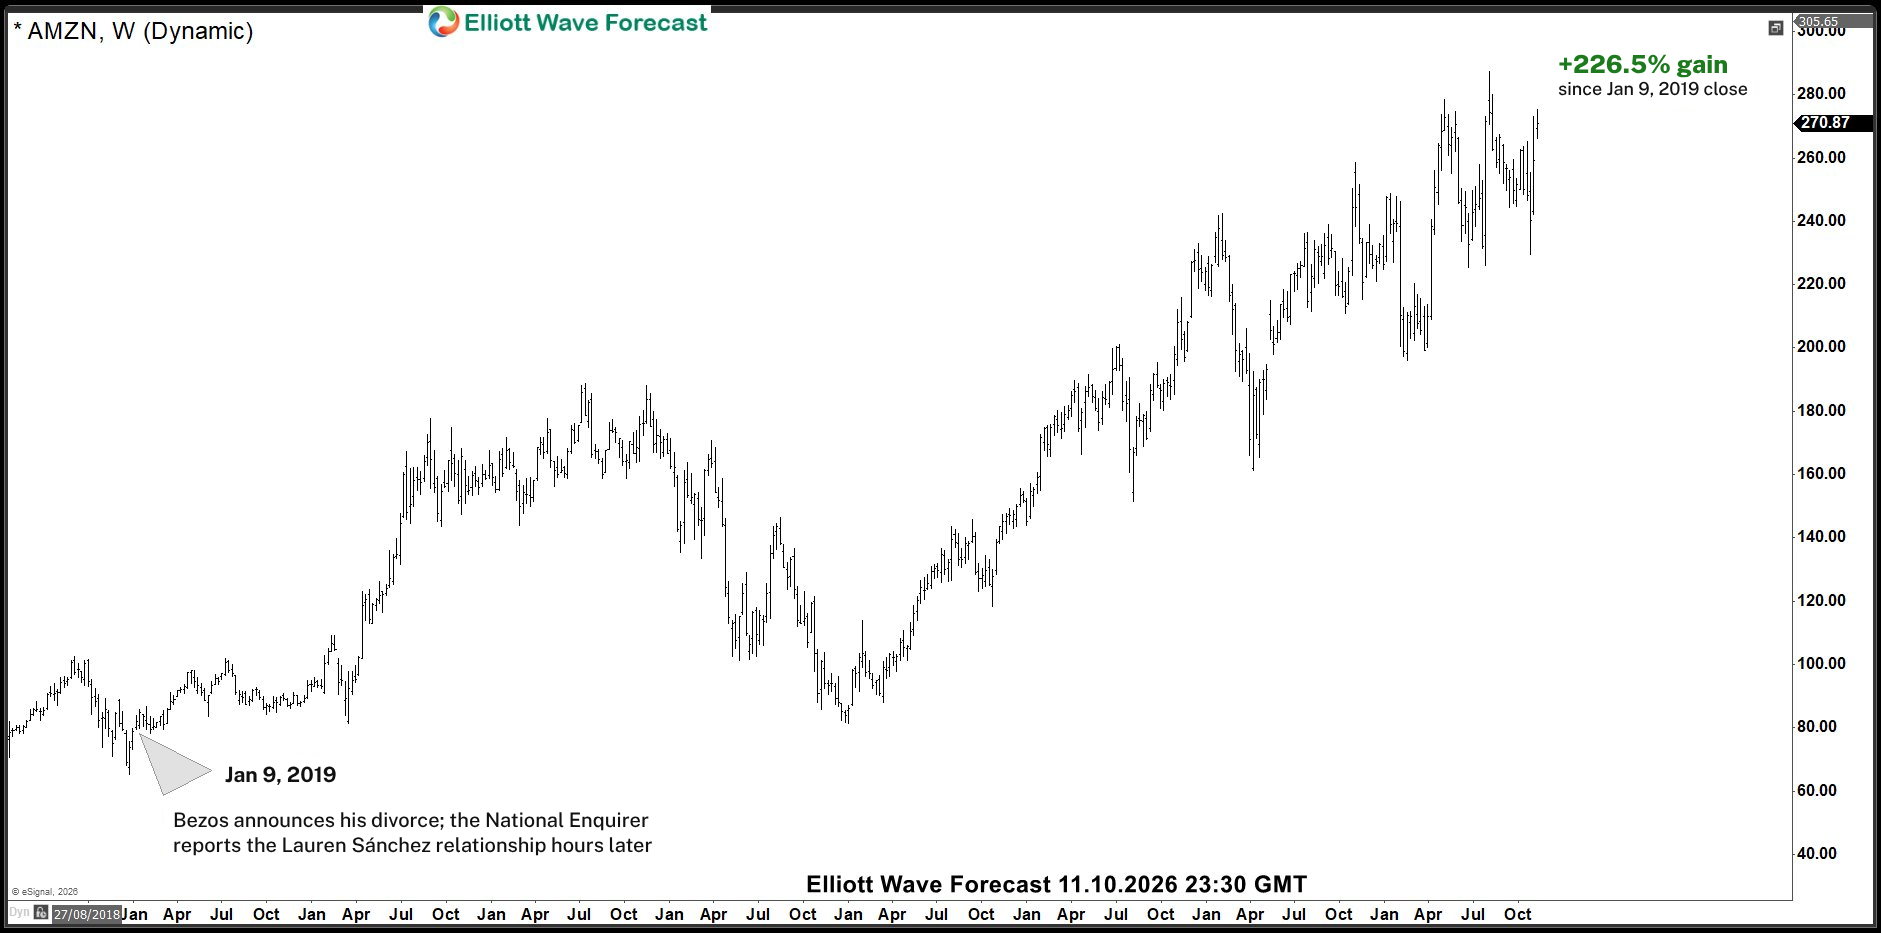
Amazon: +226.5% since the January 9, 2019 close, behind the Nasdaq 100’s +323%.
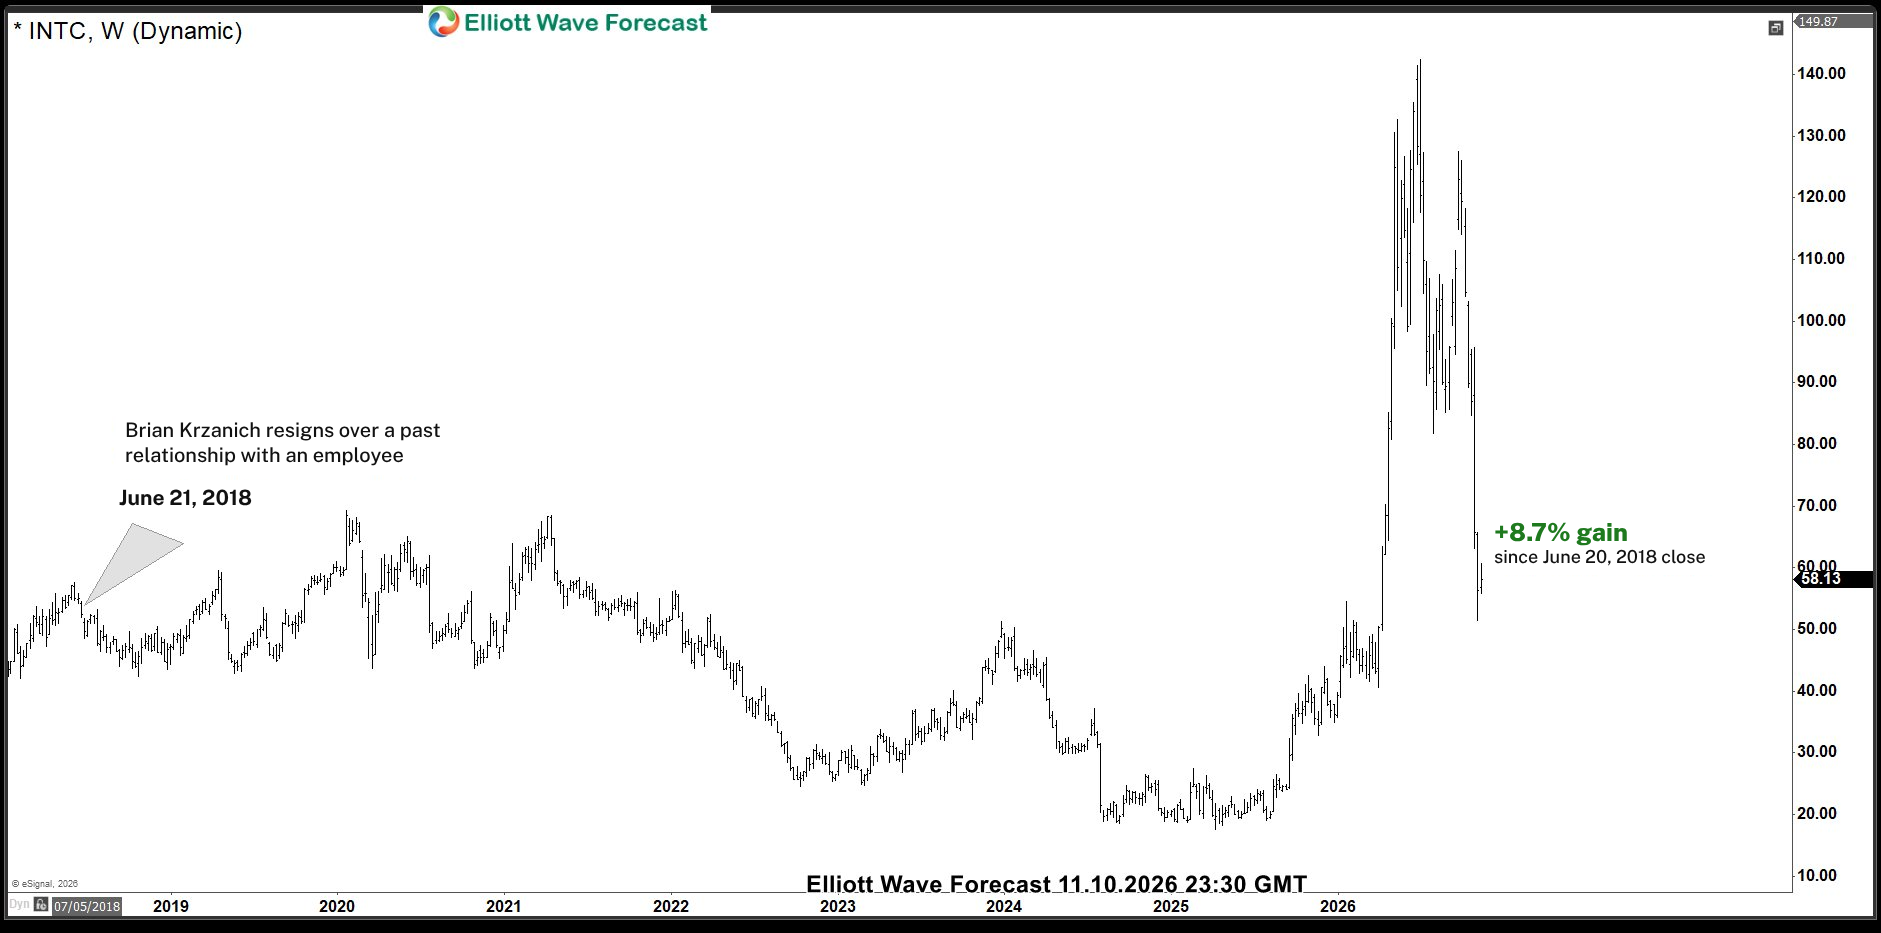
Intel (INTC): +8.7% since the June 20, 2018 close, while the Nasdaq 100 rose 282%.
These examples cannot establish cause and effect. Company performance and market conditions varied considerably across the periods shown.
For the rules behind this approach, see our Elliott Wave Theory guide and our explanation of WXY versus ABC corrections. For another historical reaction-zone example, see the Gold Blue Box case study. Our Does Elliott Wave Actually Work? article also includes a failed setup.
We’ve Seen NVDA Panic Before
During the April 2025 tariff sell-off, NVDA fell into the $80s and the headlines turned bearish on AI stocks. The chart below is the April 27, 2025 update, after the April low, with NVDA at $111.01. It marks a Blue Box from $101.78 to $76.16 and the preferred path higher.
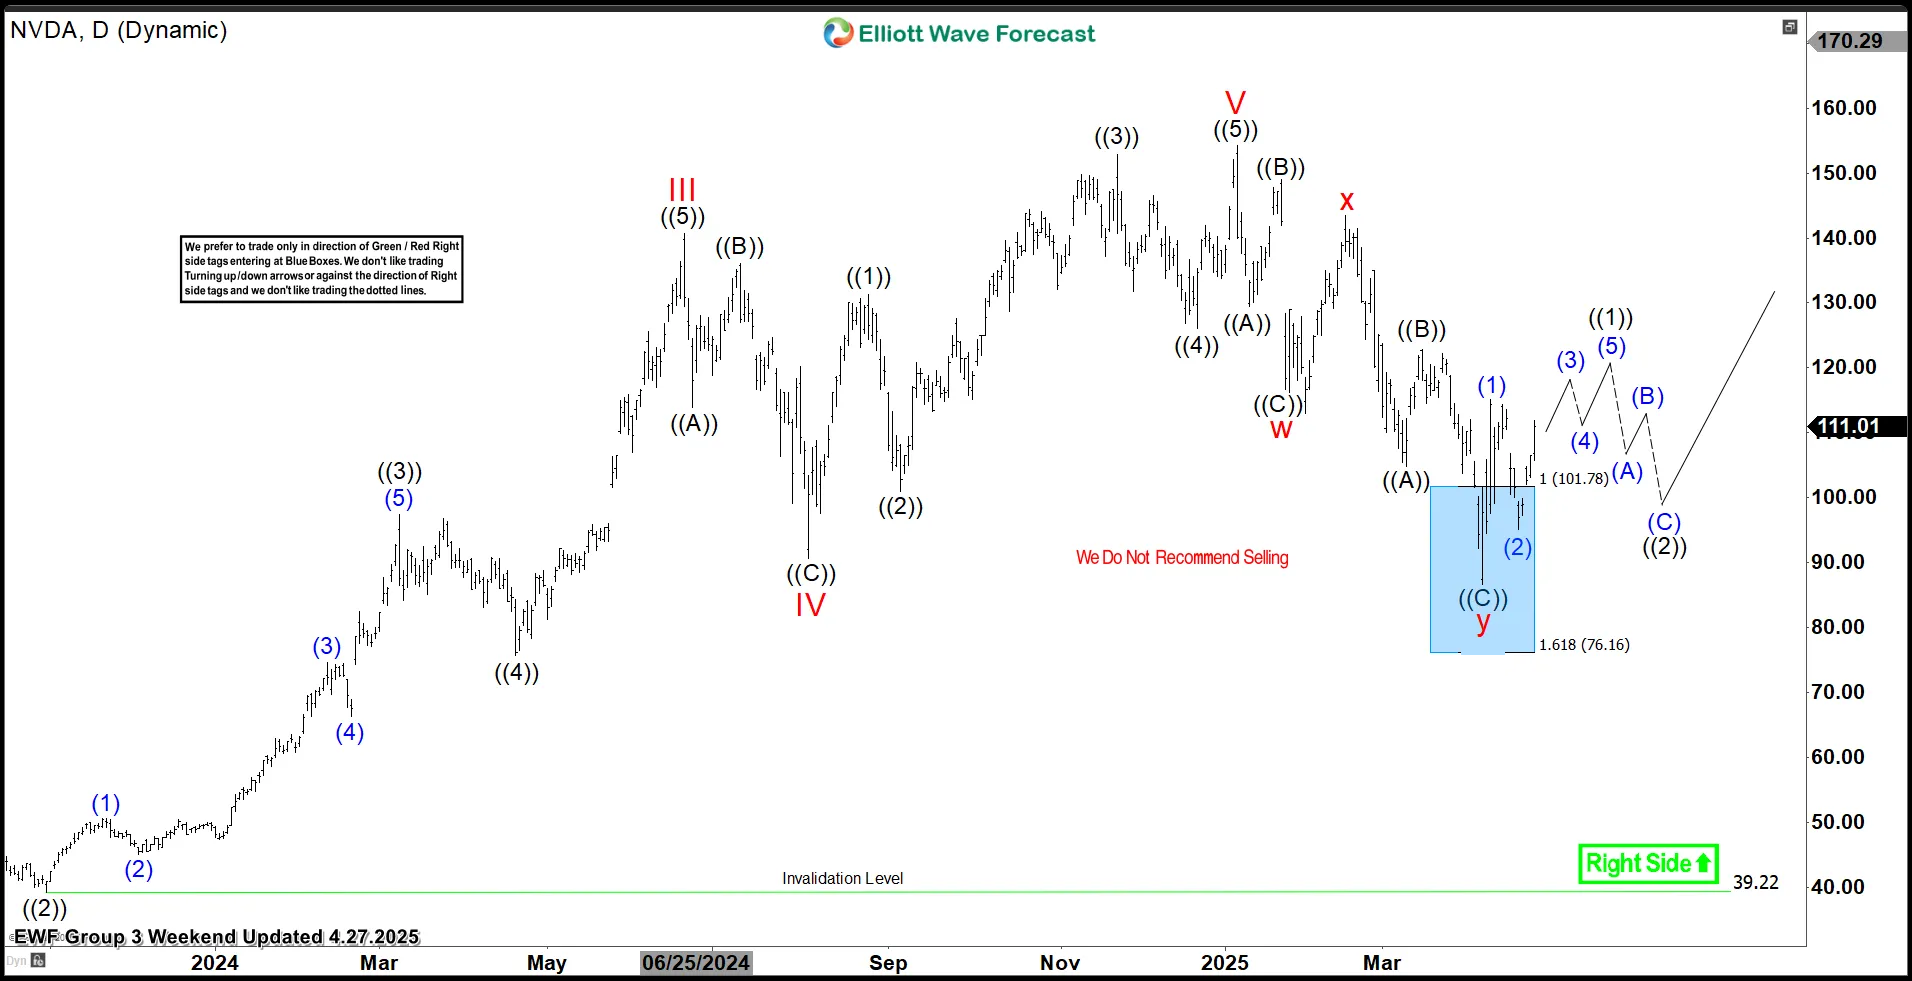
Then: NVDA daily, April 27, 2025. The low held inside the Blue Box, and the chart said: we do not recommend selling.
Chart shown | April 27, 2025, daily (after the April low) |
|---|---|
Instrument | Nvidia (NVDA) |
Price that day | $111.01 |
Structure | Double three (w-x-y) correction from the January 2025 high |
Blue Box | $101.78 to $76.16 (100% to 161.8% extension) |
Chart message | Do not sell; next leg higher expected from the Box |
What Happened Next
Result | Played out |
|---|---|
Low | Inside the Blue Box, April 2025 |
Peak | $243.73, October 2026 |
Move from top of the Box ($101.78) | +139.5% to the peak |
Move from the April 27 chart ($111.01) | +119.6% to the peak |
Latest (November 10, 2026) | $168.89, still +65.9% above the top of the Box |
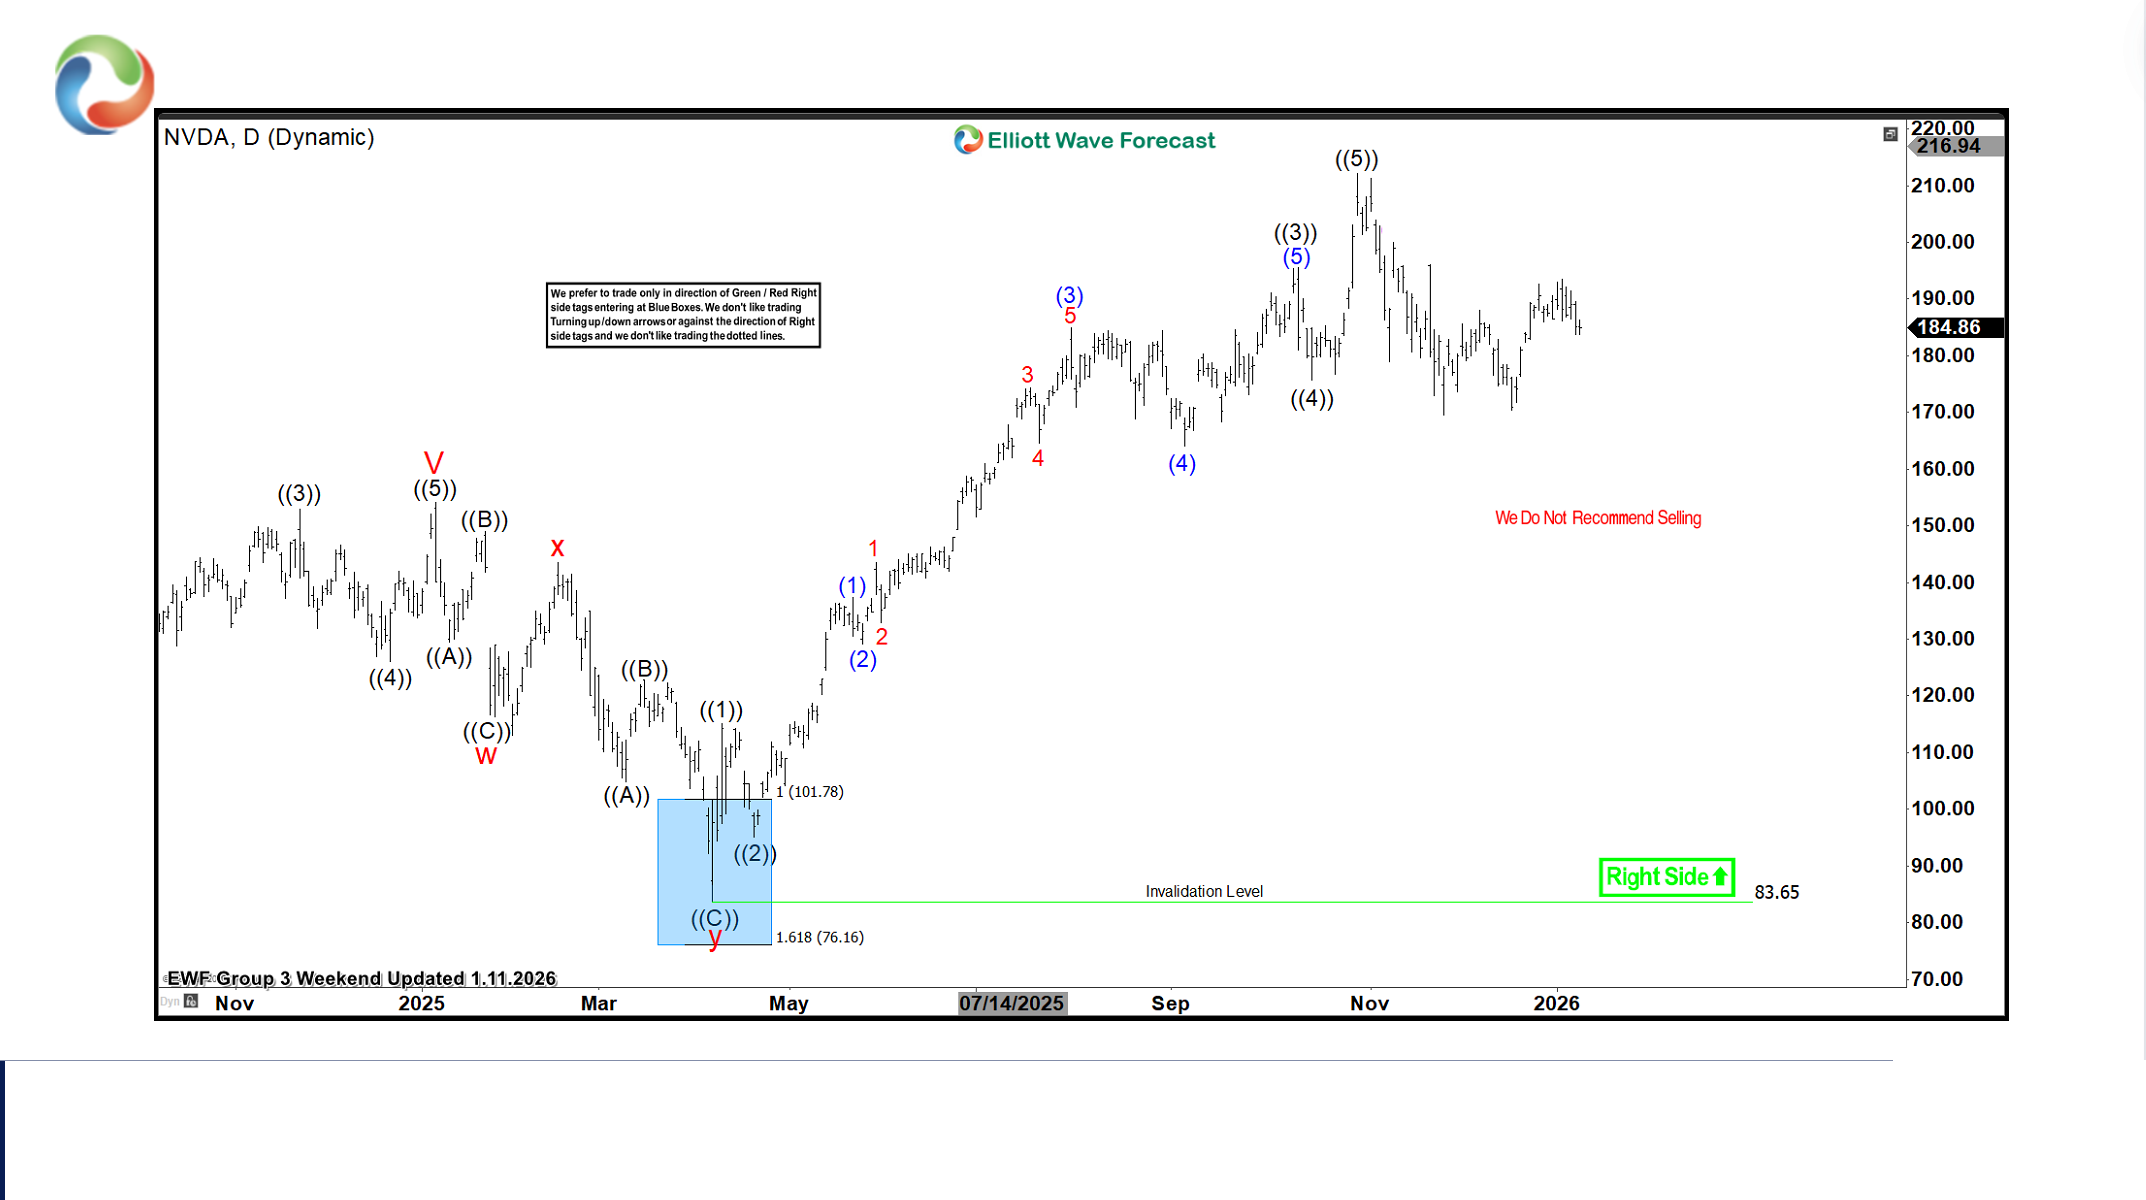
January 11, 2026: the daily chart shows the advance following the April 2025 Blue Box. The October 2026 peak occurred later and is shown on the weekly chart above.
What Would You Have Done With This Chart?
Put yourself back in April 2025. Tariff headlines every hour, recession talk everywhere, and NVDA down more than 40% from its January high. What would you have done?
Sold with the crowd? Locked in the loss near the low, as the headlines suggested.
Held and hoped? Sat through the volatility with no plan for where the drop should end.
Bought inside the Blue Box? Considered an entry in the zone with a defined risk plan.
The $10,000 Question
Bought at the top of the Blue Box, $101.78 $10,000 ≈ 98 shares
Value at the $243.73 peak≈ $23,900
Value at the November 10 close, $168.89≈ $16,600
Hypothetical illustration, before commissions and taxes. Not a recommendation.
The hard part was never the maths. It was acting while every headline said the opposite.
The Lesson
Headlines can move prices quickly. Wave structure offers one framework for mapping a possible path and a level where that view would be wrong. The April 27 chart presented a bullish interpretation after the low; it does not guarantee the same outcome now.
This week, which would you rather have open: the headlines, or the chart?
NVDALive for members
Where Does NVDA Go Next?
NVDA is down about 31% from its October high. Members can follow updated wave counts and, where available, reaction zones and invalidation levels. One free chart is a snapshot; the trial covers a chosen group of 26 markets, while Diamond covers 78.
NVDA levels: free article versus members’ area
Level | This article | Members’ area |
|---|---|---|
Next Blue Box(where available) | Not shown | Members only |
Current wave | Not shown | Members only |
Target area | Not shown | Members only |
Invalidation level | Not shown | Members only |
Next swing move | Not shown | Members only |
14-Day Trial$0.99About 7¢ a day · Cancel Anytime · 24-hour notice required
FAQ: NVDA and the Blue Box
Why did Nvidia shares fall in November 2026?
Nvidia shares fell after CEO Jensen Huang disclosed that he had been unfaithful, and the company announced an independent board review. The full reasons for the market move cannot be established from price action alone.
What did the April 27, 2025 NVDA chart show?
The April 27 daily chart marked a Blue Box between $101.78 and $76.16 after the April low, with a preferred path higher.
How much did NVDA rise from the Blue Box?
From the top of the April 2025 box at $101.78 to the October 2026 peak of $243.73, the price increase was approximately 139.5%. This is a historical price comparison, not a guaranteed return.
Do the historical comparisons prove that affairs drive stock gains?
No. Four examples measured over different periods cannot establish causation. Stock returns reflect many factors, and comparisons depend on the periods and benchmarks chosen.
Does a Blue Box guarantee a bounce?
No. A Blue Box is a potential reaction zone, not a guarantee. Price can break a level and an Elliott Wave count may need to be revised.
Sources for the news and November price moves: Yahoo Finance, CNBC. Historical closes from eSignal. Reports of alleged intelligence ties are unconfirmed and under investigation.
Disclaimer: Futures, options, stocks, ETFs and over-the-counter foreign exchange products may involve substantial risk and may not be suitable for all investors. This article is for educational purposes and is not investment advice. The $10,000 example is a hypothetical illustration before costs and taxes. Past performance does not guarantee future results. Elliott Wave Forecast views can change after publication.


Comments
Log in or sign up to join the conversation.