
With the stock market having gained ground yet again last month (July’s return of 1.93% for the S&P 500 was the second best of 2017) and sporting a return of 10.4% on the year, the question of the day is, where do we go from here?
The bulls argue that it will be onward and upward. Our heroes in horns point out that the economy is growing at a pace that is above the average seen during the current 8-year economic recovery, earnings are growing above trend, inflation remains low, and rates, while likely to move modestly higher in the coming quarters, are low enough to encourage investment. Now mix in the expectations for tax reform and less regulation, and, well, the picture is rosy, we’re told.
As you might expect, the view is a bit different in the opposing dugout. Our furry friends contend that valuations are extremely high, the QE Era is ending, “peak passive” may be at hand, this is now the second longest period in history without a 20% correction, investor sentiment is too positive, and that market leadership has narrowed considerably this year. Therefore, the bears argue that stocks are set up for a fall. And not the 1-2 week type of affair that has become the norm. No, those seeing the market’s glass as at least half empty suggest that the next decline might put some fear back in the “fear index.”
When I find myself conflicted about what to expect next in the stock market, I look to (a) the bond market and (b) the historical cycles for clues.
As for bonds, make no mistake about it; the big, bad, bond bear that so many have been calling for since the Fed first started “talking taper” back in 2013, has yet to materialize. In fact, the trend of bond yields (I’m looking at a weekly chart of 10-year yields here) is clearly down. Thus, one can argue that economic growth – and, in turn, inflation – is not expected to become robust anytime soon. As such, stock market valuations could certainly become an issue if a bearish catalyst were to come out of the wood work.
Then there are the historical market cycles. The folks at Ned Davis Research Group create a “cycle composite” of various market cycles that can be very helpful in trying to figure out what might happen next in the stock market.
Long-time readers know that the cycle composite uses data going back to 1900 and is comprised of all 1-year seasonal cycles, 4-year Presidential cycles, and 10-year decennial cycles. NDR mashes all the cycles together to create a composite projection for the market each year.
Here’s the thing… When the market is “in sync” with the historical cycles, the composite’s projection can be scary good. But at other times, well, not so much.
The chart below shows the composite (the red dashed line) and the returns of the S&P 500 going back to 2010. There are a couple items to note here. First and foremost, note that the market and the cycle projection are almost in the exact same spot some 7.5 years later. Thus, one could argue that the composite has done a very good job in “calling” the longer-term direction of the market.
(Click on image to enlarge)
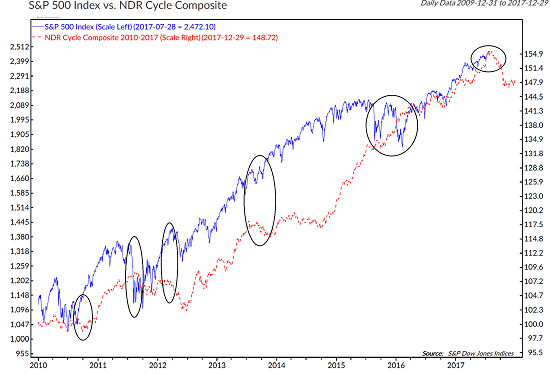
However, as I’ve indicated on the chart (the circled areas), there are definitely times when the market zigs instead of the zag the composite called for. For example, in late 2010, stocks rallied strongly instead of moving sideways. In 2011, stocks dove when the composite was pointing higher. In 2013, the market marched steadily higher instead of moving down. And the same thing happened during the August 2015 – February 2016 mini bear as stocks moved down when the cycles were pointing higher.
So, what do the cycles project next for stocks, you ask? Let’s take a closer look at 2017 to find out…
(Click on image to enlarge)
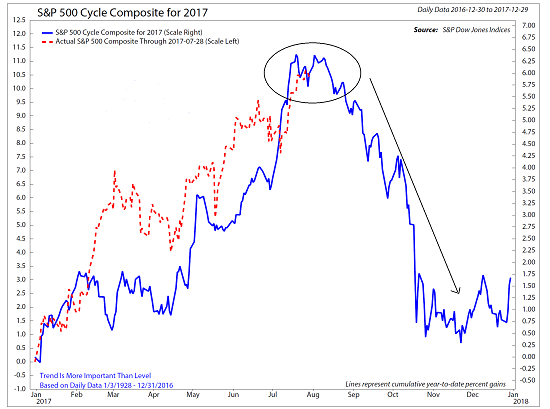
Hmmm… that’s definitely not a pretty picture. In short, the cycle composite is calling for a prolonged decline that will start very soon and last through mid-November. And while the trend of the projection tends to be MUCH more important than the actual levels projected, the composite suggests that the upcoming decline could wipe out a good chunk of the gains seen so far in 2017. Ughh.
To be sure, making a projection in this business is a great way to go out of business. The bottom line here is if there is anything I’ve learned over the last 30+ years, it is that Ms. Market has a mind of her own! Therefore, the caveat here is that meaningful declines usually require a catalyst. And if some sort of negative trigger fails to materialize, stocks could easily continue to march merrily higher instead of experiencing a meaningful correction.
Yet at the same time, the cycle composite’s projection tends to be pretty darn good more often than not. So, at the very least, it is probably a very good idea to “look alive” and not succumb to the complacency that seems to be prevalant at this time.
Thought For The Day:
It’s a funny thing, the more I practice the luckier I get. – Arnold Palmer
Current Market Drivers
We strive to identify the driving forces behind the market action on a daily basis. The thinking is that if we can understand why stocks are doing what they are doing on a short-term basis; we are not likely to be surprised/blind-sided by a big move. Listed below are what we believe to be the driving forces of the current market (Listed in order of importance).
1. The State of the U.S. Economic Growth (Fast enough to justify valuations?)
2. The State of Earnings Growth
3. The State of Trump Administration Policies
4. The State of Fed Policy


Comments
Log in or sign up to join the conversation.