


After yet another vicious fake-out on July 29th, the market has resumed its old ways of banging out lifetime highs on a daily basis (weekends notwithstanding). Here are eight key index charts below, with brief remarks by me beneath each one:
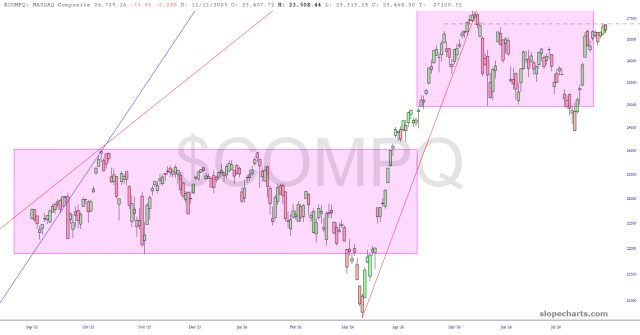
The NASDAQ Composite is nearly at lifetime highs, and that dashed red line is pretty much the last line in the sand before tech stocks join the party.
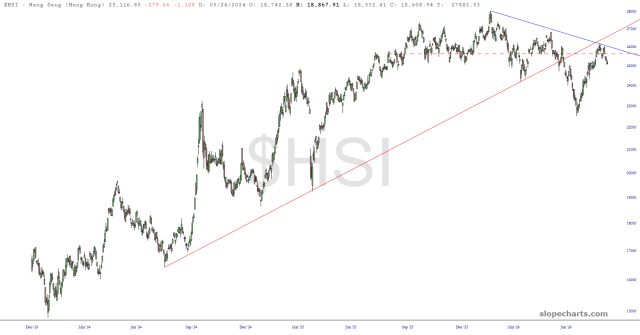
Nearly my last bearish hope is in the form of China, which is my one and only remaining options position (March 2027 FXI puts). The Hang Seng index is well poised for a hard fall in the months ahead.
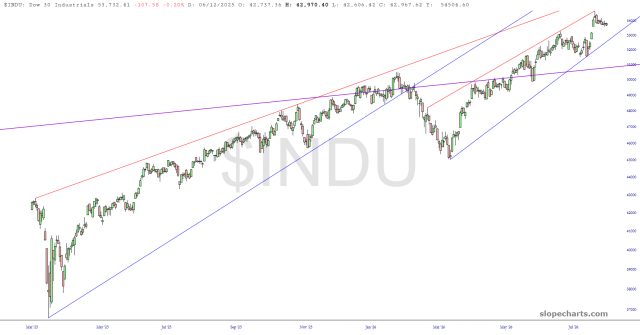
The Dow Industrials has stalled out for more than a week, after its shooting star pattern. Keep an eye on that rising wedge for a failure.
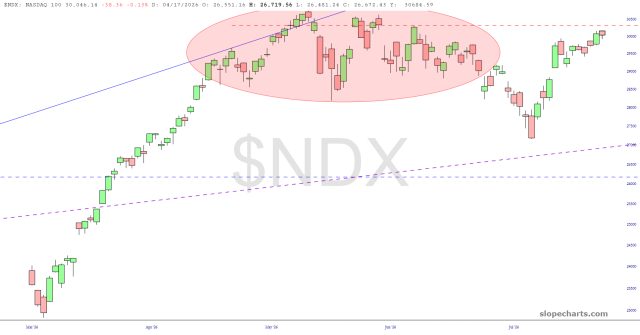
The NASDAQ 100 still has a wispy chance of falling. The dashed red line is anchored to the prior “lower high”, but it’s going to take, to borrow a phrase from your hero, something very, very special to get it done.
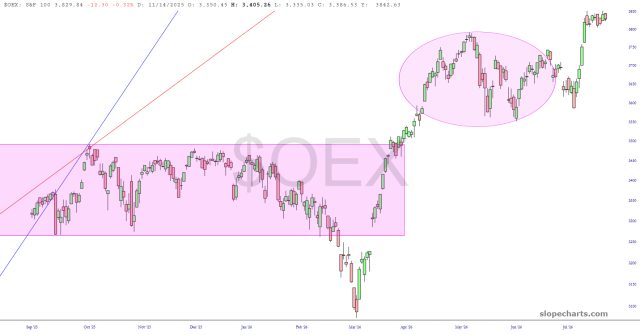
The S&P 100 has stalled out for eight days in a row, forming a flag pattern.
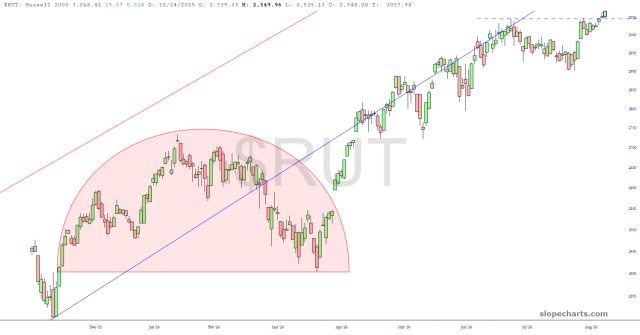
The most resolutely bullish index these days is the small caps, which closed at clean lifetime highs on Friday.
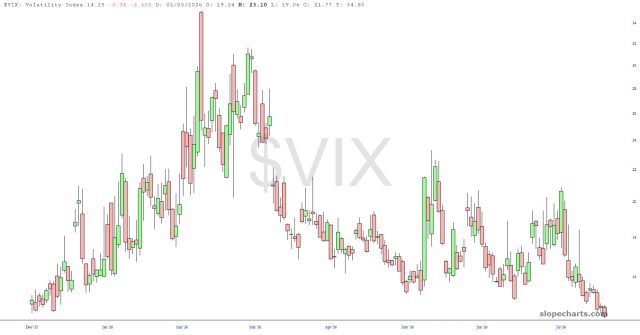
And volatility is at LOWS FOR THE YEAR, which makes a lot of sense, since there is absolutely zero geopolitical uncertainty, the national debt is being paid down on a robust pace, energy is cheaper by the day, and the AI revolution has absolutely no chance of faltering.
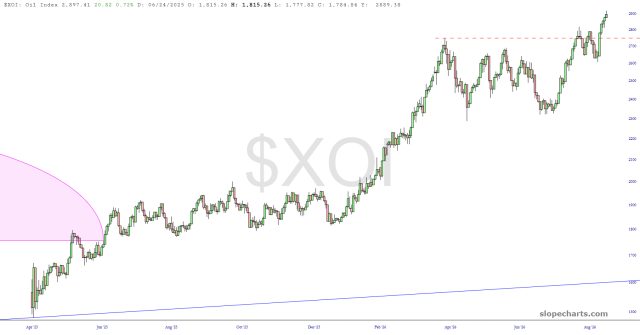
And, speaking of energy, the oil and gas producers are having a grand old time, now that the U.S. has totally stepped in it with the Middle East.



Comments
Log in or sign up to join the conversation.