

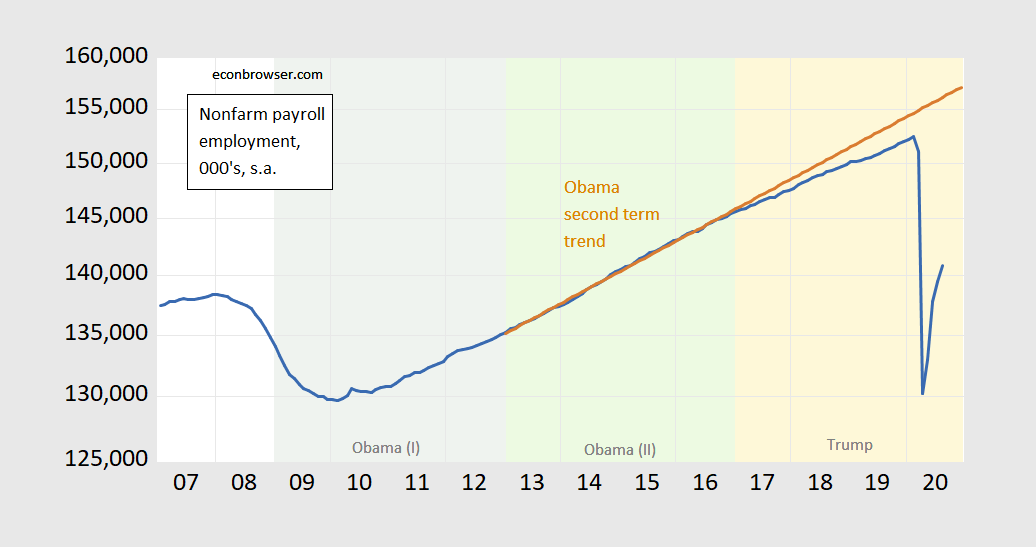
Figure 1: Nonfarm payroll employment (blue), deterministic trend estimated 2013M01-2017M01 (brown), both on log scale. Source: BLS and author’s calculations.
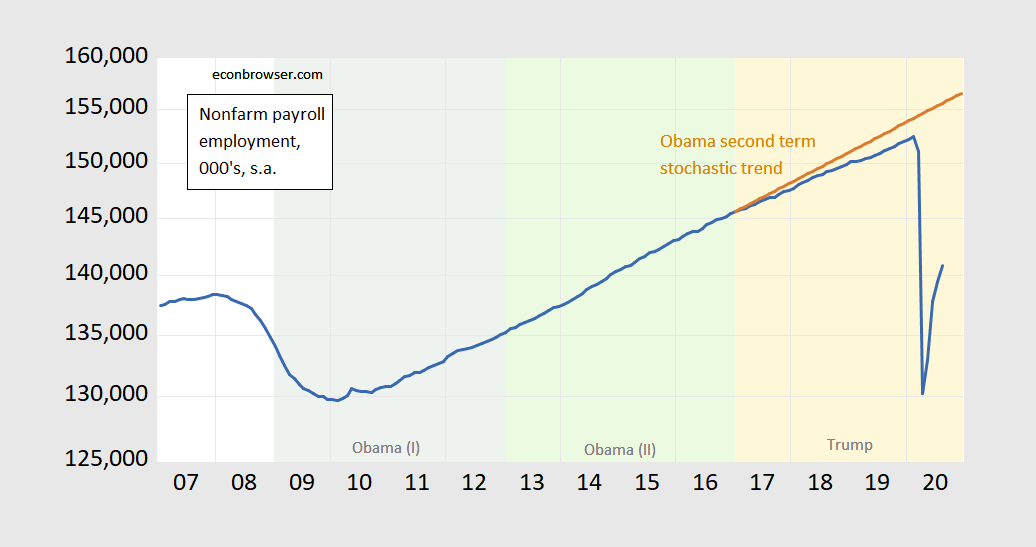
Figure 2: Nonfarm payroll employment (blue), stochastic trend estimated 2013M01-2017M01 (brown), both on log scale. Source: BLS and author’s calculations.
The above graphs are useful if you thought everything was hunky-dory employment-wise, even before the pandemic hit.


Comments
Log in or sign up to join the conversation.