
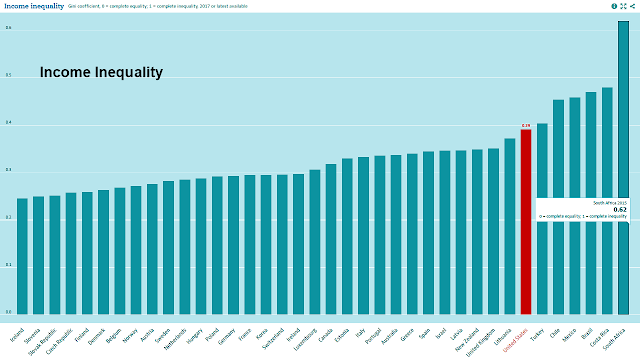
The US is indicated in red. It is surprisingly low in disposable household income and rather high in income inequality.
It is not two much of a stretch to say that the US is now divided into two nations, not entirely separate but increasingly unequal.
Not only will there be no sustainable recovery, but the badly strained social fabric may not hold together.

Real household net disposable income is defined as the sum of household final consumption expenditure and savings, minus the change in net equity of households in pension funds. This indicator also corresponds to the sum of wages and salaries, mixed income, net property income, net current transfers and social benefits other than social transfers in kind, less taxes on income and wealth and social security contributions paid by employees, the self-employed and the unemployed. Household gross adjusted disposable income additionally reallocates "income" from government and non-profit institutions serving households (NPISHs) to households to reflect social transfers in kind.
Income is defined as household disposable income in a particular year. It consists of earnings, self-employment and capital income and public cash transfers; income taxes and social security contributions paid by households are deducted. The income of the household is attributed to each of its members, with an adjustment to reflect differences in needs for households of different sizes.
Income inequality among individuals is measured here by five indicators. The Gini coefficient is based on the comparison of cumulative proportions of the population against cumulative proportions of income they receive, and it ranges between 0 in the case of perfect equality and 1 in the case of perfect inequality. S80/S20 is the ratio of the average income of the 20% richest to the 20% poorest; P90/P10 is the ratio of the upper bound value of the ninth decile (i.e. the 10% of people with highest income) to that of the first decile; P90/P50 of the upper bound value of the ninth decile to the median income; and P50/P10 of median income to the upper bound value of the first decile. The Palma ratio is the share of all income received by the 10% people with highest disposable income divided by the share of all income received by the 40% people with the lowest disposable income.


Comments
Log in or sign up to join the conversation.