

The Nikkei index closed today's session with a rise of close to 1% driven mainly by the push of technology companies, thus continuing with the rises led by the US Nasdaq. Following the upwards movement in the last few sessions, it has managed to reach its all-time highs. Specifically, the Japanese selective scored 0.96% to 29,441.30 points.
Although a few weeks ago we commented on the problems that the Japanese economy was experiencing due to the increase in the unemployment rate and the fall in consumption caused by the pandemic, the evolution of the Japanese yen against the dollar is favoring companies in the country of the rising sun, since the weakness of its currency benefits exports and the competitiveness of its products.
As we commented in yesterday's technical analysis, we will have to be very attentive to the evolution of the USDJPY price in the coming weeks, since if the price manages to recover the level of 110,000 in a sustained way, a new upward momentum could be formed in search of the annual highs. Breaking these highs could open a bullish rally to the level of 112,240 or higher.
If we focus on the Nikkei index, technically speaking, since the Japanese selective marked highs last December the price has been consolidating in a sideways range with a bearish bias. However, after finding support in its average of 200 sessions and in the level close to 27,600 points, the price has experienced a bullish impulse, which has caused an upward crossing of the price and its moving averages of 18 and 40 sessions.
Along with the latest rises, this crossover could lead the Nikkei to face its current resistance level at the medium-term downtrend line, despite the accumulated overbought that we can see in the stochastic indicator. Breaking this trend line could lead the price to seek its zone of highs.
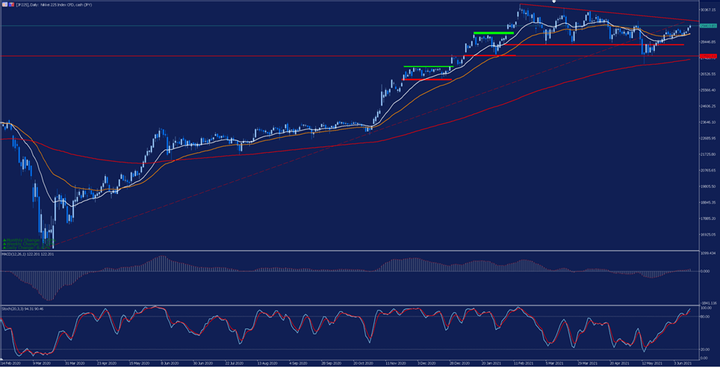
Source: Admiral Markets MetaTrader 5. Jp225's daily chart. Data range: February 14, 2020 to June 15, 2021. Prepared on June 15, 2021 at 12:05 pm CEST. Please note that past returns do not guarantee future returns.
Evolution in the last 5 years:
- 2020: 16,01%
- 2019: 18,20%
- 2018: -12,08%
- 2017: 19,10%
- 2016: 0,42%



Comments
Log in or sign up to join the conversation.